Tag Archives for " technical analysis "

earnings season begins

Final Death Throes | Stock Market Update

This brief video is a very small segment of what my Insider Members get daily and weekly.  In this stock market update I review the S&P 500 (SPX) on a daily, weekly and monthly basis. I also look at the semiconductors, homebuilders and high yield bond fund.  

As I state in the video, my wave counts are close to completion and why I believe the stock market is in the final death throes of this bull market. Continue reading

trading tips

Is the Chart’s Story Clear or Confusing?

This post is a repeat of one I published over two years ago.  The title of that July 2014 post was “When you look at the chart, what do you see?” Some of the details might not be current but the idea sure is.  So what is the chart’s story?


It’s interesting to read the financial press. They always give a reason for the market’s action.  I can almost picture them sitting around and trying to figure out what they are going to say for any given day.  So the Dow was up 28.7 pts yesterday, what did they say?

Reuters: “Stocks managed to score modest gains on Friday, but the S&P 500 posted its biggest weekly drop since April as investors showed only mild enthusiasm after getting their first glimpses of earnings.”

Bloomberg: “U.S. Stocks advance as Internet rally offsets Portugal”

MarketWatch: “The U.S. stock market closed higher on Friday after the main benchmarks picked up steam in late afternoon, trimming weekly losses.” Continue reading

Emerging Markets…Are the Best Days Behind Them?

In this post I look at the iShares MSCI Emerging Markets ETF (EEM).  This is a highly liquid ETF that trades at a 50-day average of 75 million shares a day. Of the top ten holdings, six are from China, 2 from Taiwan, 1 from South Korea and 1 from South Africa.

So there is a fairly strong exposure to China. In fact of all EEM’s holdings, China has the largest percentage of any country at 27.07%. You get exposure to companies like Tencent Holdings Ltd., Alibaba Group Holding ADR, China Mobile Ltd., China Construction Bank Corp, Baidu ADR and Industrial & Commercial Bank of China.

In the charts below I first look at the weekly chart of EEM then at the daily chart. Continue reading

crude oil

Has the Energy Sector Hit the Wall?

Today we look at the Energy Select Sector SPDR ETF (XLE) and ask whether the energy sector has hit the wall.

The XLE is one of the most active industry sector ETFs with a 50 day moving average of 95 million shares.  It tracks a market-cap weighted index of US energy companies in the S&P 500.  
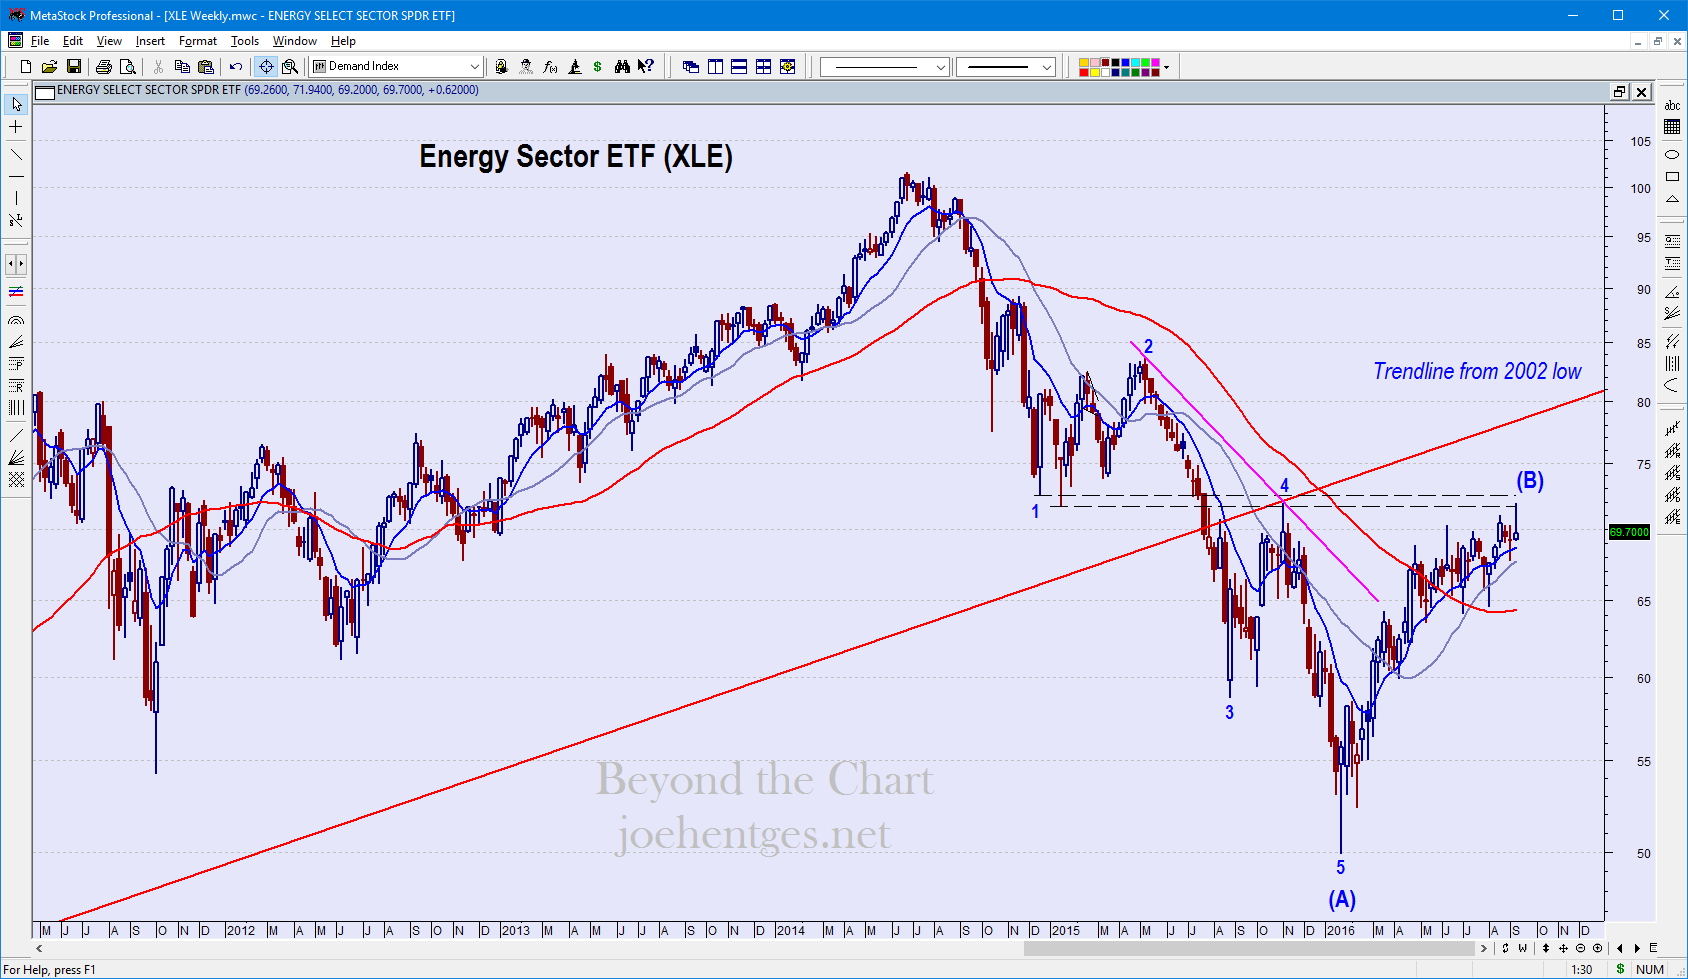
Energy Sector

In the big decline from the peak in June 2014 to the low in January 2016, XLE smashed thru a major uptrend line from the 2002 low, in July 2015. It pulled back to it last November but then quickly fell away.

It has had a big move up off the January low, but running into significant resistance at 72.0. It has not broken down yet.  Watch for consecutive closes below the 10 week ema and then for the 10 ema to cross below the 21 sma.  Look at September 2014 and June 2015 for good examples.

Energy Sector

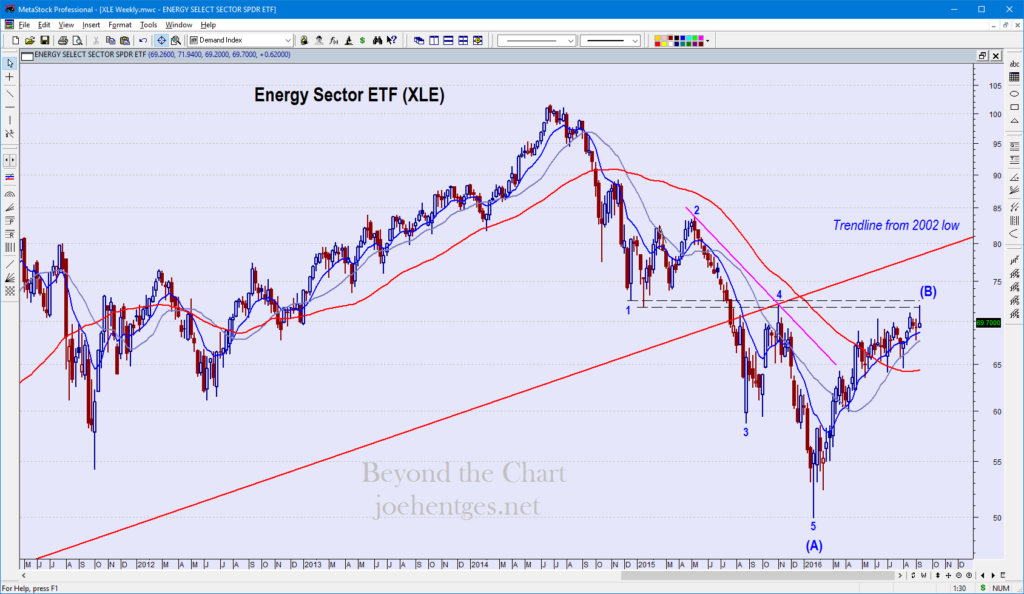
Weekly April 2011 – Sept 2016

The top three holdings in the Energy Sector ETF are Exxon Mobil (XOM) at 18.65%, Chevron (CVX) at 14.81% and Schlumberger (SLB) at 8.83%. I’ll start with Exxon Mobil. Continue reading

1 3 4 5 6 7 28

Powered by WishList Member - Membership Software