Tag Archives for " S&P 500 Index "

stock market rhyme

Just Like History the Stock Market Rhymes

Mark Twain is often associated with the quote, “History doesn’t repeat itself, but it often rhymes.” I think the same could be said for the stock market.

From 1986 into 1987 Paul Tudor Jones and his research director Peter Borish were following an analog model of the late 1920’s. When it came to the fall of 1987, it made them a lot of money. One could say it was a stock market rhyme with 1929.

After the 1987 crash, did we go into a 2nd Great Depression? No. In mid-1988 the stock market starting diverging from the path taken in 1930 and things changed.

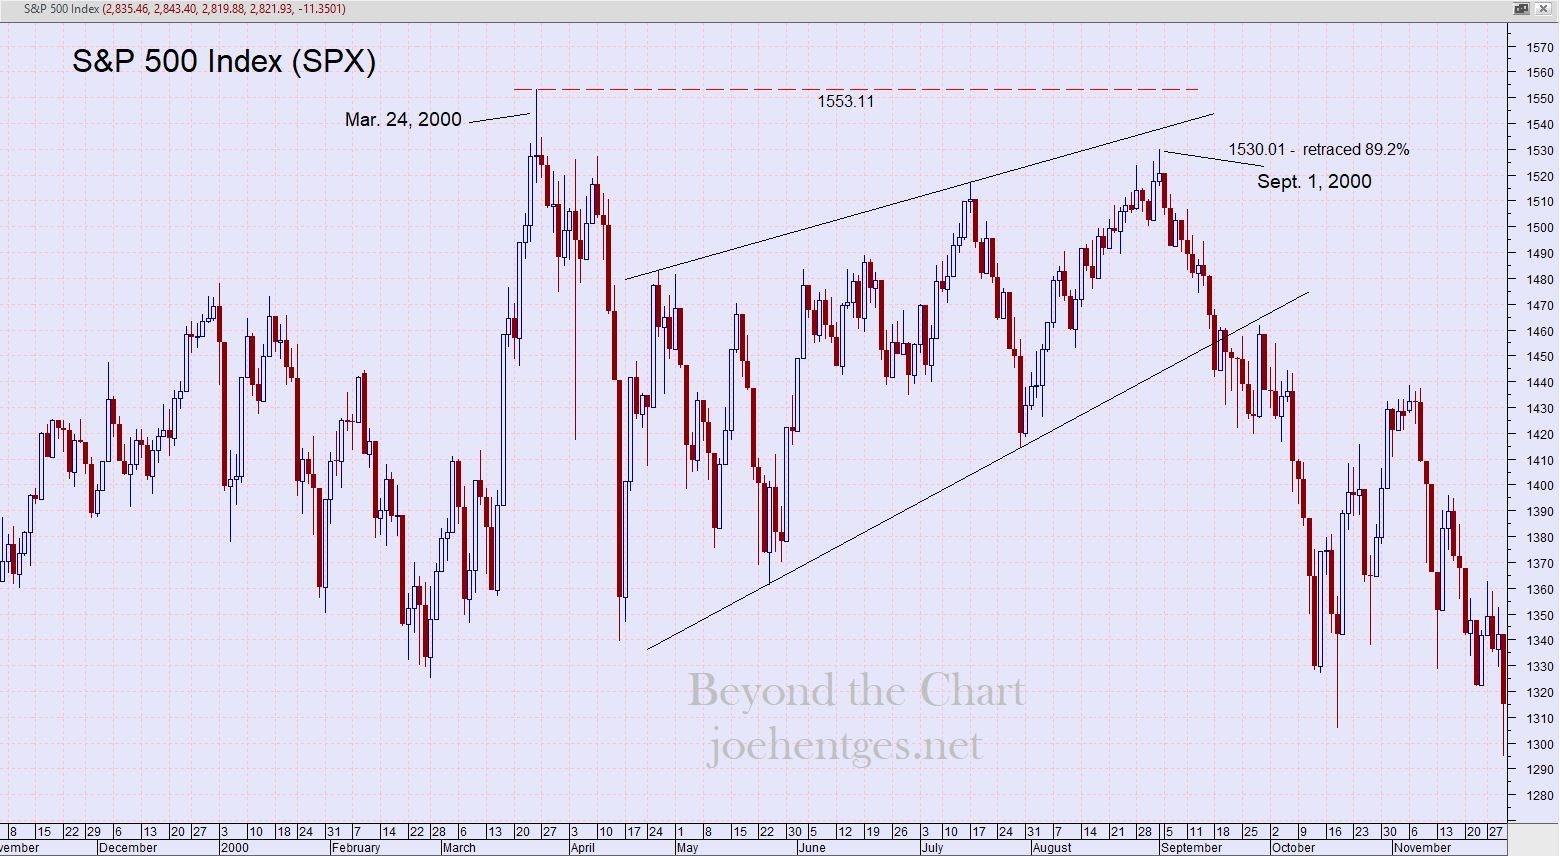
Right now the S&P 500 Index (SPX) is looking very much like a stock market rhyme to the way it acted at the top in 2000. In the first chart below you see how it looked starting from the peak on March 24, 2000, followed by a swift violent selloff over the next 15 trading days. Trading over the next 5+ months created an upward trending wedge type pattern that peaked on September 1, 2000.

The SPX retraced 89.2% of the March – April sell-off, when considering the intra-day highs. On September 1, I’m sure many investors believed that new highs were on the way.  But the SPX sold off, breaking down out of that pattern and eventually hitting bottom in October 2002.

The SPX lost 51% of its value from the high on March 24, 2000 to the low on October 10, 2002.  The March 2000 peak in the market was a Primary Wave 3 high of Cycle Wave V.

stock market rhyme

In the 2nd chart below we look at the SPX for 2018. It peaked on January 26th and then sold off violently over 10 trading days. It then oscillated up and down over the next 6 months with a counter-trend Intermediate Wave (2) high of 2863.43 on August 7.

stock market rhyme

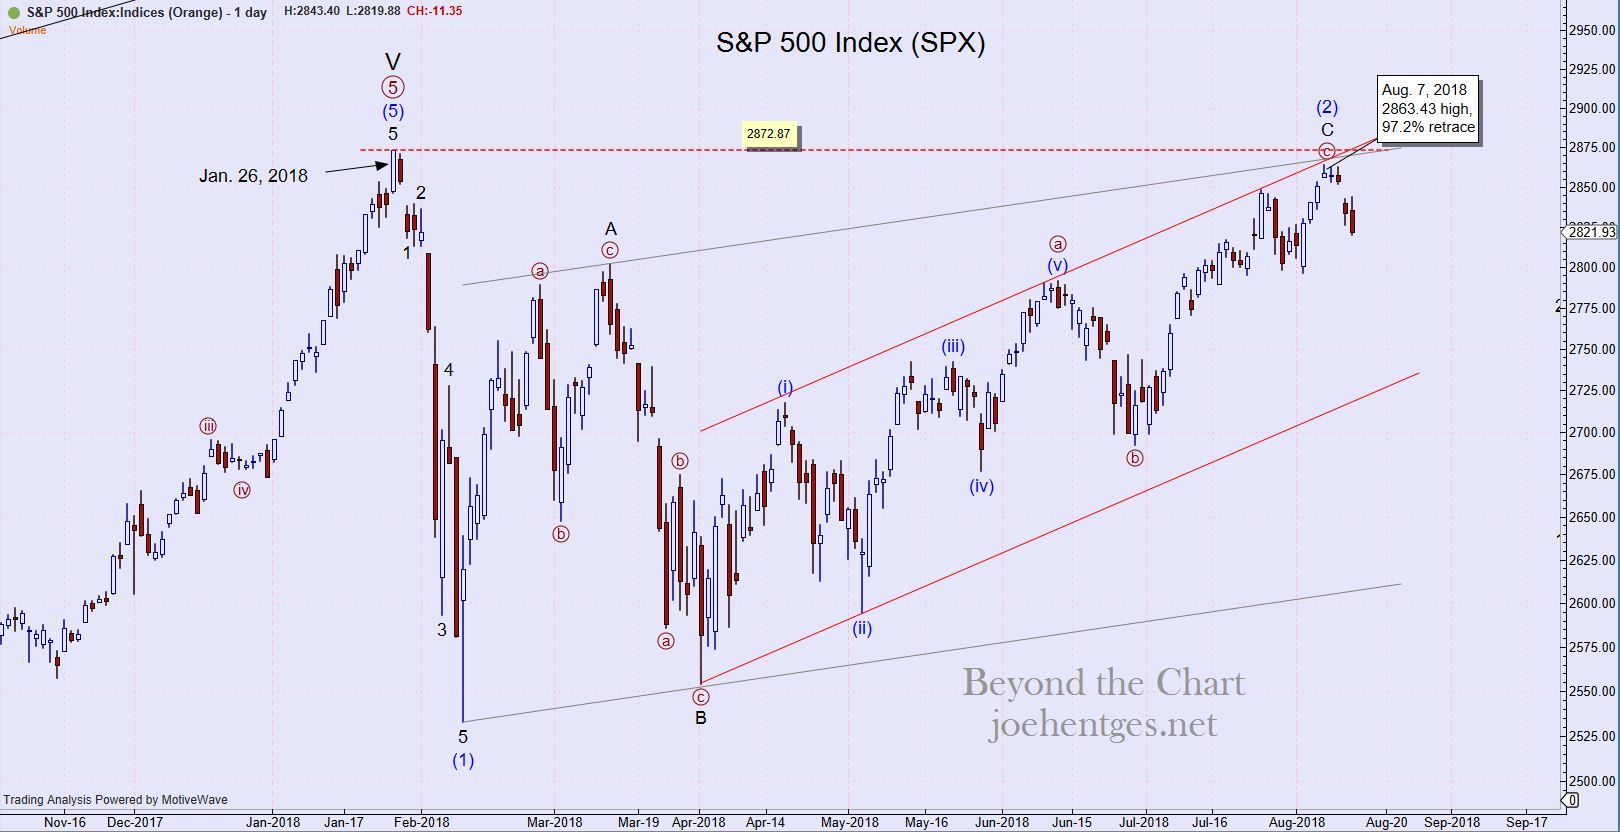
We will now see if this high will hold.  Either the market starts down in Intermediate Wave (3) or it pushes above the January all-time high.

August Selloff…Normal August Type Activity?

As I was working on a weekday market wrap video for my members the other day, I happen to have Jim Cramer’s Mad Money show on the TV…turned down low. I usually don’t watch the show, but this time I did over hear him talking about the August selloff.

He was basically telling people to relax, it’s August. The market is doing its August type of price action.  So it got me wondering… is having an August selloff, just normal August type action. Continue reading

will China crow

Will China Crow This Year or Get Plucked?

Happy Chinese New Year! Today is the first day of the Chinese New Year and it’s the year of the Rooster. This celebration actually started on Friday, New Year’s Eve and goes on for a couple of weeks. It is also called the Spring Festival.  I talk about this more in a previous post.

The stock markets in China were closed on Friday and won’t open again until next Friday. The Hong Kong Stock Exchange is closed on Monday and Tuesday.

China Tensions

Continue reading

Santa Claus Rally

No Santa Claus Rally Again This Year

The Santa Claus Rally in the stock market has typically been defined as a rally that occurs between Christmas and New Year’s Day.  Well that didn’t happen this year or last year or the year before.  

In December 2014 the S&P 500 (SPX) was down 1.1% then chopped up and down in January ending the month down 3.1%.

In December 2015 the SPX was down .84% then got whacked pretty good in January ending down 5.1%.  (at one point it was down 11.3%) Continue reading

semiconductor stocks

Is that it for Qualcomm and the Semiconductors?

On Thursday Qualcomm (QCOM) announced a huge $47 billion deal to acquire NXP Semiconductors. Is that the top for Qualcomm and the semiconductor sector?

In this brief market analysis video I look at this week’s market action by reviewing the S&P 500 daily and weekly charts, one of my key indicators, and then 3 key ETFs.  This is just a brief snippet of what my Insider Members receive. Continue reading

1 2 3 16

Powered by WishList Member - Membership Software