
In this post I look at the iShares MSCI Emerging Markets ETF (EEM). This is a highly liquid ETF that trades at a 50-day average of 75 million shares a day. Of the top ten holdings, six are from China, 2 from Taiwan, 1 from South Korea and 1 from South Africa.
So there is a fairly strong exposure to China. In fact of all EEM’s holdings, China has the largest percentage of any country at 27.07%. You get exposure to companies like Tencent Holdings Ltd., Alibaba Group Holding ADR, China Mobile Ltd., China Construction Bank Corp, Baidu ADR and Industrial & Commercial Bank of China.
In the charts below I first look at the weekly chart of EEM then at the daily chart.
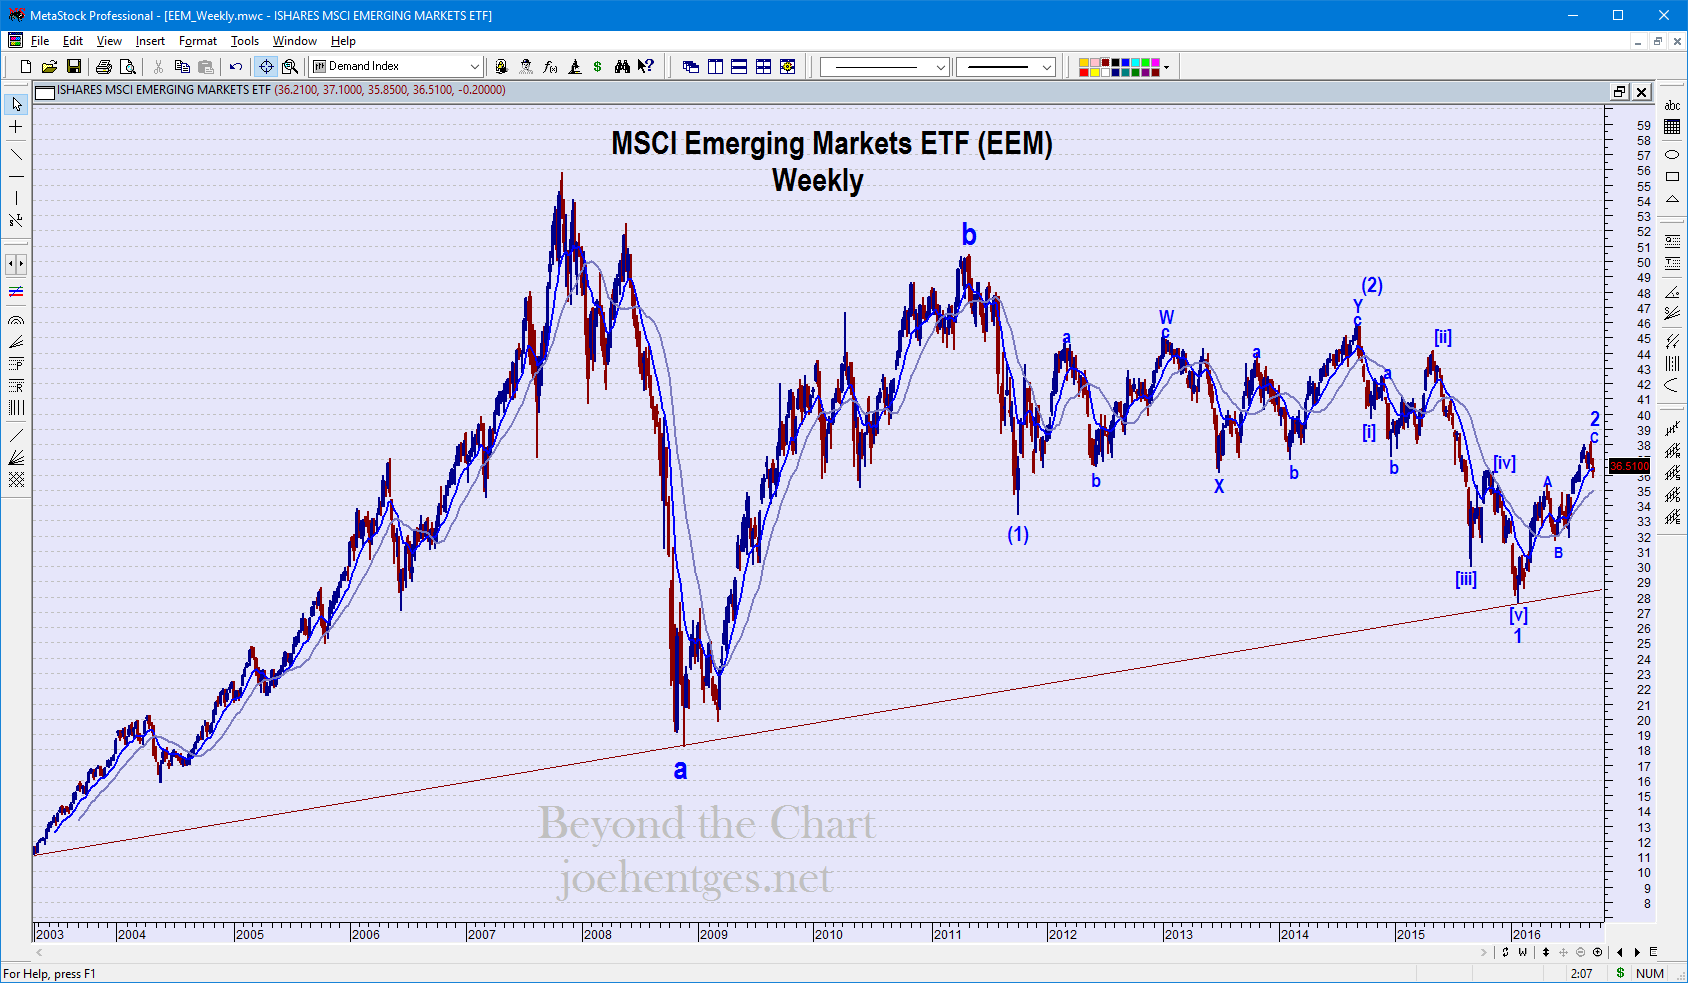
Weekly Chart April 2003 – September 2016
Emerging Markets Weekly View
The peak for EEM occurred during the week ending November 2, 2007. This was about 2 weeks after the Dow Industrials and the SPX peaked in the United States. It then went on to bottom prior to most major indices, in November 2008. I believe this was the first major wave down, labeled “a” on the chart. That was followed by a large counter move, labeled “b”.
Since that time it has continued to make its way back down. First there was a strong impulse move ending in (1) in October 2011. This was followed by very choppy sideways corrective action ending in (2) during the week ending September 5, 2014. From September 2014 thru January 2016 was another impulse move down that I label, Minor Wave 1.
This Wave 1 ended right at a trendline that began with the low in April 2003, when trading first started and encompasses the 2008 low. This Wave 1 was then followed by a zigzag Wave 2 pullback that is very close to ending, if not hasn’t already. Once Wave 2 is complete, we will get Wave 3 of (3) which should be very strong down and break the long-term trendline.
Emerging Markets Daily View
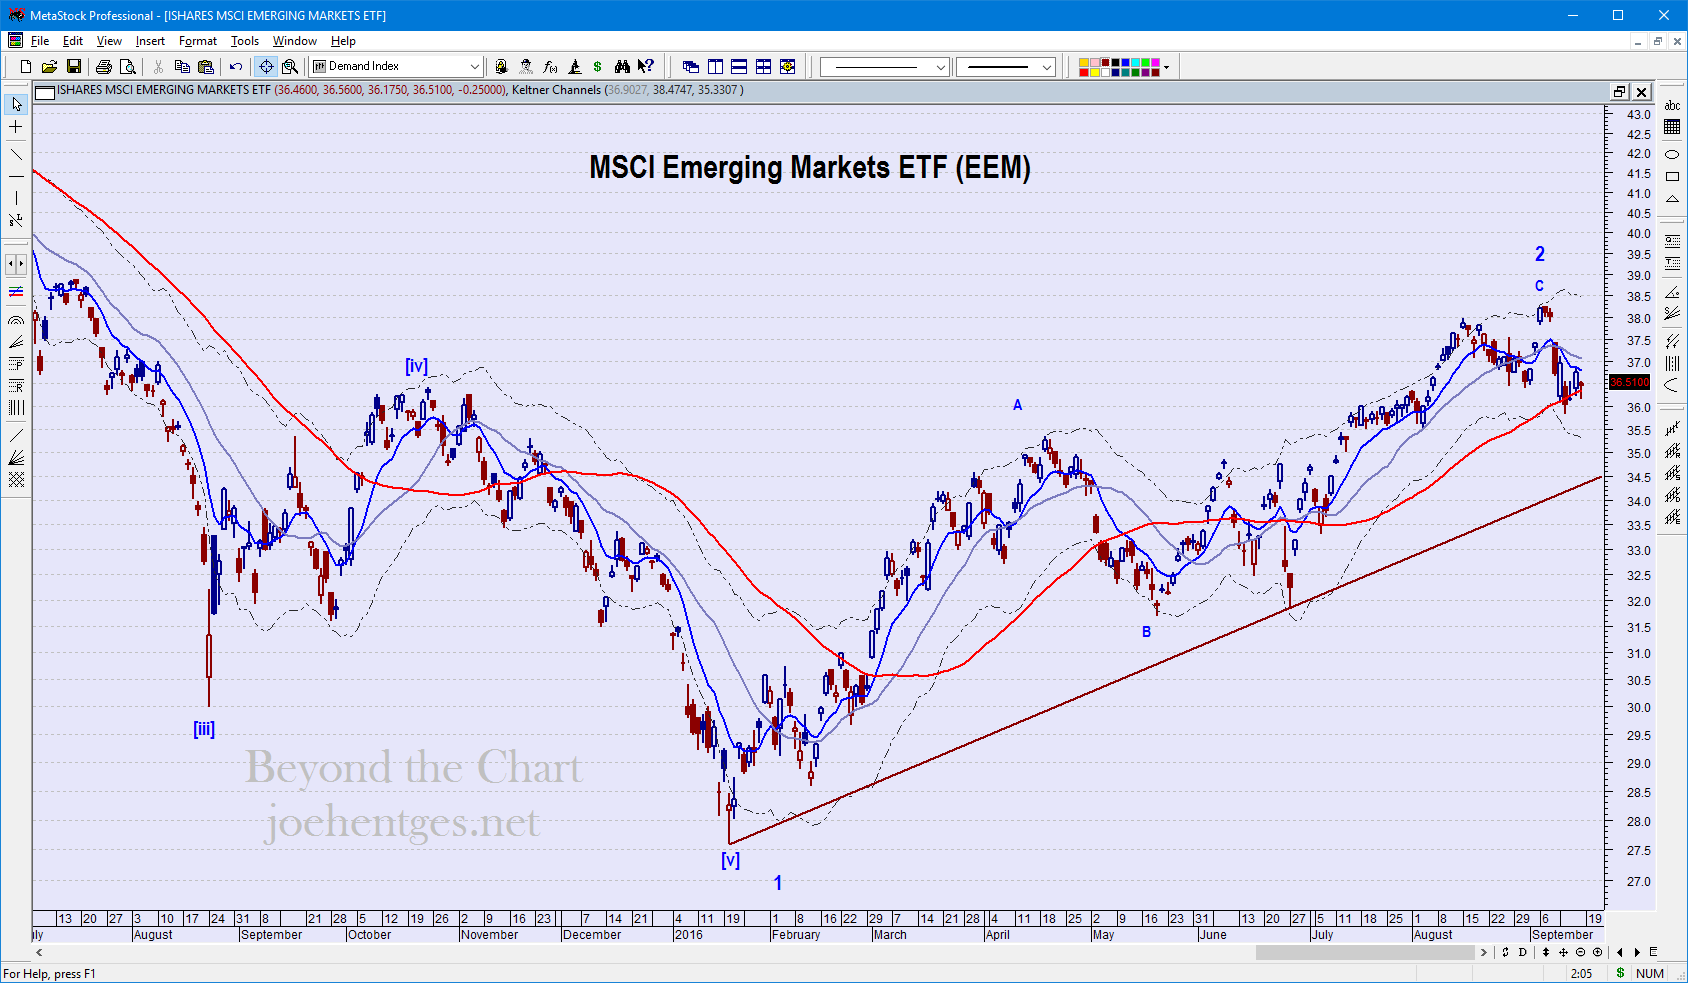
Daily Chart: July 2015 – September 2016
In the daily chart our focus is on the move since the low in January 2016. This is a zigzag counter-trend move that may have completed with the high on September 6. This will confirm with a break of the trendline up from January. The move down should be strong and accelerate.
Today’s Brief Market Video