Category Archives for "Market Analysis"

Fasten Your Seatbelts

There's a confluence of cycles occurring in the economy/stock market.  The Fourth Turning,  Elliott Wave SuperCycle,  18.6-year economic cycle and several others.  I've discussed the Fourth Turning before. Neil Howe, the co-author of "The Fourth Turning, An American Prophecy", pub. 1997 and "The Fourth Turning is Here" pub. 2023, believes we are in the midst of the Fourth Turning which began in 2008 and will end  in the early 2030's possibly 2033. 

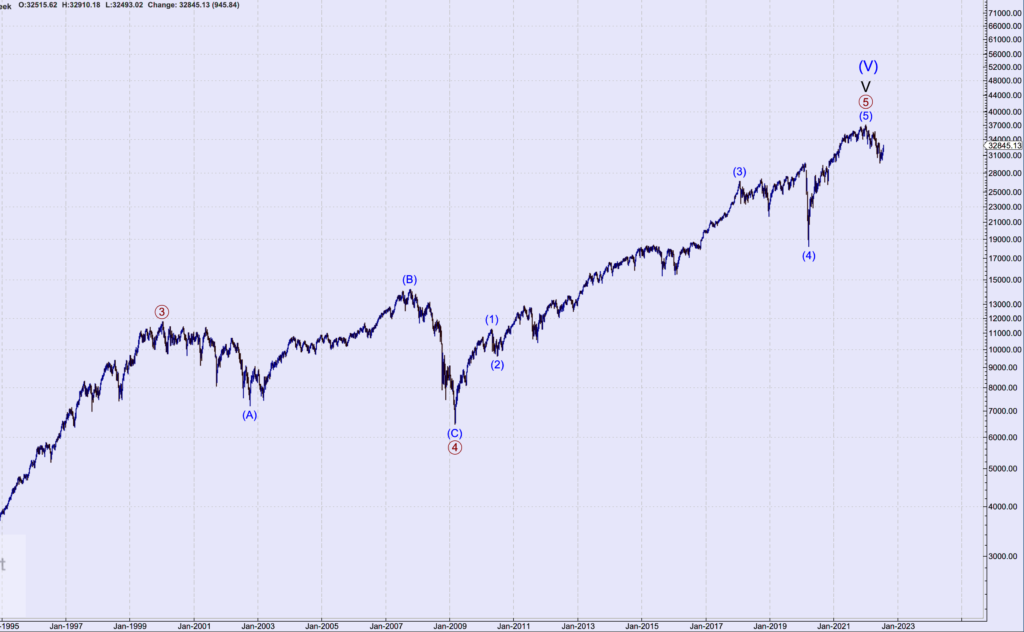
Of course I've also discussed the long-term Elliott Wave cycles.  Cycle Wave V of SuperCycle (III) either ended in January 2022 or is in the final stages.  The price action will soon confirm the timing. I've recently been introduced to the 18.6-year economic cycle related to real estate and the economy that is impacting the Elliott Waves.  It has very significant implications for the stock market and the economy and ties in nicely with everything occurring now. 

As a member of the Foundation for the Study of Cycles I became aware of Akhil Patel and also Phil Anderson who has extensively studied the 18.6-year economic cycle. Here is what I've learned: 

Each cycle has four phases.

Phase I is Recovery.  The prior cycle has ended and the economy recovers. Over the next 6-7 years the economy grows and confidence returns.

Phase II is a Mid-Cycle.  In this phase a minor recession takes place.  This generates some fear but it turns into a relatively short slowdown with no real financial crisis.

Phase III is the Boom.  This leads to a much stronger boom over the next six to seven years which generates higher growth, surging stock and property markets.  This phase concludes with about 2 years of extreme bullishness and FOMO, before the cycle finally reaches its summit, 14 years after it began.

Final phase is Crisis.  As Akhil Patel says: "The cycle ends with a terrific crash and depression.  The economy must be rescued from its deep malaise;  the ruins are cleared over a period of four years.  The 18-year cycle ends, and a new one begins."   

This 18.6-year cycle in the economy has been going on for over 200 years now.  Sometimes it gets interrupted by major events like World War II. Its length has been has short as 17 years and as long as 21years.  The following is a diagram that visually explains the cycle.
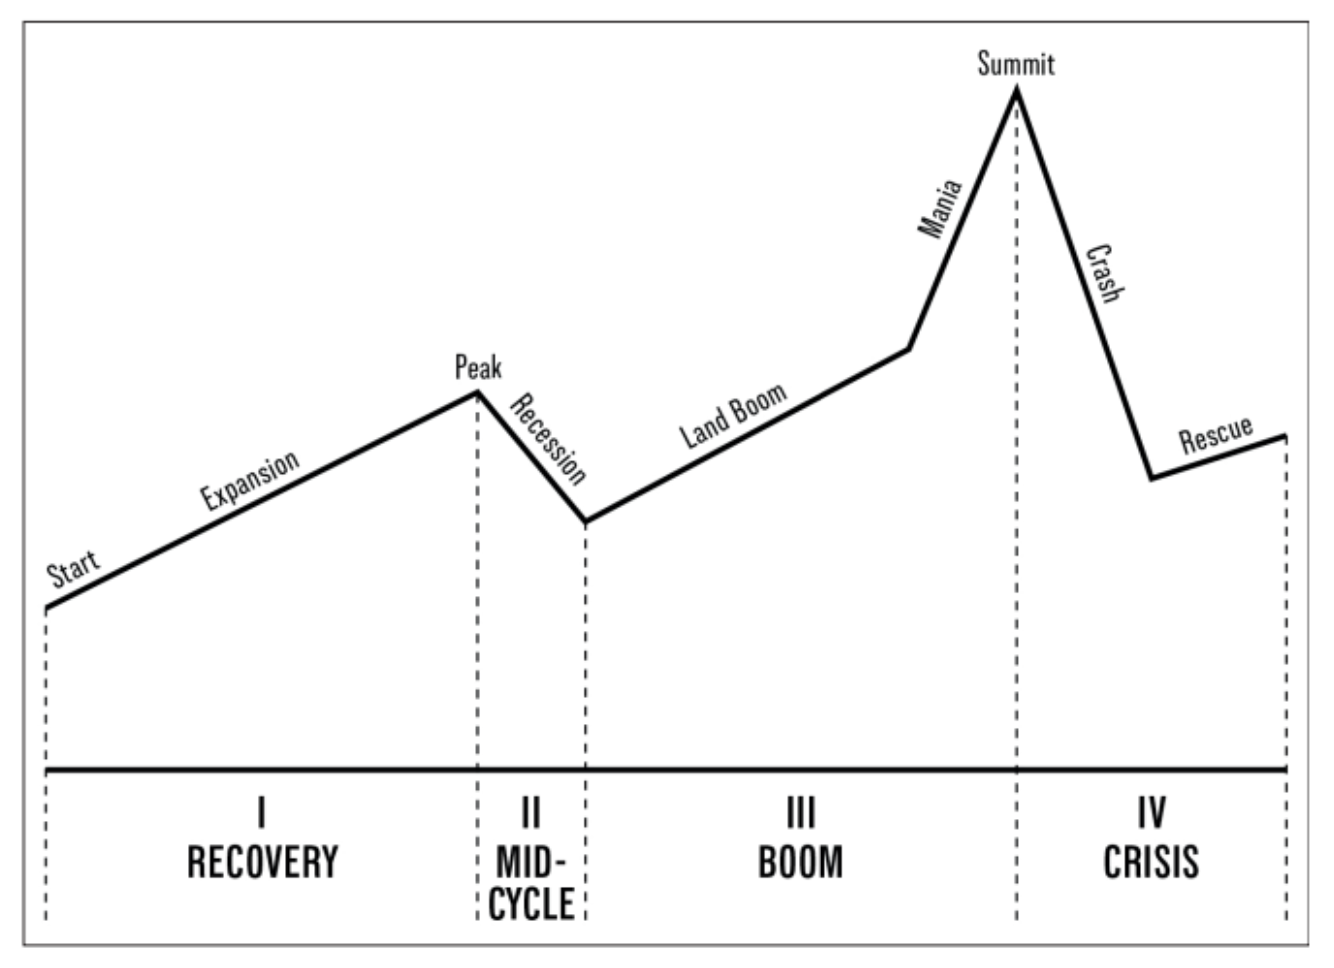
Created by Akhil Patel

So the current 18.6-year cycle began in late 2011/early 2012 as the economy started recovering.  The unemployment rate in the United States hit a peak of 10.0% in October 2009 and then started to decline.  By October 2011 it reached 8.8% and continued slowly dropping.  The stock market bottomed in March 2009, ahead of the economy as is usual. The end of the recovery phase occurred in about 2019.

Then the Mid-Cycle period began and included the brief recession at the beginning of the Covid pandemic.  So in late 2020 the next phase began. The Boom.

The Boom period began in late 2020/early 2021 and is projected to run into 2025-2026 timeframe, ending about 14 years after it began.  At that point everything peaks and the crisis period begins. As mentioned above the crisis period is expected to run about four years.

So an 18.6-year cycle that began in 2012 implies that the end of the Elliott Wave SuperCycle is delayed. And therefore the end of Cycle Wave V has also not occurred and will push higher for 2-3 more years. This drives my alternate count on the indexes.  Monitor the price action closely...and fasten your seatbelts.

CAPE…what is it saying now?

Professor Robert Shiller's CAPE (Cyclically Adjusted Price-to-Earnings) ratio, also known as the Shiller PE ratio, is a widely followed valuation metric for assessing the long-term valuation of the stock market. It differs from the traditional P/E ratio by using a longer-term average of earnings to smooth out the impact of economic cycles and provide a more stable measure of valuation.

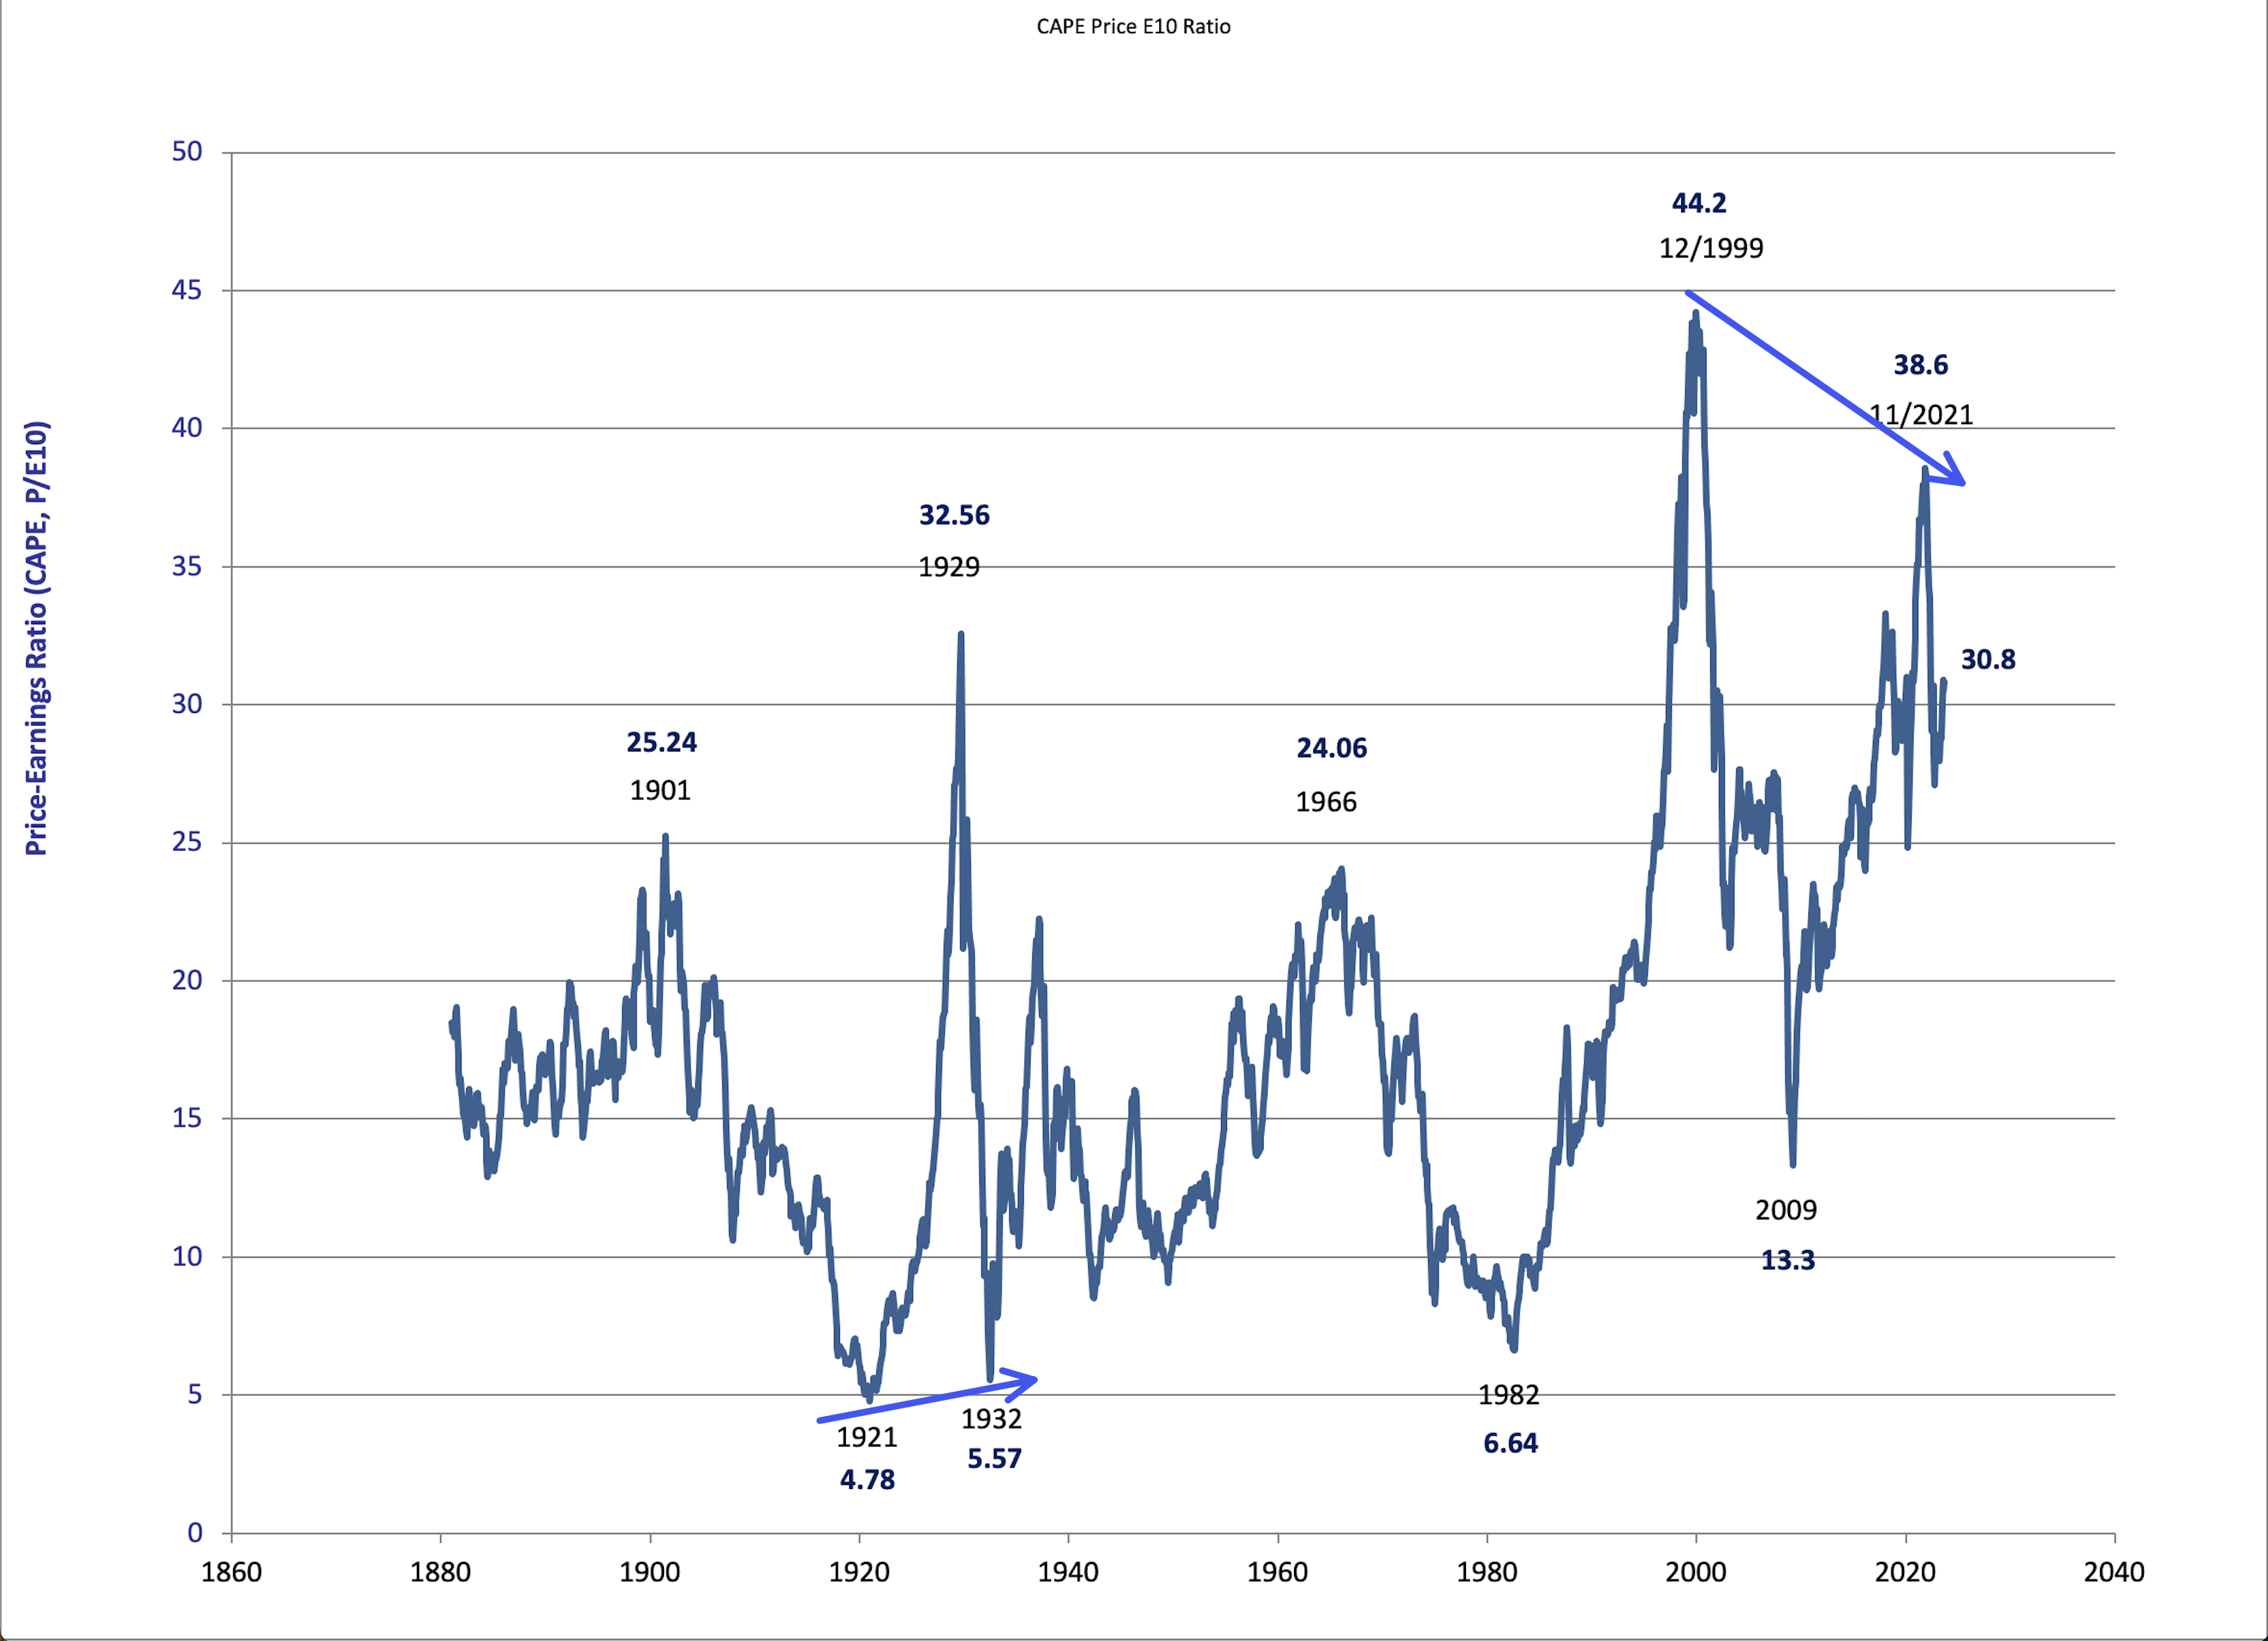
The CAPE ratio provides a great historical context for stock market valuations, allowing investors to see how current valuations compare to historical averages. Let's take a look at the following chart of the CAPE ratio using stock market data since 1871.

The current CAPE ratio sits at 30.8 for September 2023. This is a preliniary reading as all data inputs are not finalized yet.  The CAPE ratio has declined from a very high reading of 38.6 in November 2021.  This reading coincided with the top in the Nasdaq and just prior to the peak in the Dow Jones Industrial Average and S&P 500 Index in January 2022.  You will notice that this peak in valuation was higher than 1929 and second only to the extreme achieved in the Dotcom bubble of 1999-2000.  2021 had its share of craziness and extreme market activity creating a bubble for the ages.

One of the key insights from the CAPE ratio is the concept of mean reversion. Historically, when the CAPE ratio has been high (indicating overvaluation), subsequent returns have tended to be lower, and when it has been low (indicating undervaluation), subsequent returns have tended to be higher.

Coming down from the 2021 peak, I believe we are in the process of stair stepping our way down. We could very easily do something like what occurred between 1966 and 1982 when the stock market basically went sideways for 16 years with wild swings. Or we could take the elevator down like after 1929 and 1999.  How low? No one knows.  But everything moves in cycles.  Just look at what has happened in  the bond market recently.

There is something else that I hadn't noticed before.  Look at the CAPE ratio readings in 1921 and 1932.  The stock market went lower in 1932 but the CAPE ratio provided a bullish divergence indicating a long-term bottom.  And a similar thing occurred with the CAPE readings of 12/1999 and 11/2021.  Stock market in 2021 was much higher than 1999/2000 but the CAPE ratios provide a long-term bearish divergence indicating a possible long-term peak.  

Now the CAPE ratio is not a precise timing tool for short-term market movements. High or low CAPE ratios do not necessarily predict immediate market crashes or rallies. Markets can remain overvalued or undervalued for extended periods, and other factors, such as interest rates and economic conditions, also play a significant role.  

But CAPE ratios do indeed provide perspective on where the market sits compared to previous times in history of overvaluation and undervaluation.  The CAPE ratio is saying this stock market is still extremely overvalued.

Interest Rates…It’s Different this Time

Does the timing of interest rate hikes and cuts impact the the stock market? Do cuts in interest rates then lead to a stock market peak and subsequent decline? Or are cuts just a confirmation of the direction the stock market is already in? Lets take a look at the last 25 years.

1998 - 2003

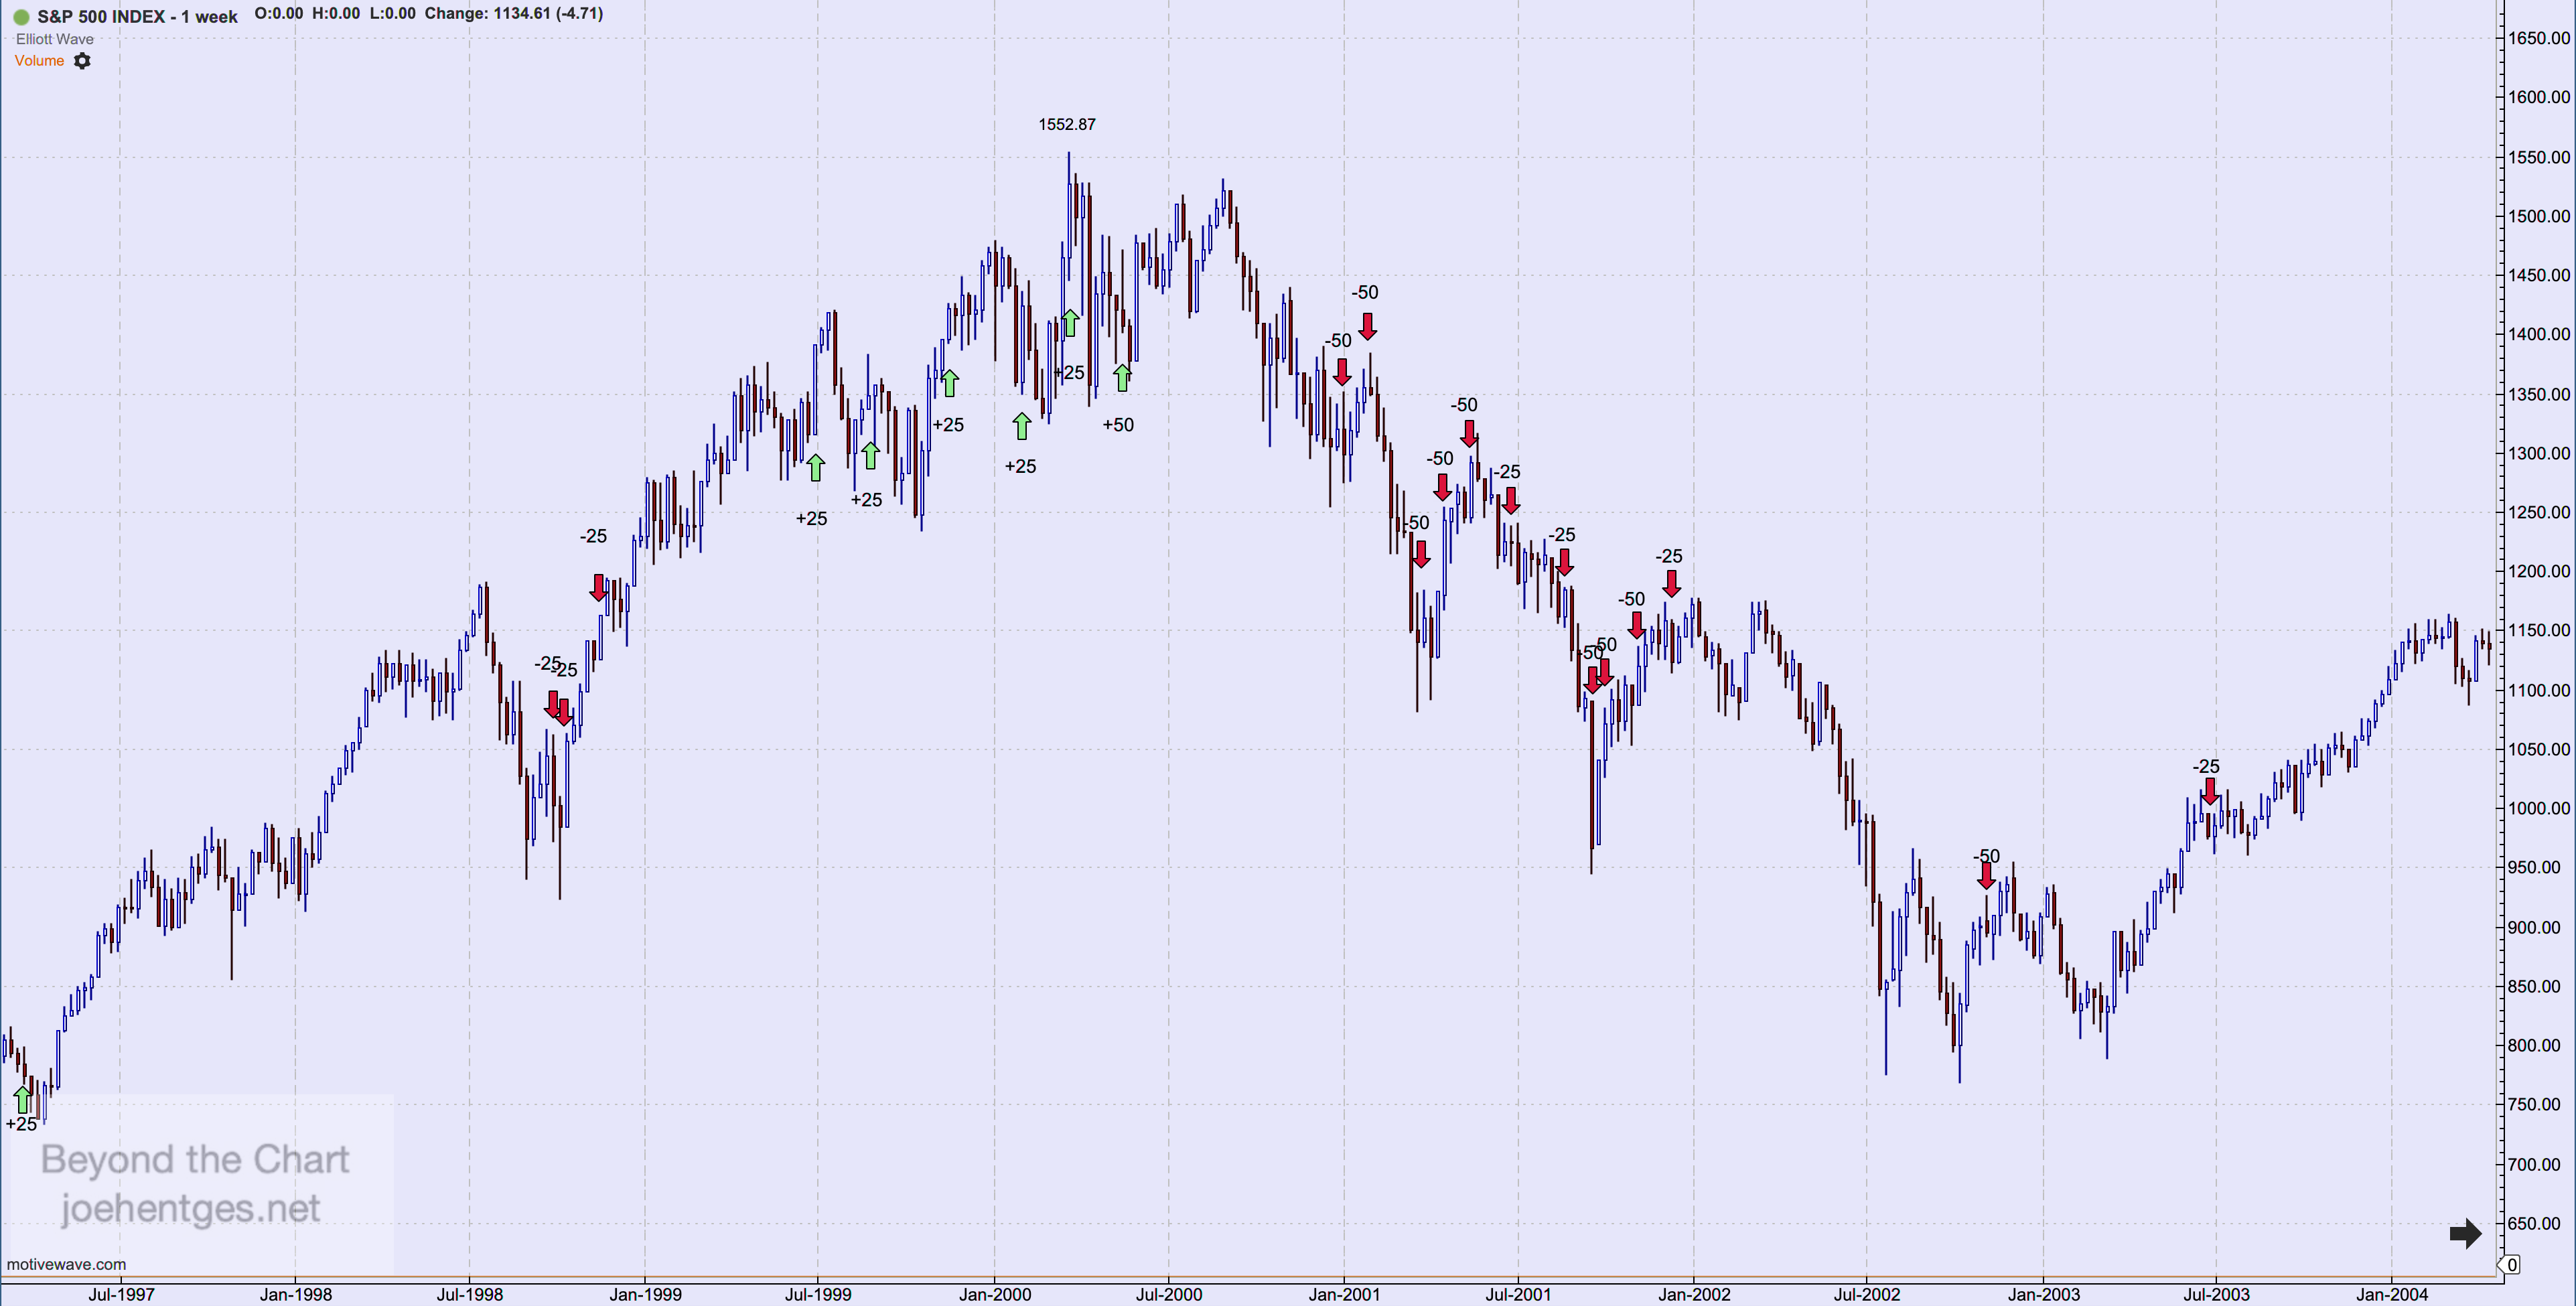
In 1998. the Fed cut interest rates in reaction to the Russian currency crisis. They cut three times. The lowest weekly close on the SPX occurred the week of August 30, 1998 before the first cut on September 29, 1998. The third and last cut was on November 17, 1998. 

The Fed resumed raising rates in mid-1999 starting with +25 bps on June 30, 1999. The SPX peaked the week of March 19, 2000. The Fed's 5th rate hike of +25 bps occurred on March 21, 2000 to be followed by yet another rate hike on May 16, 2000 of +50 bps. 

The Fed did not cut rates until January 3, 2001 where they cut -50 bps. The SPX had been in decline for 9 months. It is also interesting to note that the SPX bottomed the week of October 6, 2002 before the last 2 rates cuts in November 2002 and June 2003 for a total of 13 rate cuts.


2004 - 2009

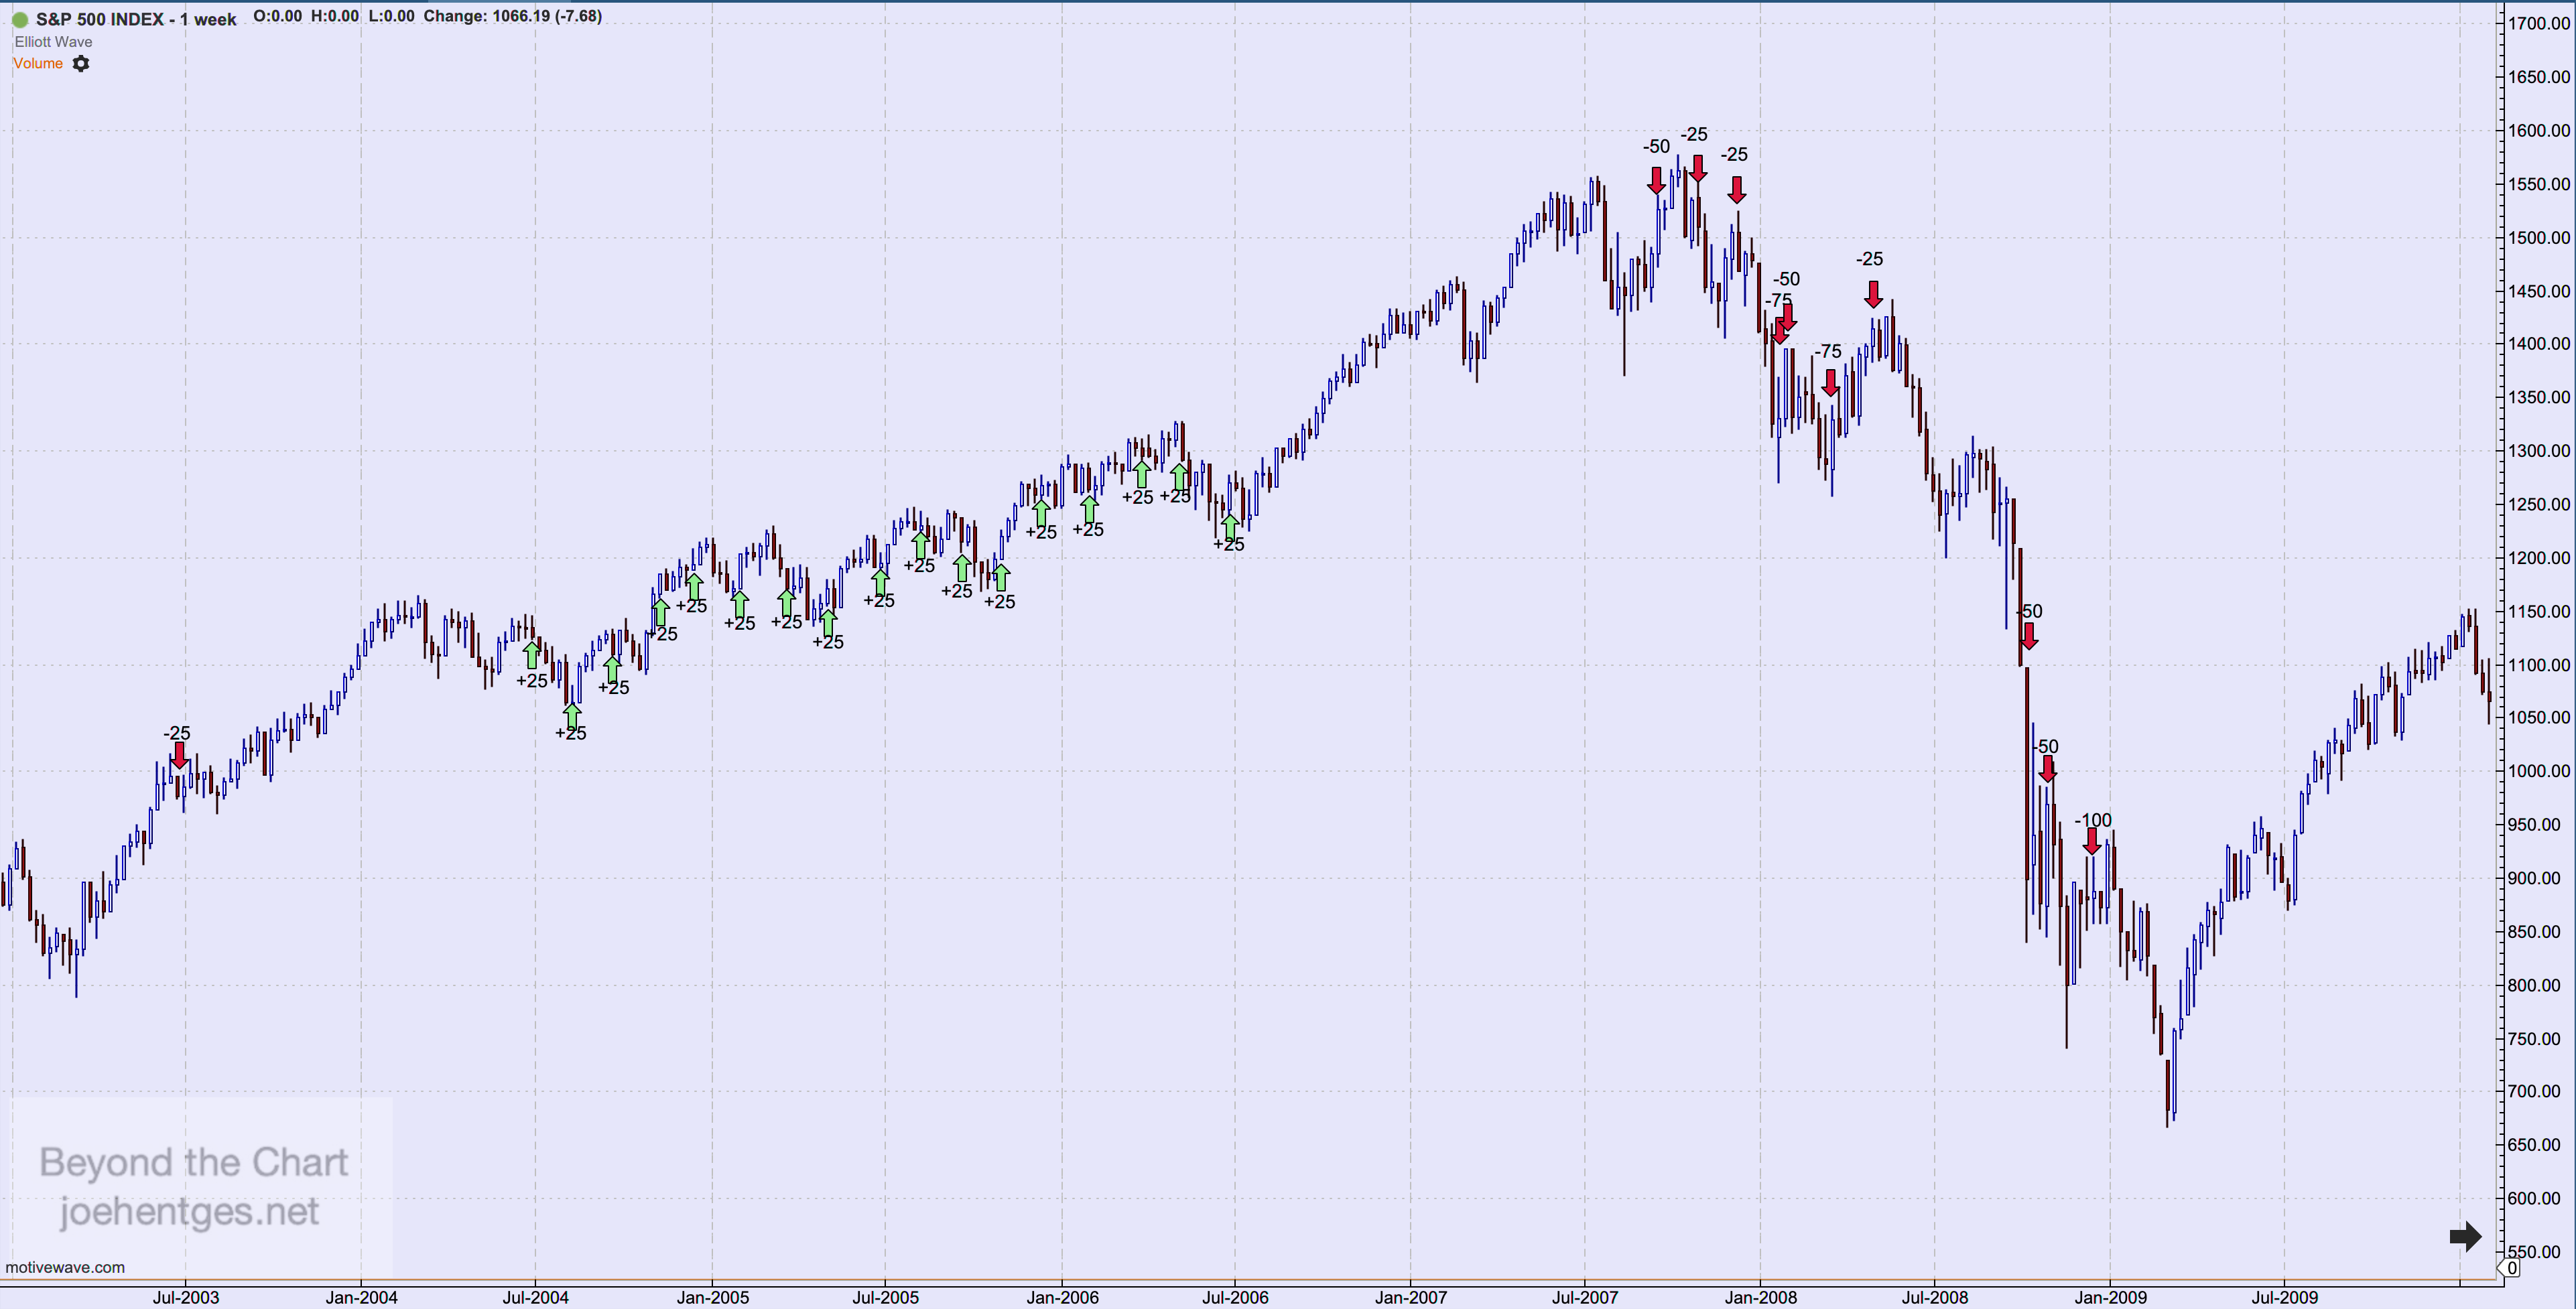
The Fed raised interest rates +25 bps 17 times from June 30, 2004 to June 29, 2006. The market kept pusing higher into 2007. The Fed decided to cut rates by -50 bps on September 18, 2007. The SPX peaked the week of October 7, 2007, about 3 weeks later. So as opposed to the peak in 2000, this time the market peaked after the first rate cut

The intensity of the crisis was evidenced by the 10 rate cuts bringing interest rates to zero with the final cut of one full percentage point occurring on Dec. 16, 2008.  The market bottomed the week of March 1, 2009, 11 weeks after the last cut.


2015 - 2020

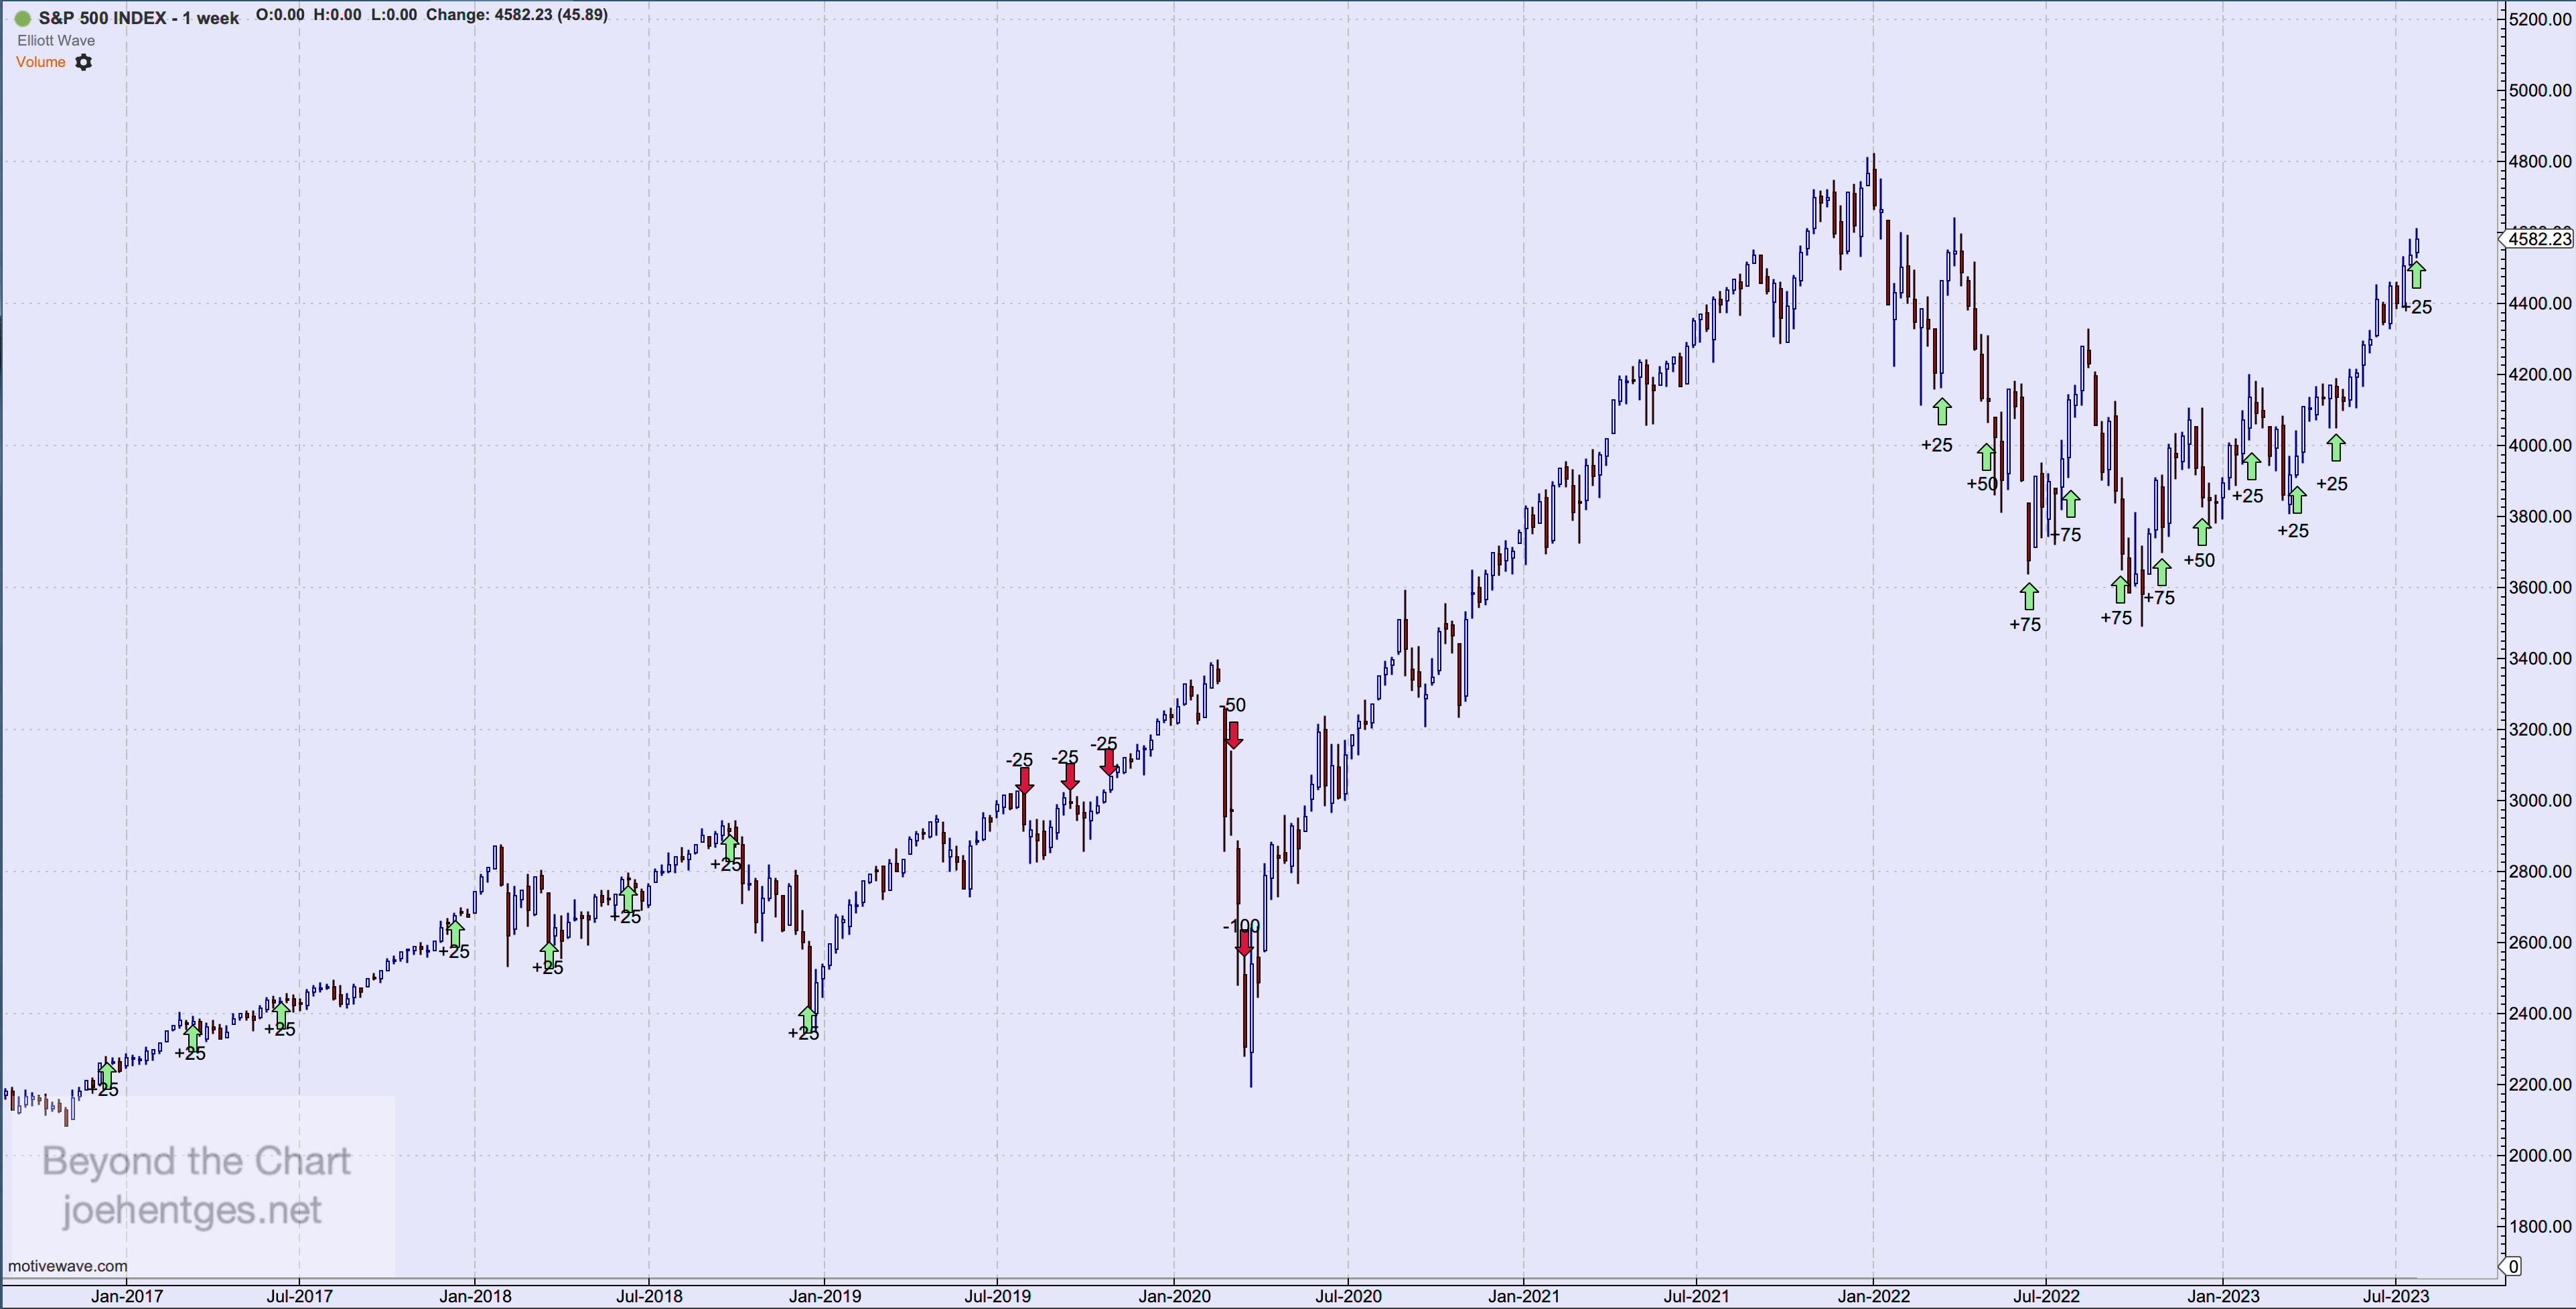
The Fed kept interest rates at zero for the next 7 years in what became know as the Zero Interest Rate Policy (ZIRP). Beginning on Dec. 17, 2015 they rasied rates by +25bps for the first of 9 straight raises over 3 years. 

The first cut of -25bps occurred on Aug. 1, 2019 followed by 2 more cuts of the same size until the COVID panic of 2020 hit. They then cut by -150 bps over a 2 week period in March 2020. Interest rates were now back to zero. 2020 was a minor peak in the SPX, not the end of the primary wave up from March 2009. The peak in the SPX occurred the week of January 2, 2022.


The Fed did not start raising rates until 10 weeks after the peak and have now raised them 11 times. This time does seem to be different though. In prior cycles the Fed was raising while the market was increasing. So will the 2022 peak in the market hold as we expect? When the market turns down it will be because something different is indeed happening and the Fed will follow suit with rate cuts that they justify because the data changed.  

Denial turns to Fear…Put/Call Extremes

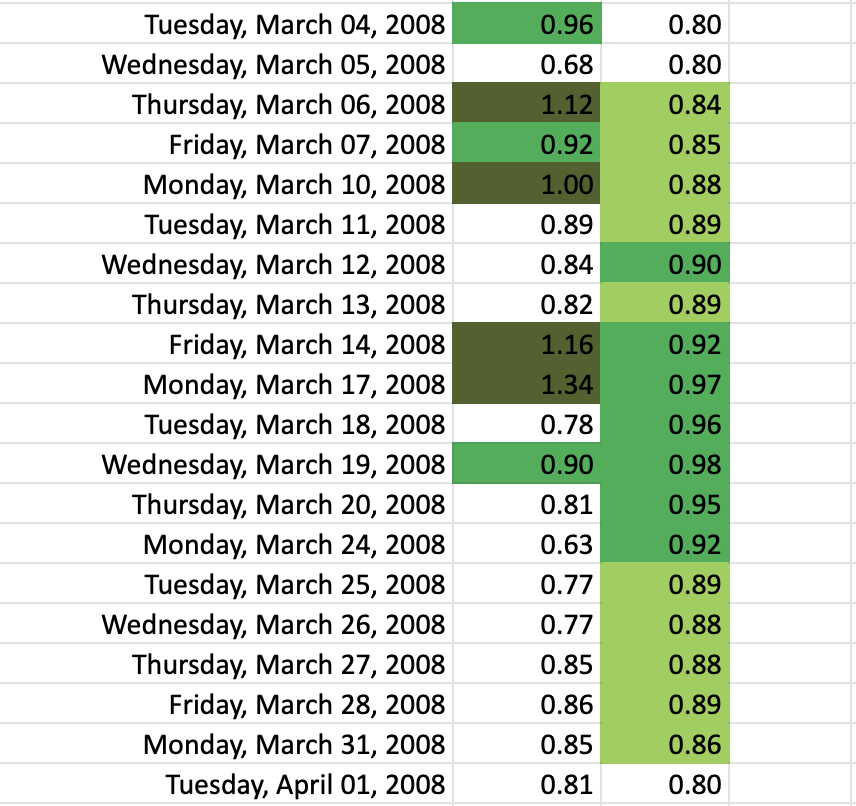
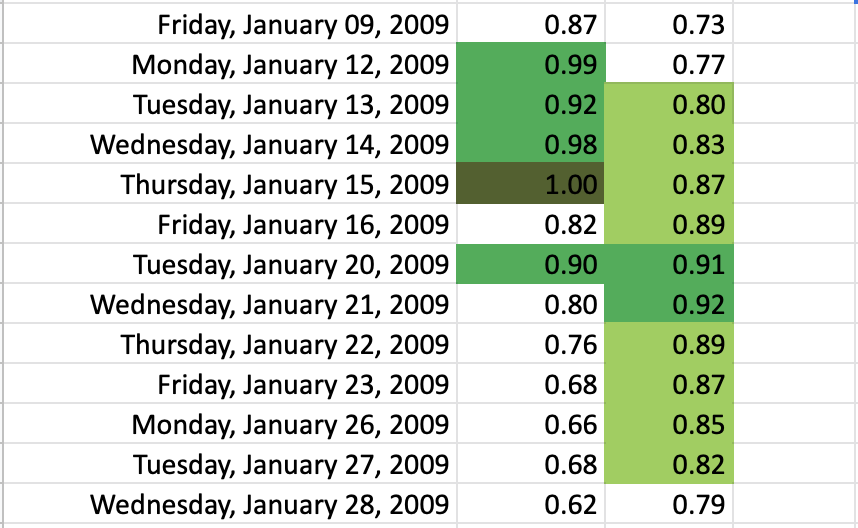
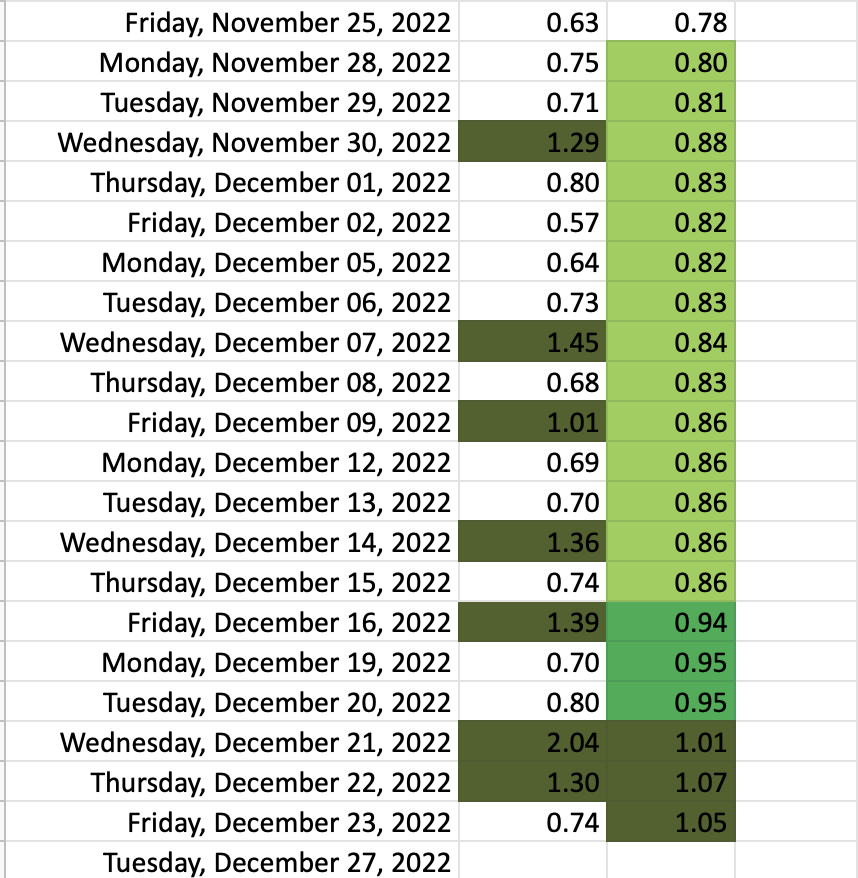
December 21, 2022 showed an Equity Put/Call ratio of 2.04. That means 204 puts traded for every 100 calls. My data extends to November 2006. This is the highest one day reading in 16 years. In addition there have been three other readings during December, higher than anything seen since the previous high of 1.34 on March 17, 2008.  

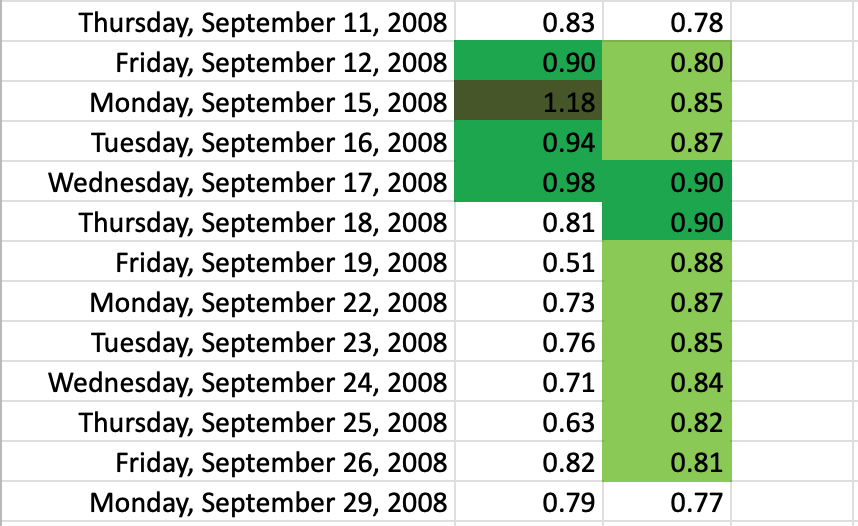
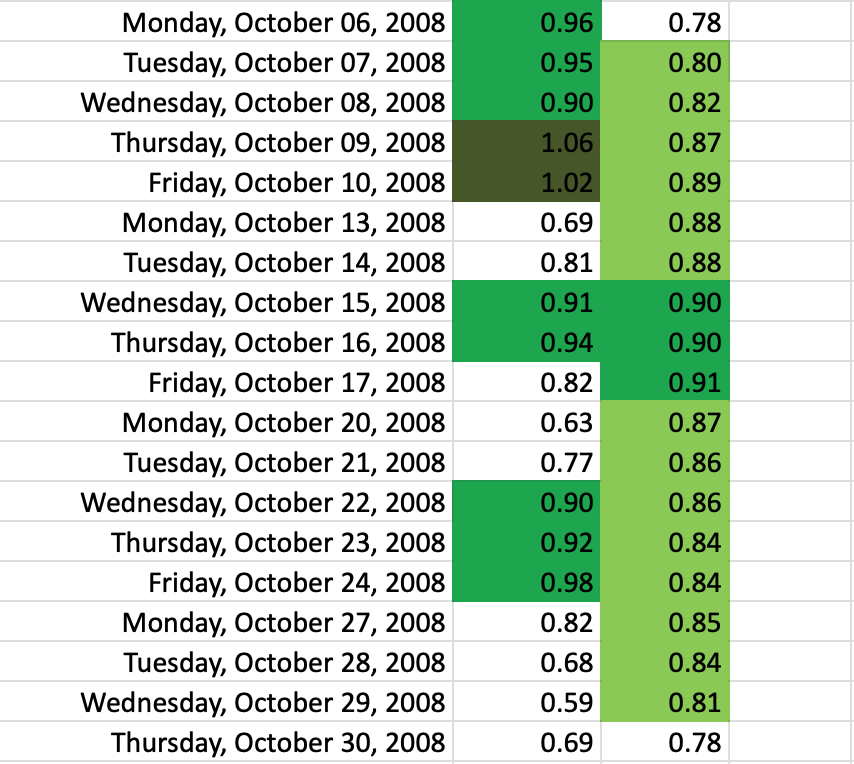
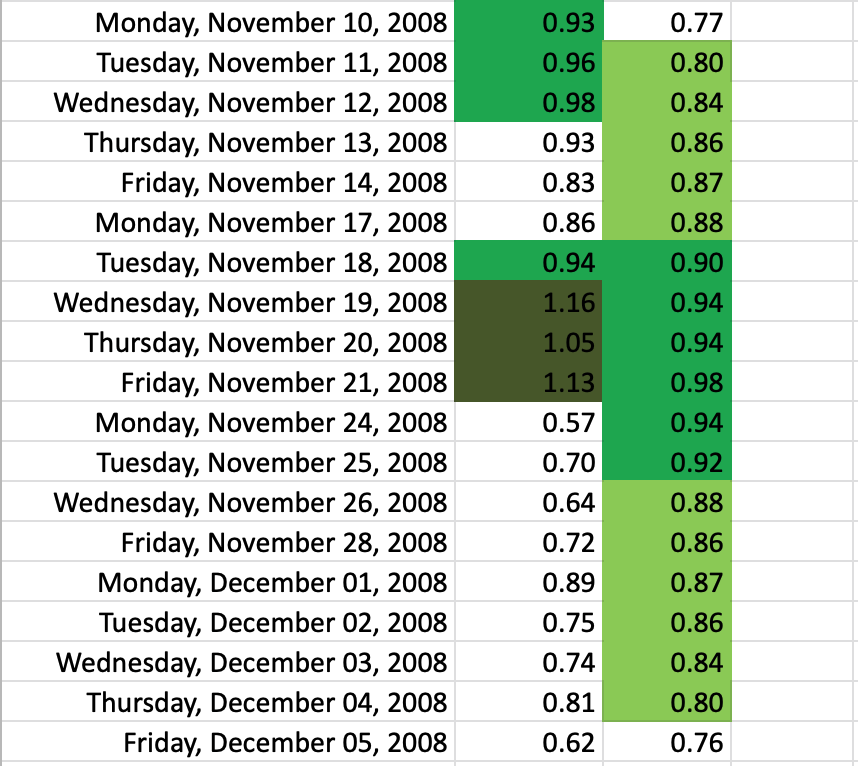
The 10 day average readings are now above 1.00…unprecedented. The 10 day reading hit 1.07 on December 22, a new high for my data. The last time we got any 10 day readings in the 90s was March 2020 and before that, several times in 2008-2009. 

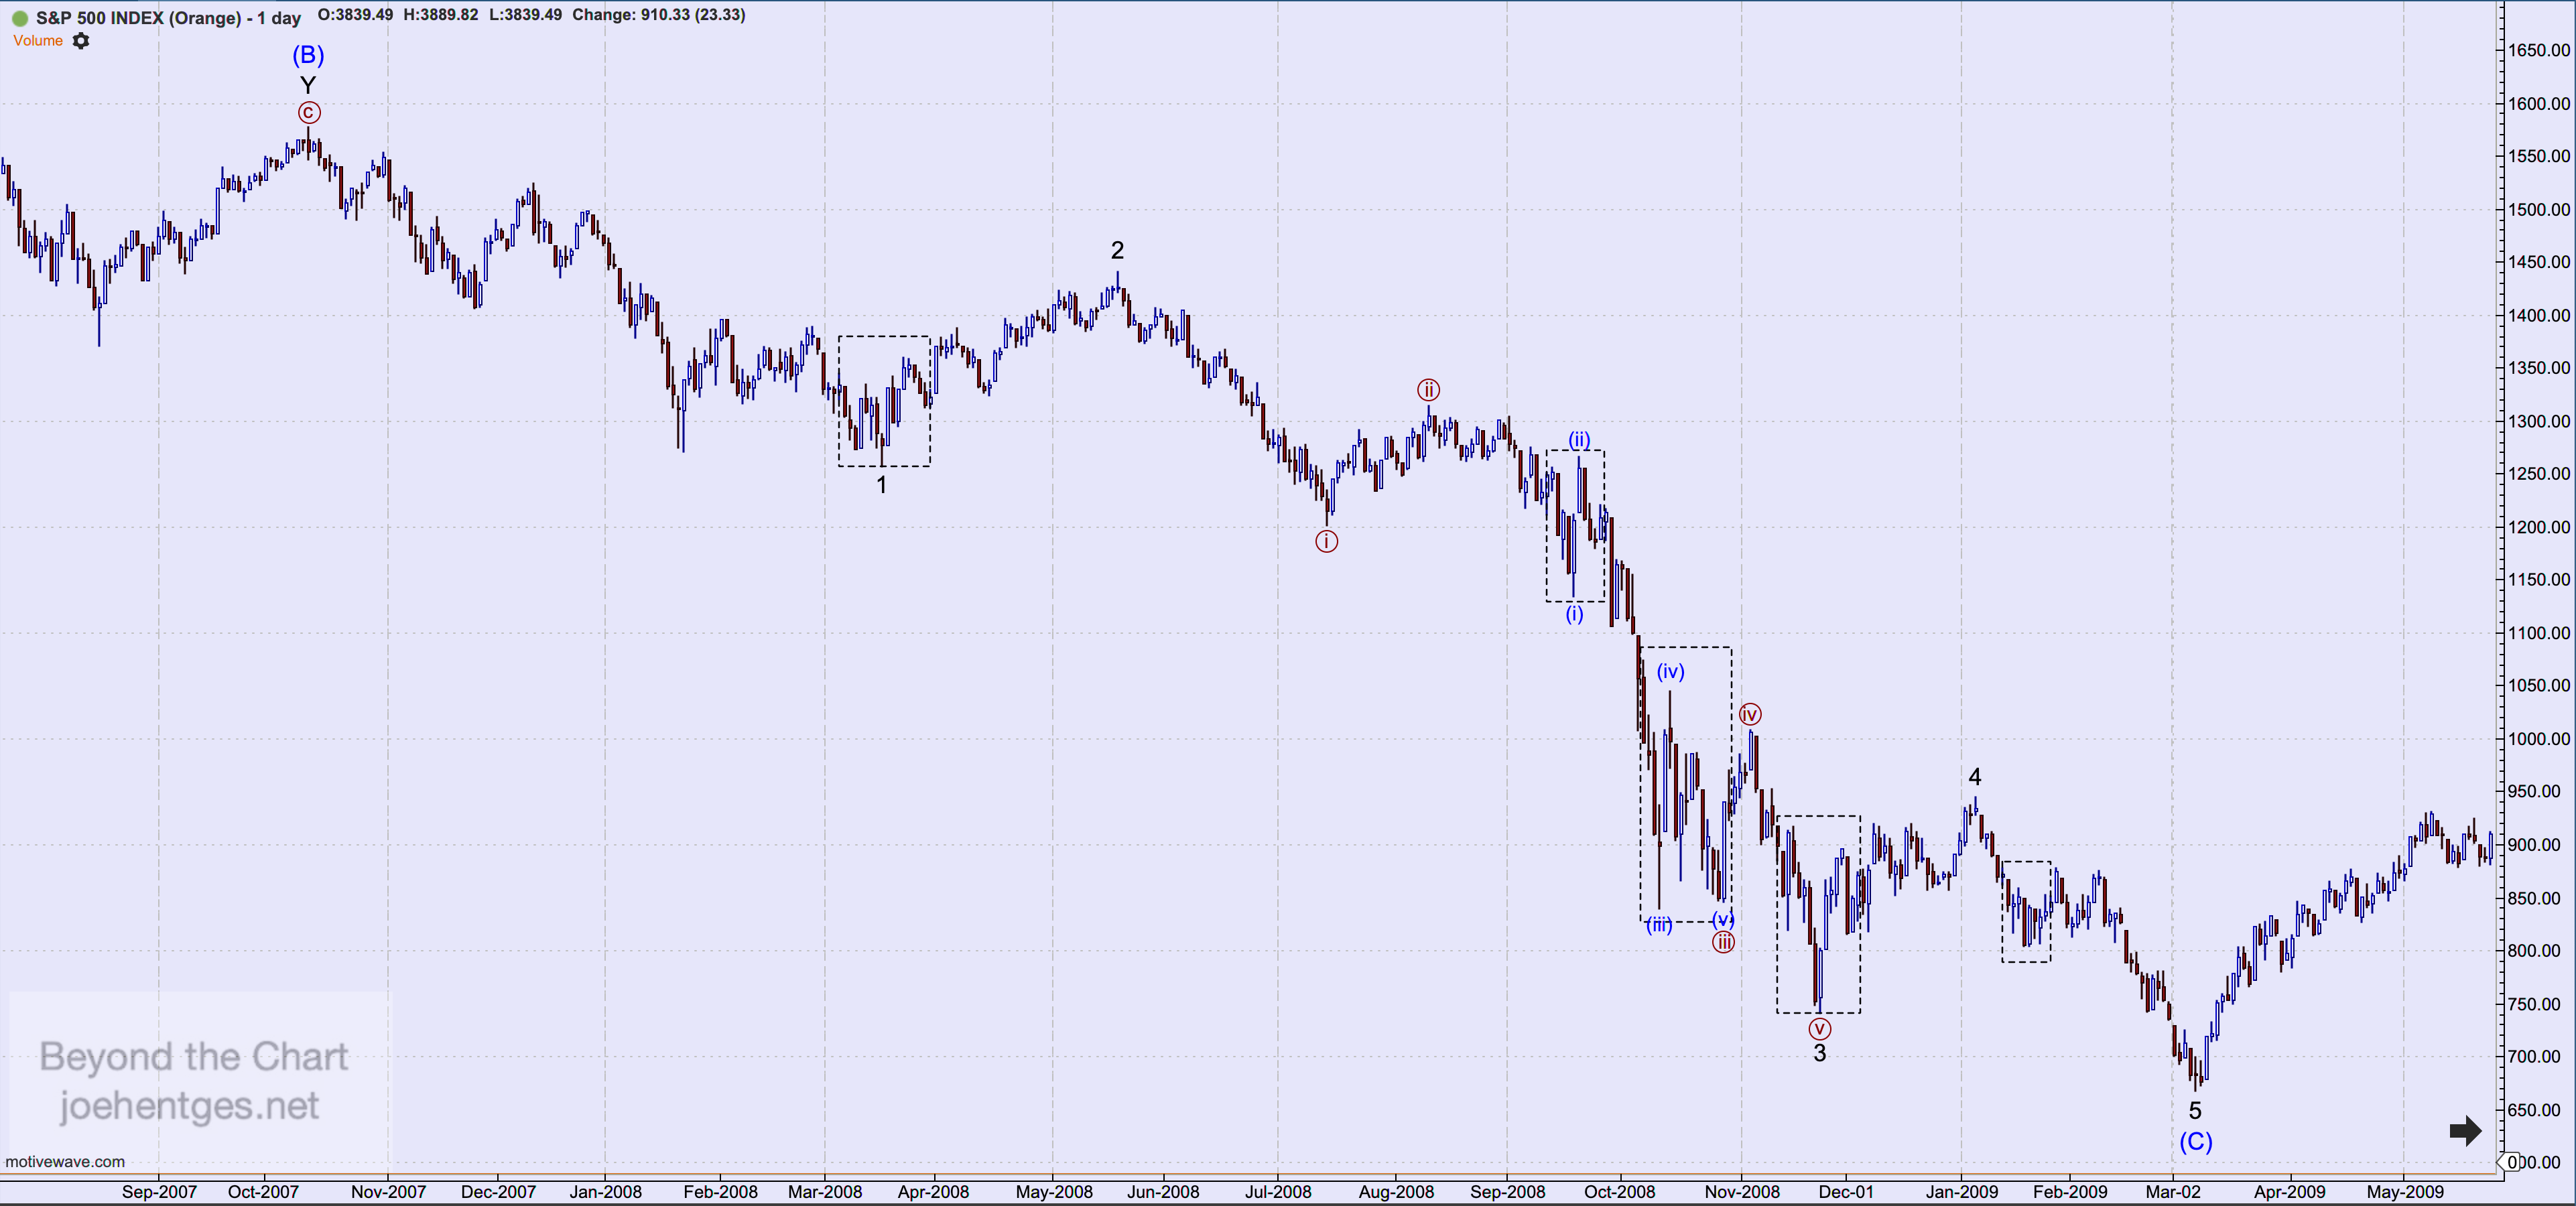
2008-2009 was Wave C of Primary Wave 4 of Cycle Wave V.  C waves are usually very strong and it was the end of an eight year, major corrective pattern. See tables below.  

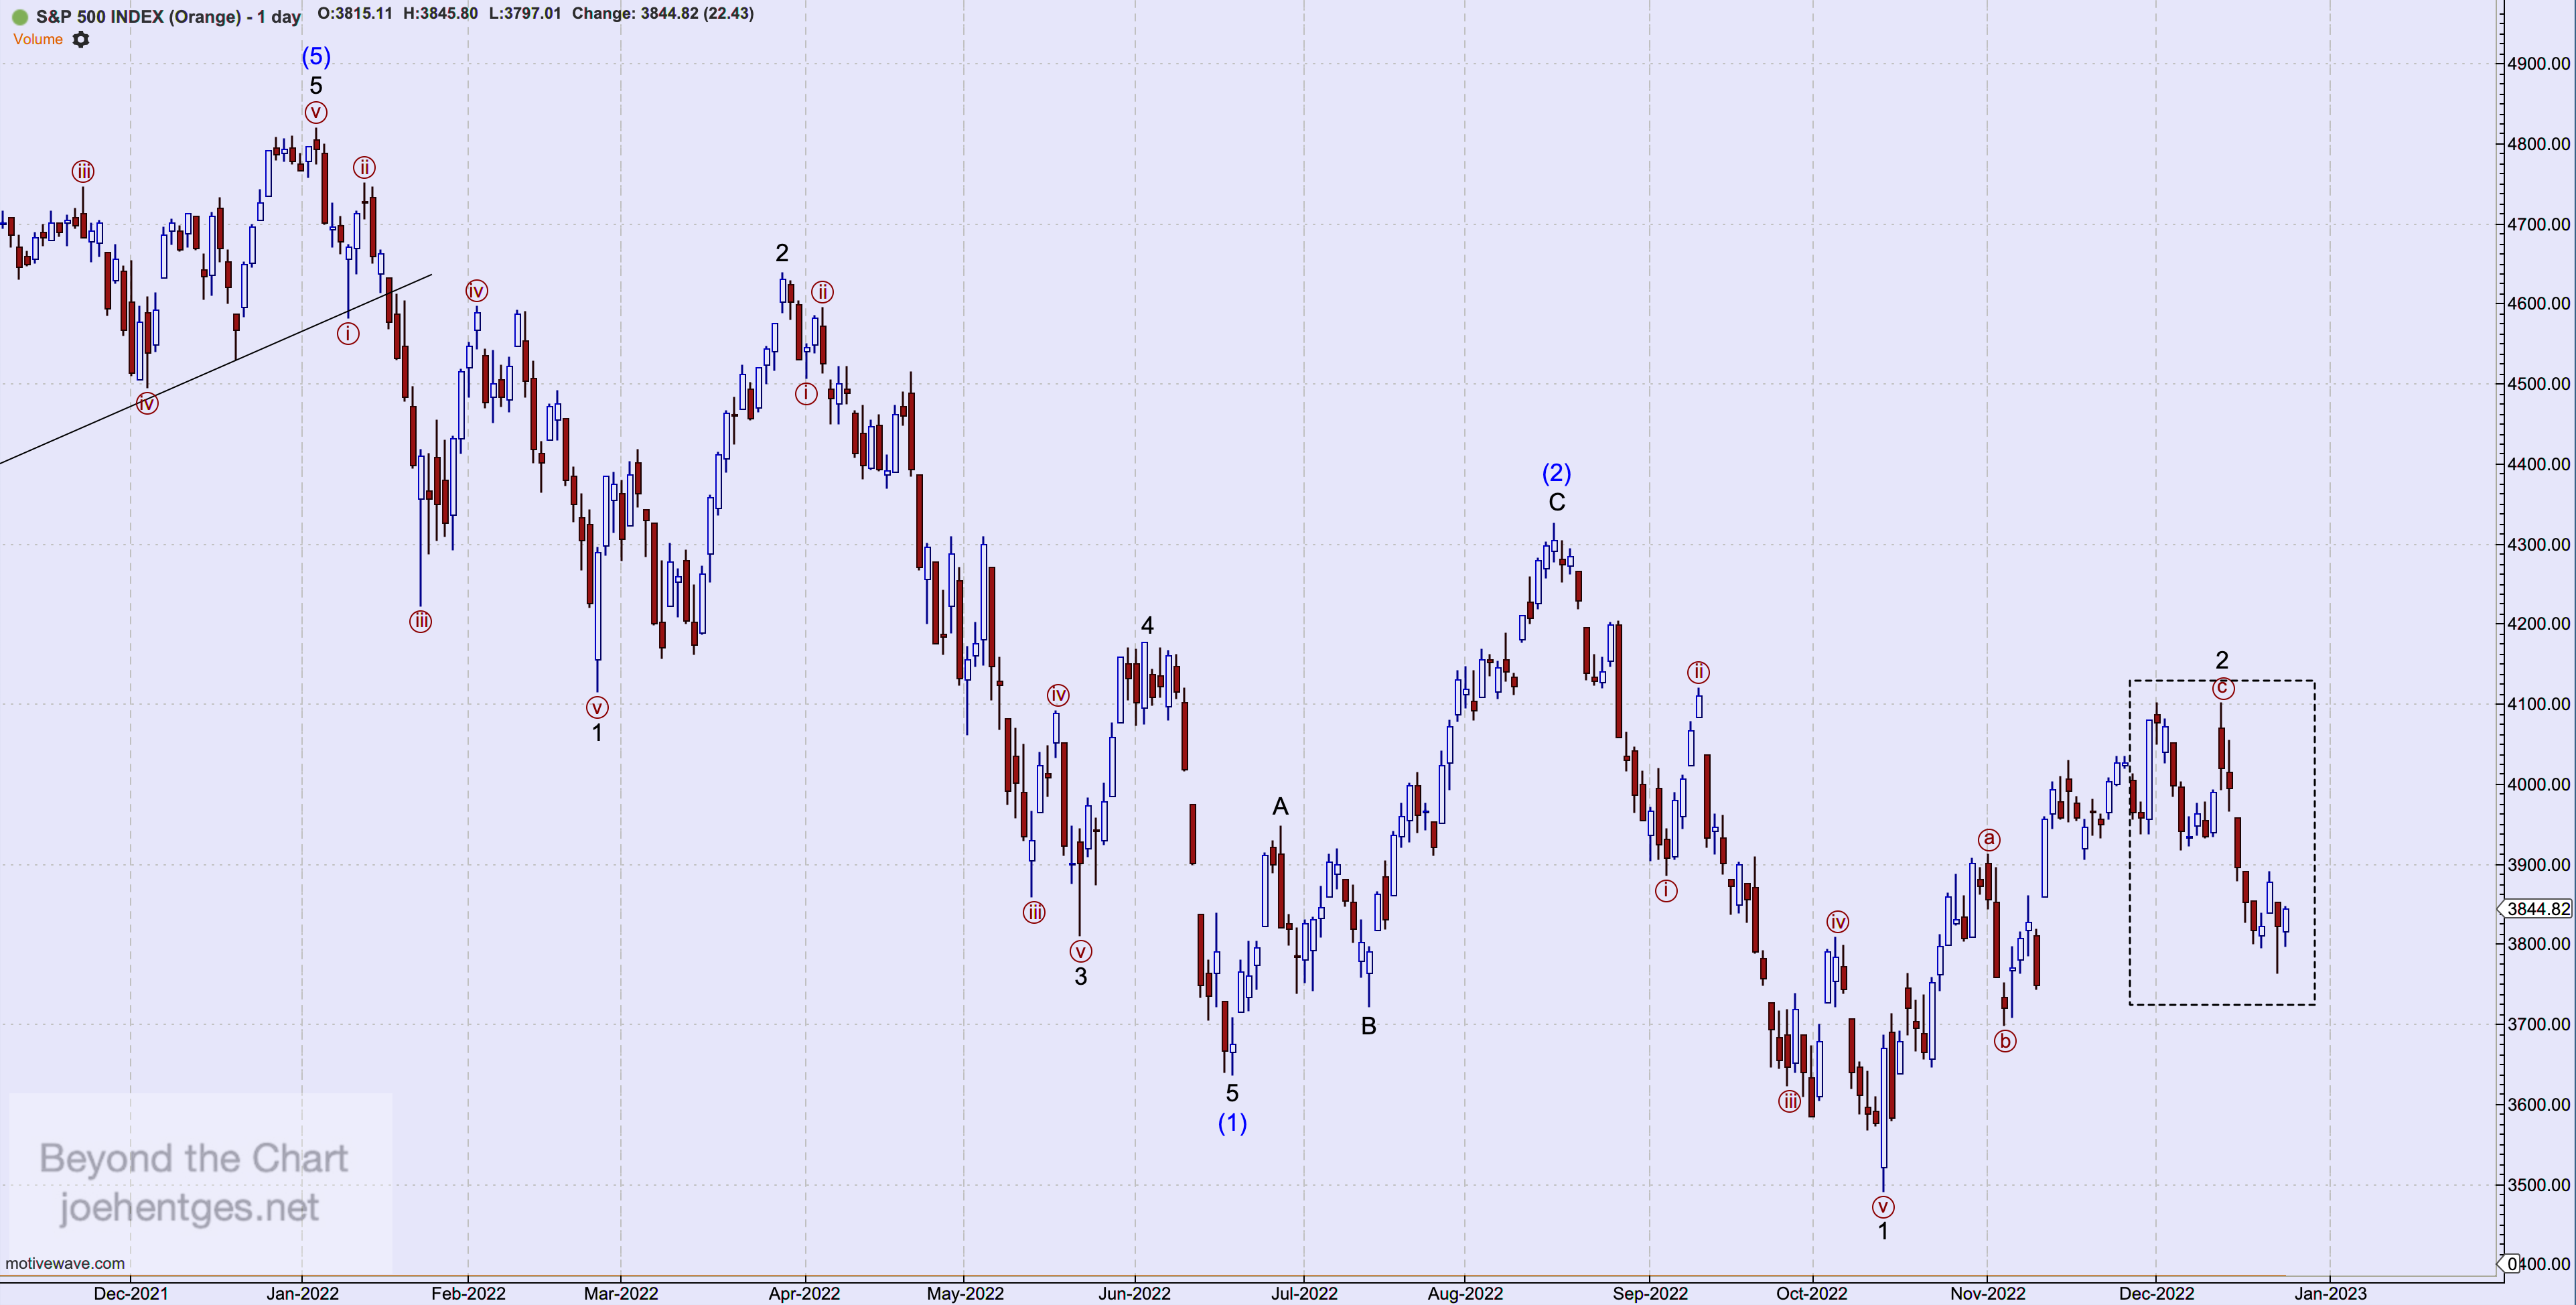
Numbers in the first column are actual readings. The second column are 10 day averages. The dashed line boxes in the chart show where these extreme readings took place.


The bullish sentiment that took hold in Primary Wave 5 of Cycle Wave V (Mar 2009 – Jan 2022) was extraordinary and created a huge bubble. That bullishness  has been very hard to extinguish in 2022.

But we have now had a strong bear move lower. Until recently, bearish sentiment, as shown by put/call ratios had not shown up.  Investors/traders have been in denial. But that is changing. It’s taken 11 months of this bear move to get any extreme readings. In 2008 it only took 5 months from the high to get the first extreme readings in March 20008.

December 2022

I think fear is more powerful than greed. These readings will show extremes unlike anything we’ve ever seen.  The 2.04 reading in the Put/Call on December 21 was a stunner but before this bear is done I think we’ll see even higher.  Near the end of the bull market we saw the most extreme low put/call readings ever recorded.  We’ll see the same thing in the opposite extreme before this bear is done.

Super Cycle Tops

Note: This is an update to a post created about 4 years ago.

Look at the two charts below.  


stock market setup

Primary Wave 3 peak in 1916 – Primary Wave, Cycle Wave and Super Cycle Wave peak in 1929


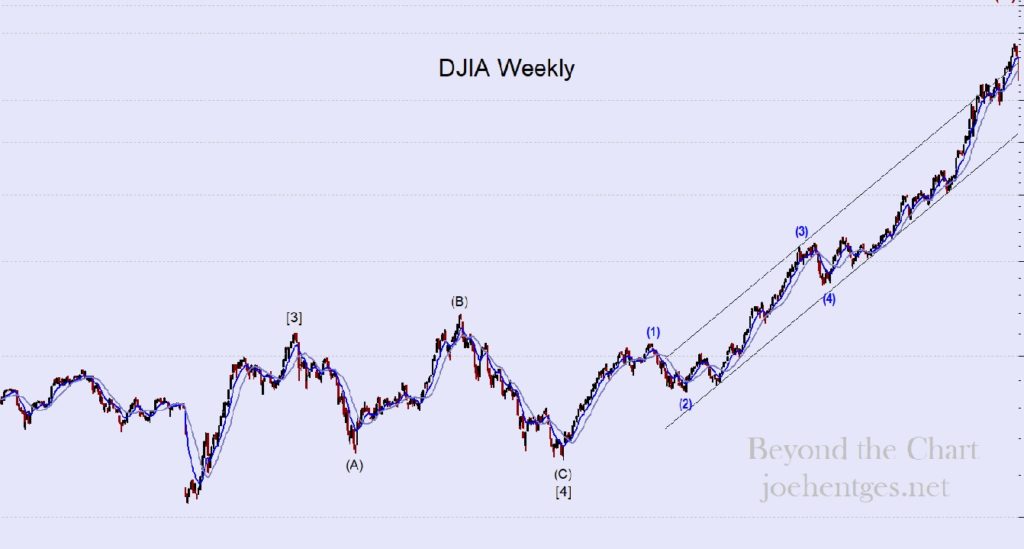
Primary Wave 3 peak in 2000 – Primary, Cycle and Super Cycle peak in January 2022

Look at both charts. Look at the price action between (B) and (C) in Primary Wave [4] on both charts. 

The first chart shows the price move in the Depression of 1920-21 in which the DJIA lost 46.6% of its value.

The second chart shows the Great Recession of 2007-09 in which the DJIA lost 53.8% of its value.  

The Depression of 1920-21 lasted 18 months and experienced tremendous deflation. In fact it was the largest drop in wholesale prices since the Revolutionary War… -36.8%.  Unemployment hit 19%. The Depression of 1920-21 set the stage for the huge stock market rally of the 1920s that ended in the Crash of 1929.  That was followed by the Great Depression that lasted 10 years.

The Great Recession of 2007-09 lasted 18 months and experienced no deflation (as reported). Although house prices dropped dramatically due to that sector being at the heart of the crisis.  Unemployment hit 10% (as reported) and the world financial markets came perilously close to collapse.

Following the end of the Expanded Flat Primary Wave 4 correction in both time periods, a huge run in the stock markets of the United States and around the world occurred.

The DJIA peaked in 1929 at 6 times the value of the lowest close during the Depression of 1920-21.  It was a tremendous 8 year run.

This time the DJIA peaked in January 2022 at about 5.6 times the lowest closing pricing of the Great Recession. Nearly identical to the multiple of 1929. Its run took nearly 13 years.

The shape of the pattern of prices from 1916 to 1921 and those of 2000 to 2009 are nearly identical. The length of time for the bull runs had a Fibonacci relationship, 8 to 13. 

This peak in the stock market is the end of an 89.5 year Super Cycle Wave from July 1932. (89…another Fibonacci number). And now the Super Cycle correction…


1 2 3 44

Powered by WishList Member - Membership Software