Category Archives for "Energy"

Crude Oil Squeeze?

It’s no secret that commodities have been in one heck of a rally over the last year or so.  And that includes crude oil. Light Crude Oil futures fell to a never seen before -$40.32 in April 2020. They have since rallied to a high of $76.98 in July of this year. In the process, Light Crude Oil futures broke a 13 year downtrend from the peak in July 2008.

There appears to be overhead resistance at $77 which when broken would enable Light Crude Oil futures to surge possibly into the 90’s.  What could possibly cause a crude oil squeeze and drive the price significantly higher? Any number of things but I don’t think it matters. What matters is the price action.  

Data thru Sept. 24 10am CT

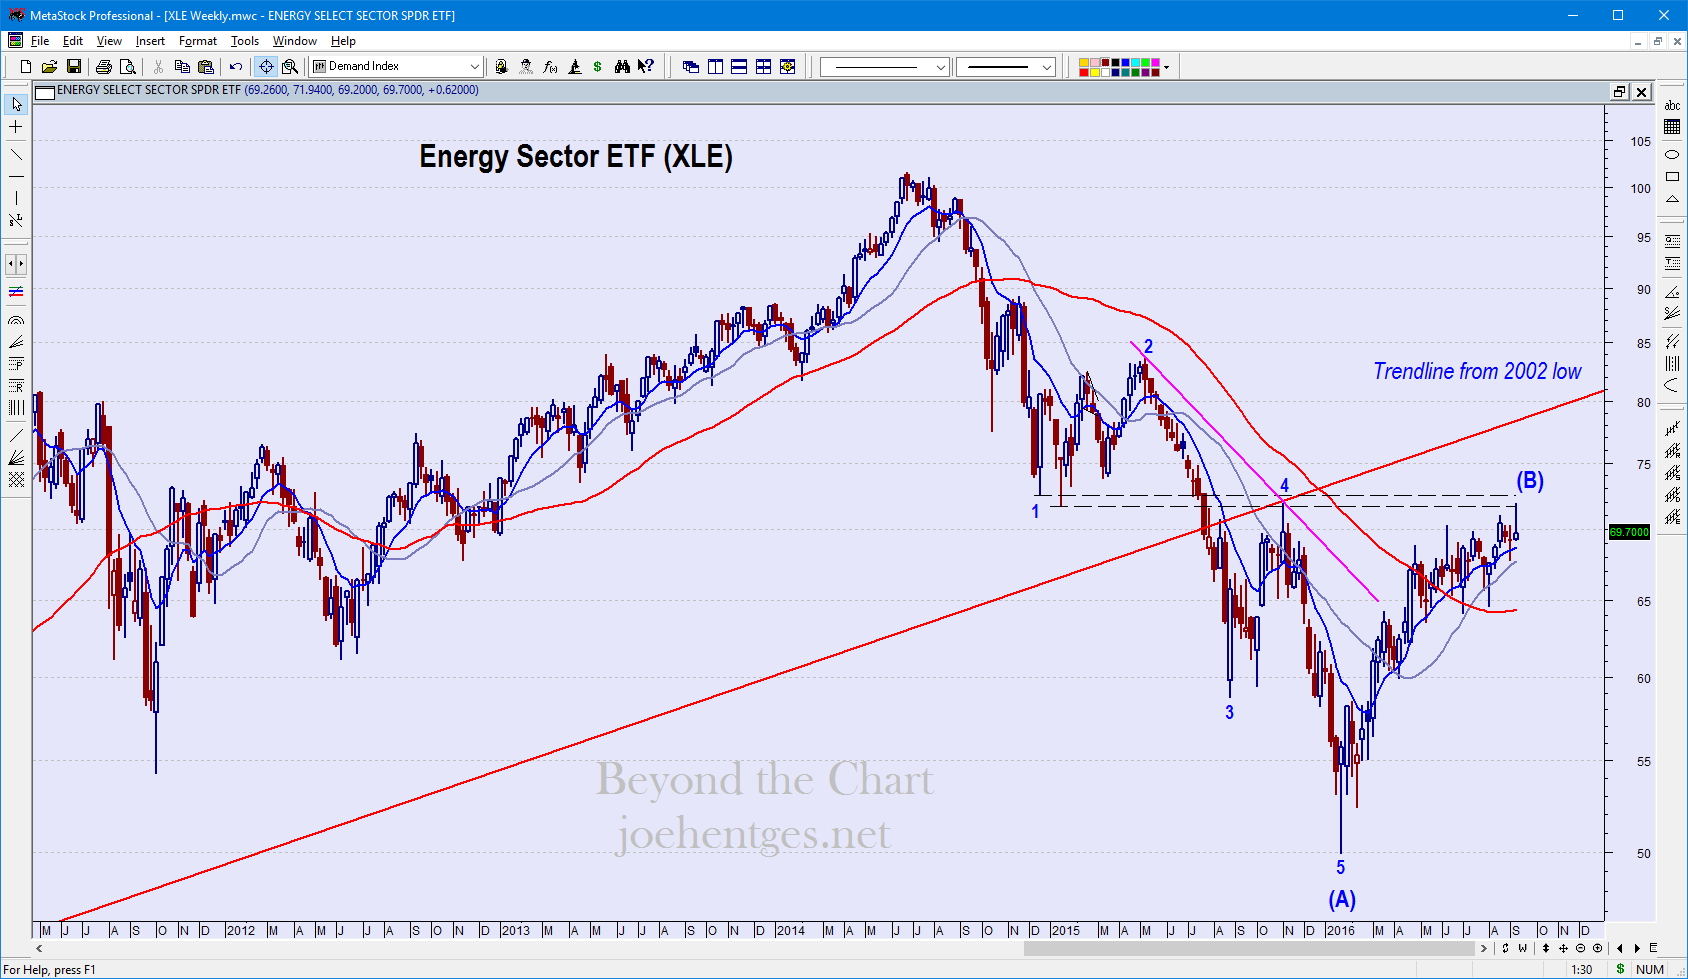
So what about energy stocks? Let’s take a look at the Energy Select Sector SPDR ETF (XLE). From a high of $101.52 in June 2014 they dropped to an intra-week low of $22.88 in March 2020. XLE rallied back to an intra-week high of $56.65 in early June of this year. They have since pulled back some but appear primed to challenge that 2021 high. 

Data thru Sept. 24 10am CT

In the daily chart below, XLE appears to be breaking out of a small Head & Shoulders Bottom pattern.  This projects to the $56 area.  Beyond that, there appears to be plenty of overhead challenges. We’ll see how strong this decides to get. And how much of a move occurs in Light Crude Oil futures. 

Data thru Sept. 24 10am CT

  • a couple of years ago
  • Energy

Electric Vehicle Stocks, Just Another Craze…or the Future?

Electric vehicle stocks have been all the rage recently.  The largest cap stock and clearly the most widely recognized is Tesla (TSLA).  It went public on June 29, 2010 and closed that day at $4.78 (split adjusted). It would take 4 more months before it had a higher close.

By December 31, 2019 TSLA had a full head of steam and closed at $83.67.  But it was just getting started. Enter 2020.

As of November 27, 2020 TSLA closed at $585.76. The previous week it was announced that Tesla would be included in the S&P 500 Index. Tesla is up 7X the closing price at the end of 2019 with a market cap of over $540 billion making Elon Musk the 2nd richest man in the world.

But there are many other electric vehicle stocks in the market place and it seems like every established auto maker is also getting in the act. Many electric vehicle (EV) companies are headquartered in China but North America has a few also.

These next three electric vehicle stocks are worth a combined approximately $150 billion: Nio Inc. (NIO), Li Auto, inc. (LI) and Xpeng Inc. (XPEV) according to this Bloomberg article. XPEV founded in 2014 is headquartered in Guangzhou, China. NIO founded in 2014 is headquartered Shanghai, China. LI founded in 2015 is headquartered in Beijing, China. 

The next chart below shows that NIO is up 1343% in 2020 alone. It has been trading since September 12, 2018.

Li Auto came public on July 30, 2020 and closed at $16.46.  On Friday, November 27 it closed at $39.48...only up 240%.

And Xpeng came public on August 27, 2020 and is up 303% from its opening day closing price.

There are many other companies that are focused on EVs also. Some are truck only, some small commercial vehicles only, some are battery related. Here are a few of the names: BYD Co. Ltd.(BYD) - China, Nikola (NKLA) - U.S., Workhorse (WKHS) - U.S., Kandi Technology Group (KNDI) - China, Blink Charging Co. (BLNK) - U.S., ElectraMeccanica (SOLO) - Canada, Ayro Inc. (AYRO) - U.S. and Green Power Motors (GP) - Canada to name a few.

This is a dynamic, quickly evolving market. Given the ever increasing focus on climate change and the future health of the planet, electric vehicle stocks are definitely in the crosshairs of many traders and investors.

crude oil

Has the Energy Sector Hit the Wall?

Today we look at the Energy Select Sector SPDR ETF (XLE) and ask whether the energy sector has hit the wall.

The XLE is one of the most active industry sector ETFs with a 50 day moving average of 95 million shares.  It tracks a market-cap weighted index of US energy companies in the S&P 500.  

Energy Sector

In the big decline from the peak in June 2014 to the low in January 2016, XLE smashed thru a major uptrend line from the 2002 low, in July 2015. It pulled back to it last November but then quickly fell away.

It has had a big move up off the January low, but running into significant resistance at 72.0. It has not broken down yet.  Watch for consecutive closes below the 10 week ema and then for the 10 ema to cross below the 21 sma.  Look at September 2014 and June 2015 for good examples.

Energy Sector

Weekly April 2011 – Sept 2016

The top three holdings in the Energy Sector ETF are Exxon Mobil (XOM) at 18.65%, Chevron (CVX) at 14.81% and Schlumberger (SLB) at 8.83%. I’ll start with Exxon Mobil. Continue reading

CAT Hitting a Wall?

CAT hitting the WallCaterpillar(CAT) cut its first quarter revenue and earnings guidance but held to the full year guidance.  I should add, at least for now.  I look at CAT in the brief video below.

As you can see in the chart below, CAT dropped from a closing high of 111.40 in July 2014 to a closing low of 57.91 in January this year. That’s nearly a 50% drop. Continue reading

Powered by WishList Member - Membership Software