
Today we look at the Energy Select Sector SPDR ETF (XLE) and ask whether the energy sector has hit the wall.
The XLE is one of the most active industry sector ETFs with a 50 day moving average of 95 million shares. It tracks a market-cap weighted index of US energy companies in the S&P 500.
Energy Sector
In the big decline from the peak in June 2014 to the low in January 2016, XLE smashed thru a major uptrend line from the 2002 low, in July 2015. It pulled back to it last November but then quickly fell away.
It has had a big move up off the January low, but running into significant resistance at 72.0. It has not broken down yet. Watch for consecutive closes below the 10 week ema and then for the 10 ema to cross below the 21 sma. Look at September 2014 and June 2015 for good examples.
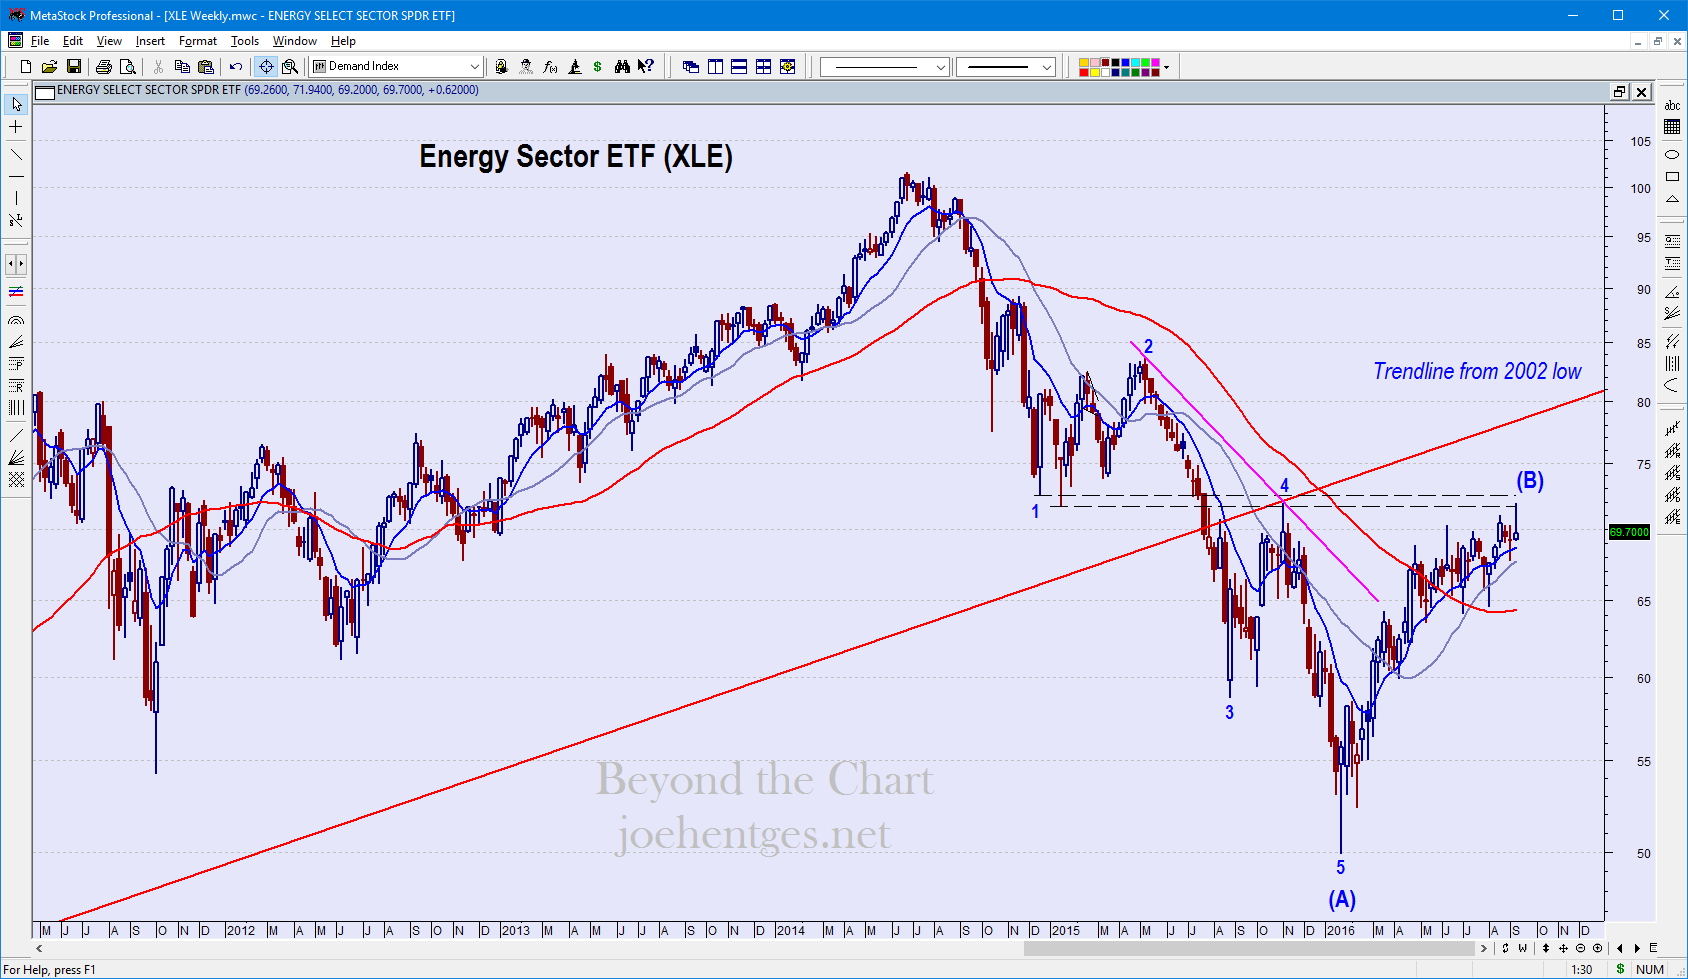
Weekly April 2011 – Sept 2016
The top three holdings in the Energy Sector ETF are Exxon Mobil (XOM) at 18.65%, Chevron (CVX) at 14.81% and Schlumberger (SLB) at 8.83%. I’ll start with Exxon Mobil.
Exxon Mobil
Exxon Mobil broke its uptrend line from 2oo2, in June 2015, leading the XLE. The entire move up from the August 2015 low looks like a zigzag counter-trend move. This move ended in a 2nd pullback to the trendline and slightly overshot it. It is now rapidly falling away.
The drop-off started with the big down week ending July 29, 2016. The last 5 weeks look like consolidation with 1o ema now crossing below the 21 sma. The price action of the last 8 weeks looks very similar to August 2014.
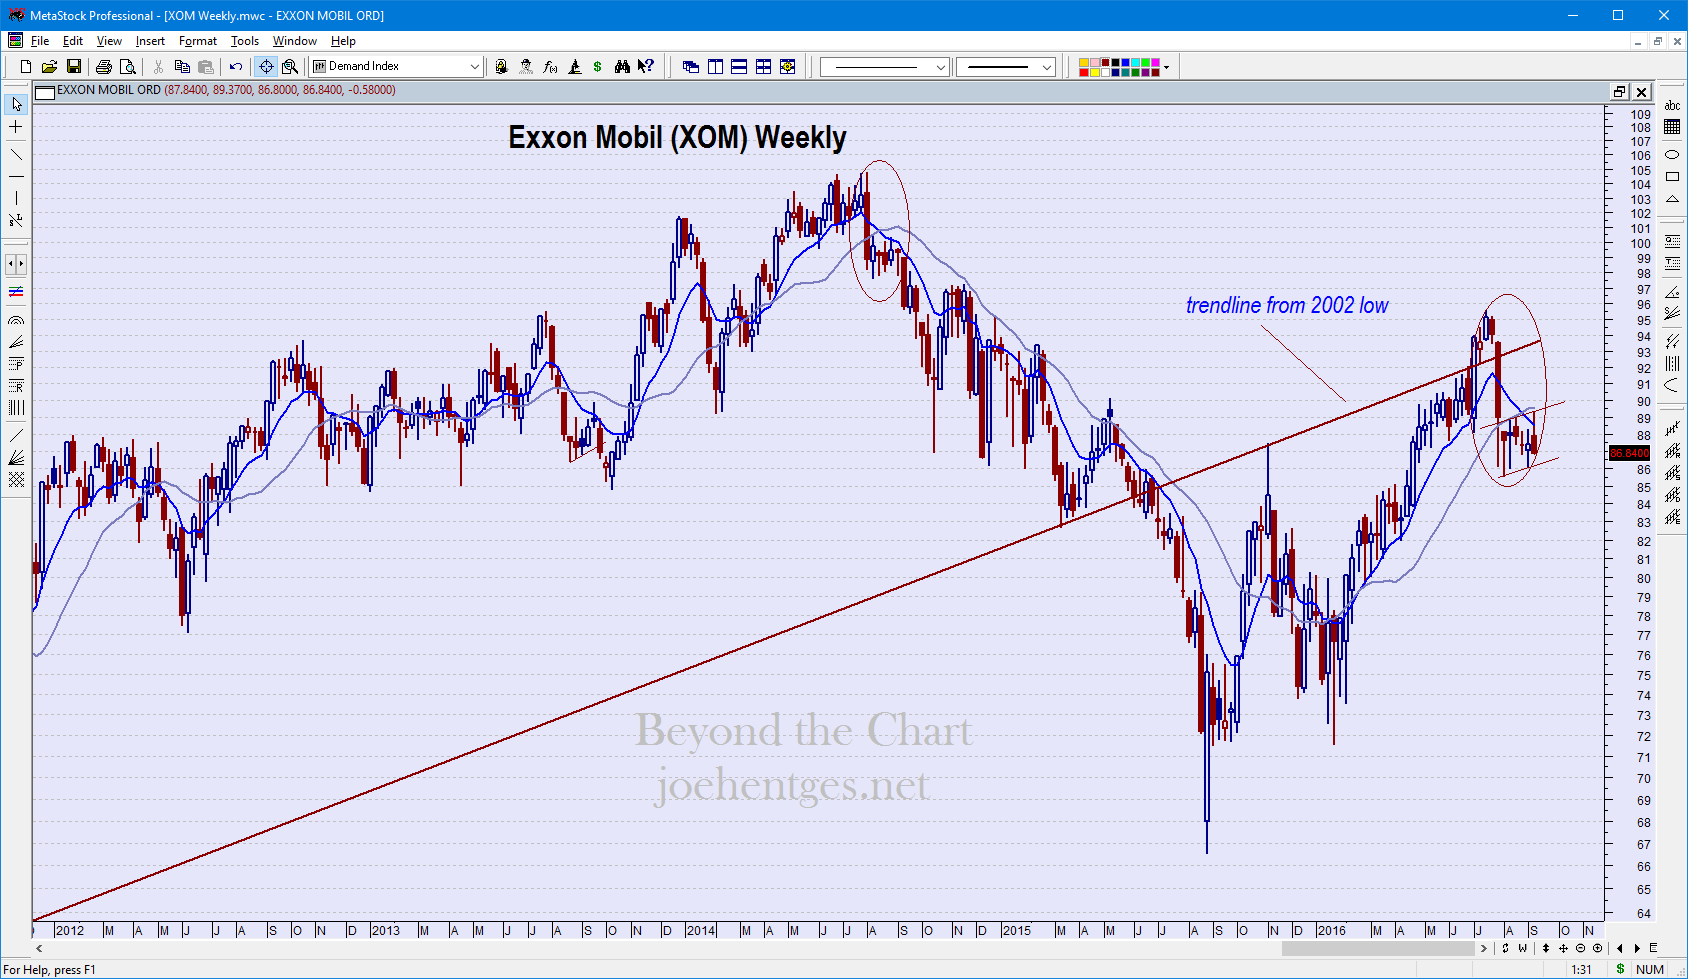
Weekly from December 2011 – Sept 2016
Chevron
Chevron broke a long-term uptrend line from January 2003, but then spent quite a bit of time oscillating back and forth at that trendline, forming a symmetrical triangle from December 2014 thru May 2015.
It too bottomed in August 2015 and formed a zigzag counter-trend move back up to the 107-108 area which coincides with the center of the symmetrical triangle. It too has been consolidating over the last 6 weeks.
There is also the potential of a small Head & Shoulders top starting in April 2016 thru this week’s price action.
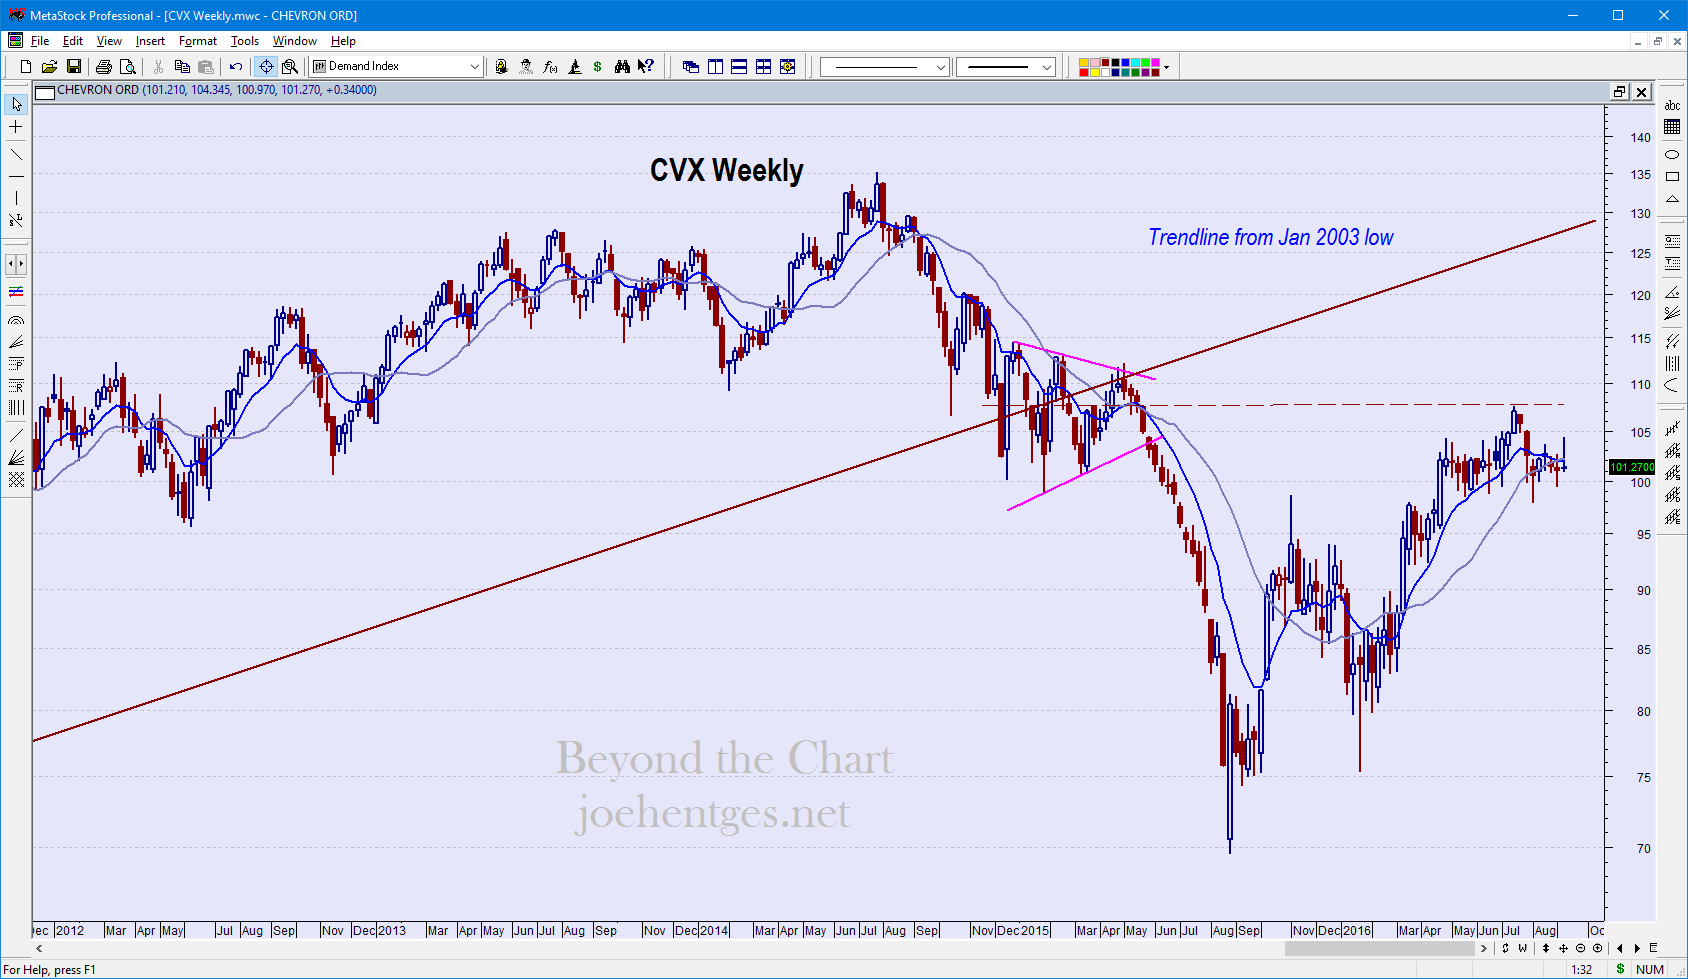
Weekly December 2011 – Sept 2016
Schlumberger
Schlumberger broke its uptrend line in November 2014, pulled back to it in April 2015, then fell away to resume the downtrend. It did not bottom until January 2016. Since then it has rallied back but running into resistance in the 82-83 area.
Notice how it has now closed 2 consecutive weeks below the 10 ema. This is a possible start to the next leg down.
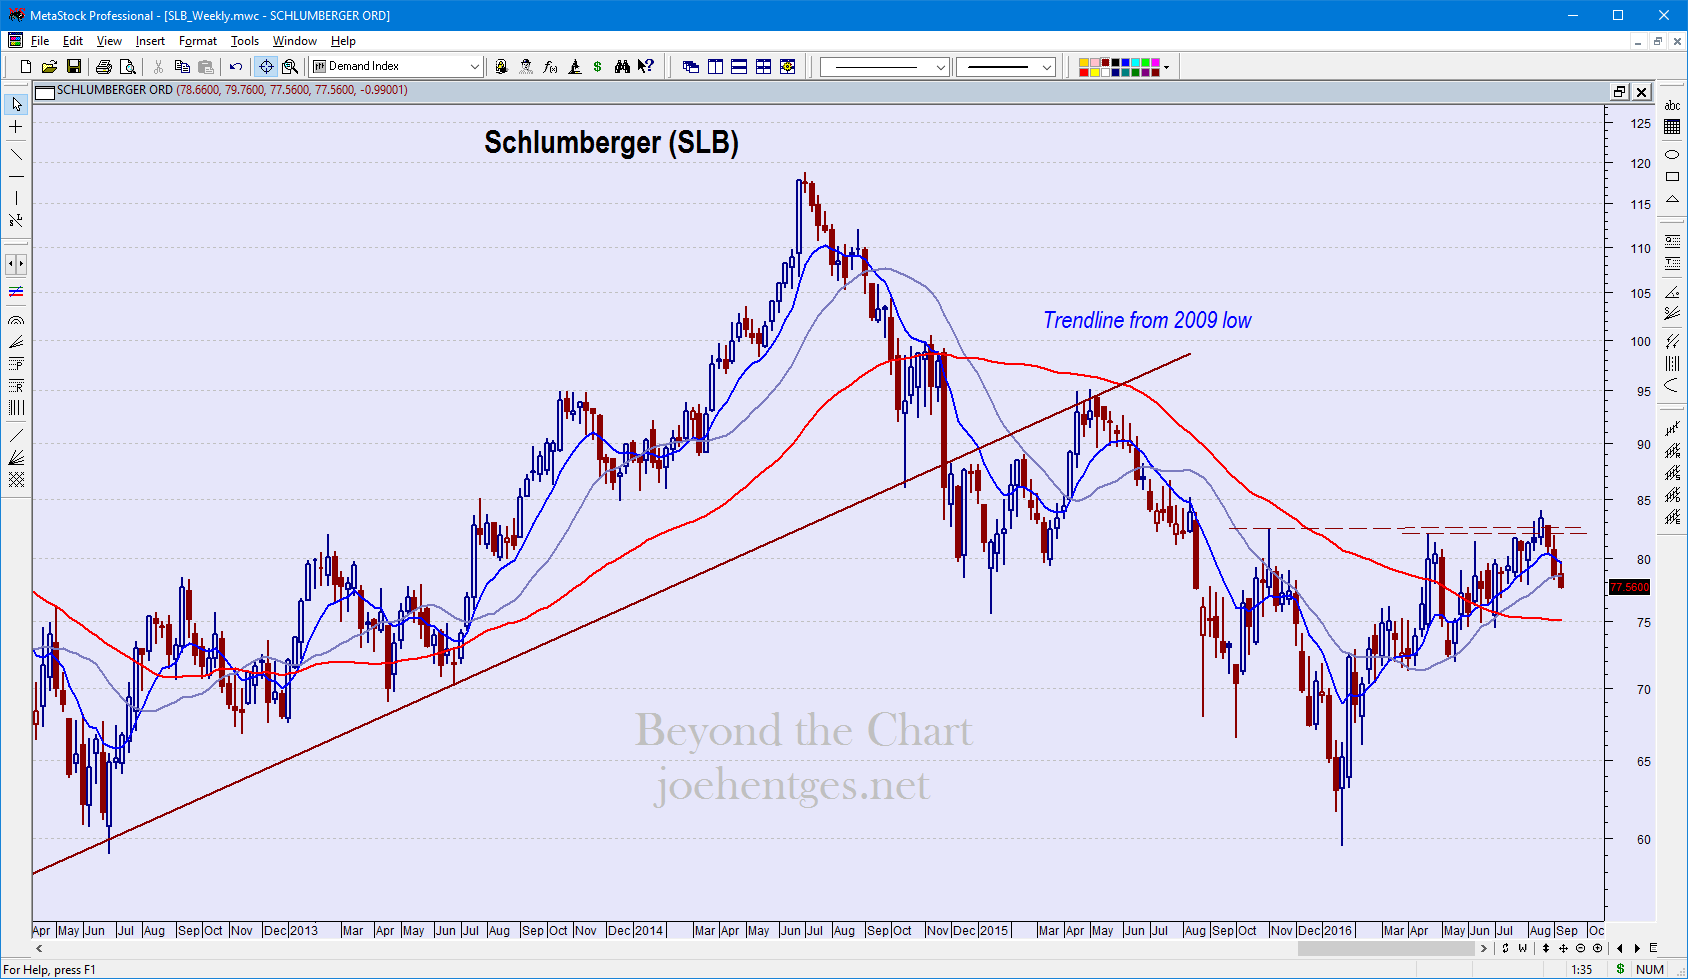
Weekly April 2012 – Sept 2016
![]()
![]()
![]()
Video
In this brief market update video I review this week’s market action by reviewing the SPY and QQQ then look at the Homebuilders and Semiconductors ETFs. Three stocks this week: Apple, Facebook and Alibaba.