0

Has the Energy Sector Hit the Wall?
Today we look at the Energy Select Sector SPDR ETF (XLE) and ask whether the energy sector has hit the wall.
The XLE is one of the most active industry sector ETFs with a 50 day moving average of 95 million shares. It tracks a market-cap weighted index of US energy companies in the S&P 500.
Energy Sector
In the big decline from the peak in June 2014 to the low in January 2016, XLE smashed thru a major uptrend line from the 2002 low, in July 2015. It pulled back to it last November but then quickly fell away.
It has had a big move up off the January low, but running into significant resistance at 72.0. It has not broken down yet. Watch for consecutive closes below the 10 week ema and then for the 10 ema to cross below the 21 sma. Look at September 2014 and June 2015 for good examples.
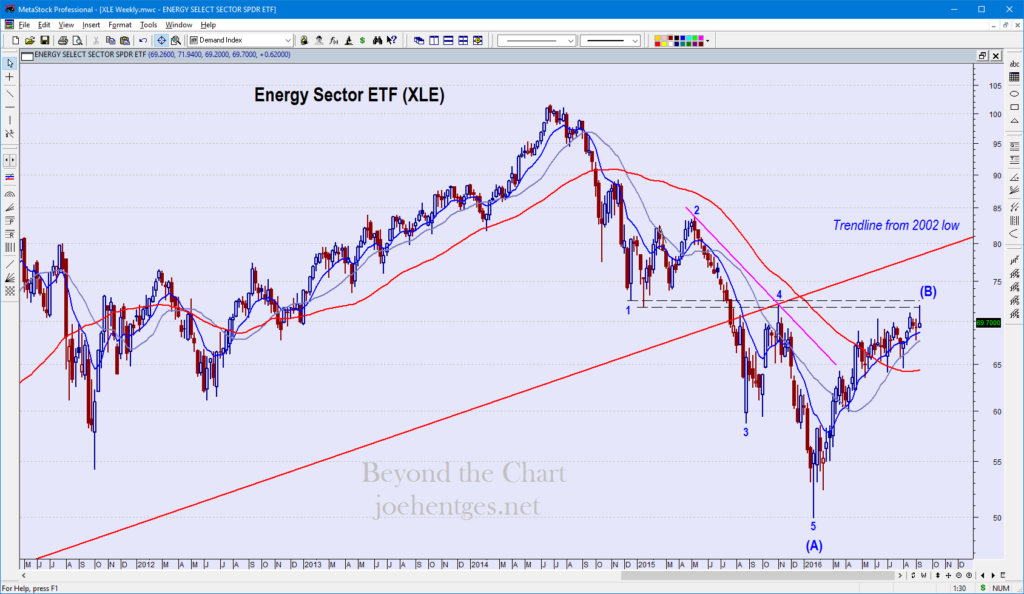
Weekly April 2011 – Sept 2016
The top three holdings in the Energy Sector ETF are Exxon Mobil (XOM) at 18.65%, Chevron (CVX) at 14.81% and Schlumberger (SLB) at 8.83%. I’ll start with Exxon Mobil. Continue reading


 When it comes to the markets, I believe you need to be thinking with a little bit of a contrarian perspective. When a lot of people are doing the same thing or talking about the same thing then “red flags” should go up in your mind. One of the classic signals of the last 50 years was when BusinessWeek had their “The Death of Equities” cover of their magazine on August 13,1979.