All Posts by Joe Hentges

Super Cycle Tops

Note: This is an update to a post created about 4 years ago.

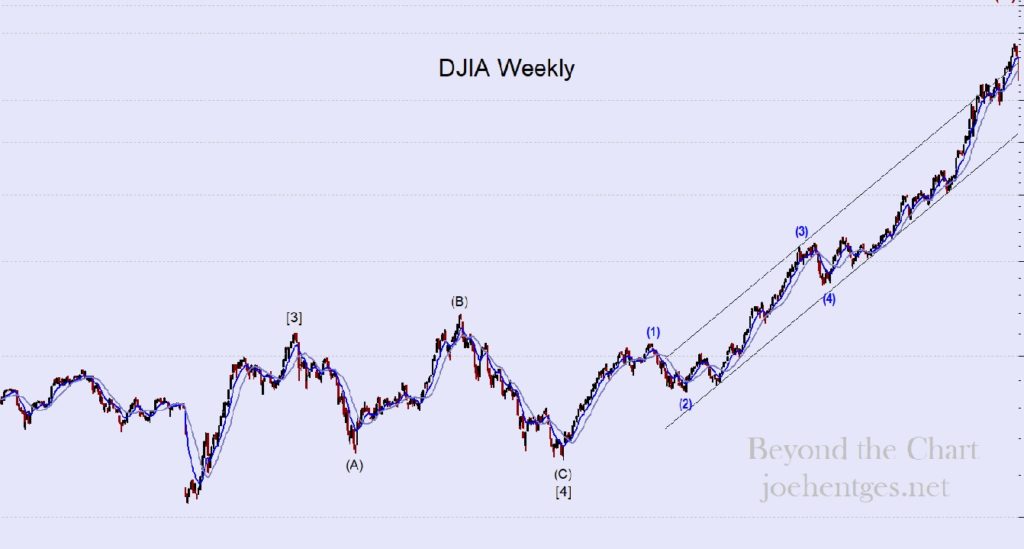
Look at the two charts below.  
 

stock market setup

Primary Wave 3 peak in 1916 – Primary Wave, Cycle Wave and Super Cycle Wave peak in 1929


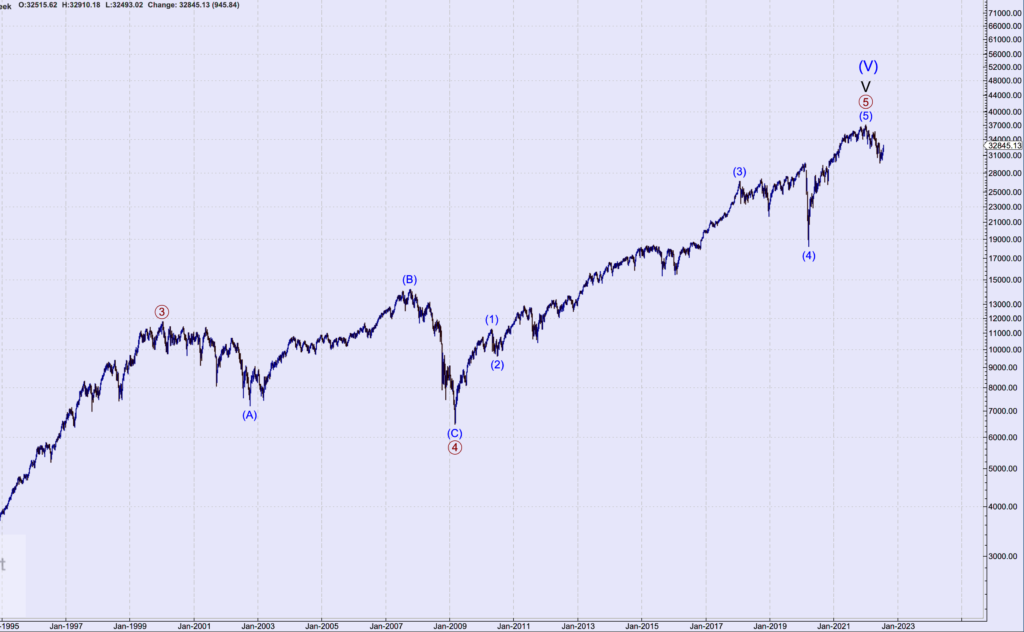
Primary Wave 3 peak in 2000 – Primary, Cycle and Super Cycle peak in January 2022

Look at both charts. Look at the price action between (B) and (C) in Primary Wave [4] on both charts. 

The first chart shows the price move in the Depression of 1920-21 in which the DJIA lost 46.6% of its value.

The second chart shows the Great Recession of 2007-09 in which the DJIA lost 53.8% of its value.  

The Depression of 1920-21 lasted 18 months and experienced tremendous deflation. In fact it was the largest drop in wholesale prices since the Revolutionary War… -36.8%.  Unemployment hit 19%. The Depression of 1920-21 set the stage for the huge stock market rally of the 1920s that ended in the Crash of 1929.  That was followed by the Great Depression that lasted 10 years.

The Great Recession of 2007-09 lasted 18 months and experienced no deflation (as reported). Although house prices dropped dramatically due to that sector being at the heart of the crisis.  Unemployment hit 10% (as reported) and the world financial markets came perilously close to collapse.

Following the end of the Expanded Flat Primary Wave 4 correction in both time periods, a huge run in the stock markets of the United States and around the world occurred.

The DJIA peaked in 1929 at 6 times the value of the lowest close during the Depression of 1920-21.  It was a tremendous 8 year run.

This time the DJIA peaked in January 2022 at about 5.6 times the lowest closing pricing of the Great Recession. Nearly identical to the multiple of 1929. Its run took nearly 13 years.

The shape of the pattern of prices from 1916 to 1921 and those of 2000 to 2009 are nearly identical. The length of time for the bull runs had a Fibonacci relationship, 8 to 13. 

This peak in the stock market is the end of an 89.5 year Super Cycle Wave from July 1932. (89…another Fibonacci number). And now the Super Cycle correction…


Gold and the Miners

I use the Gold ETF (GLD) as a proxy for the price action in gold. We are experiencing a strong bout of inflation right now, running at 40 year highs. It seems to be out of control.  It is affecting everything…except gold.

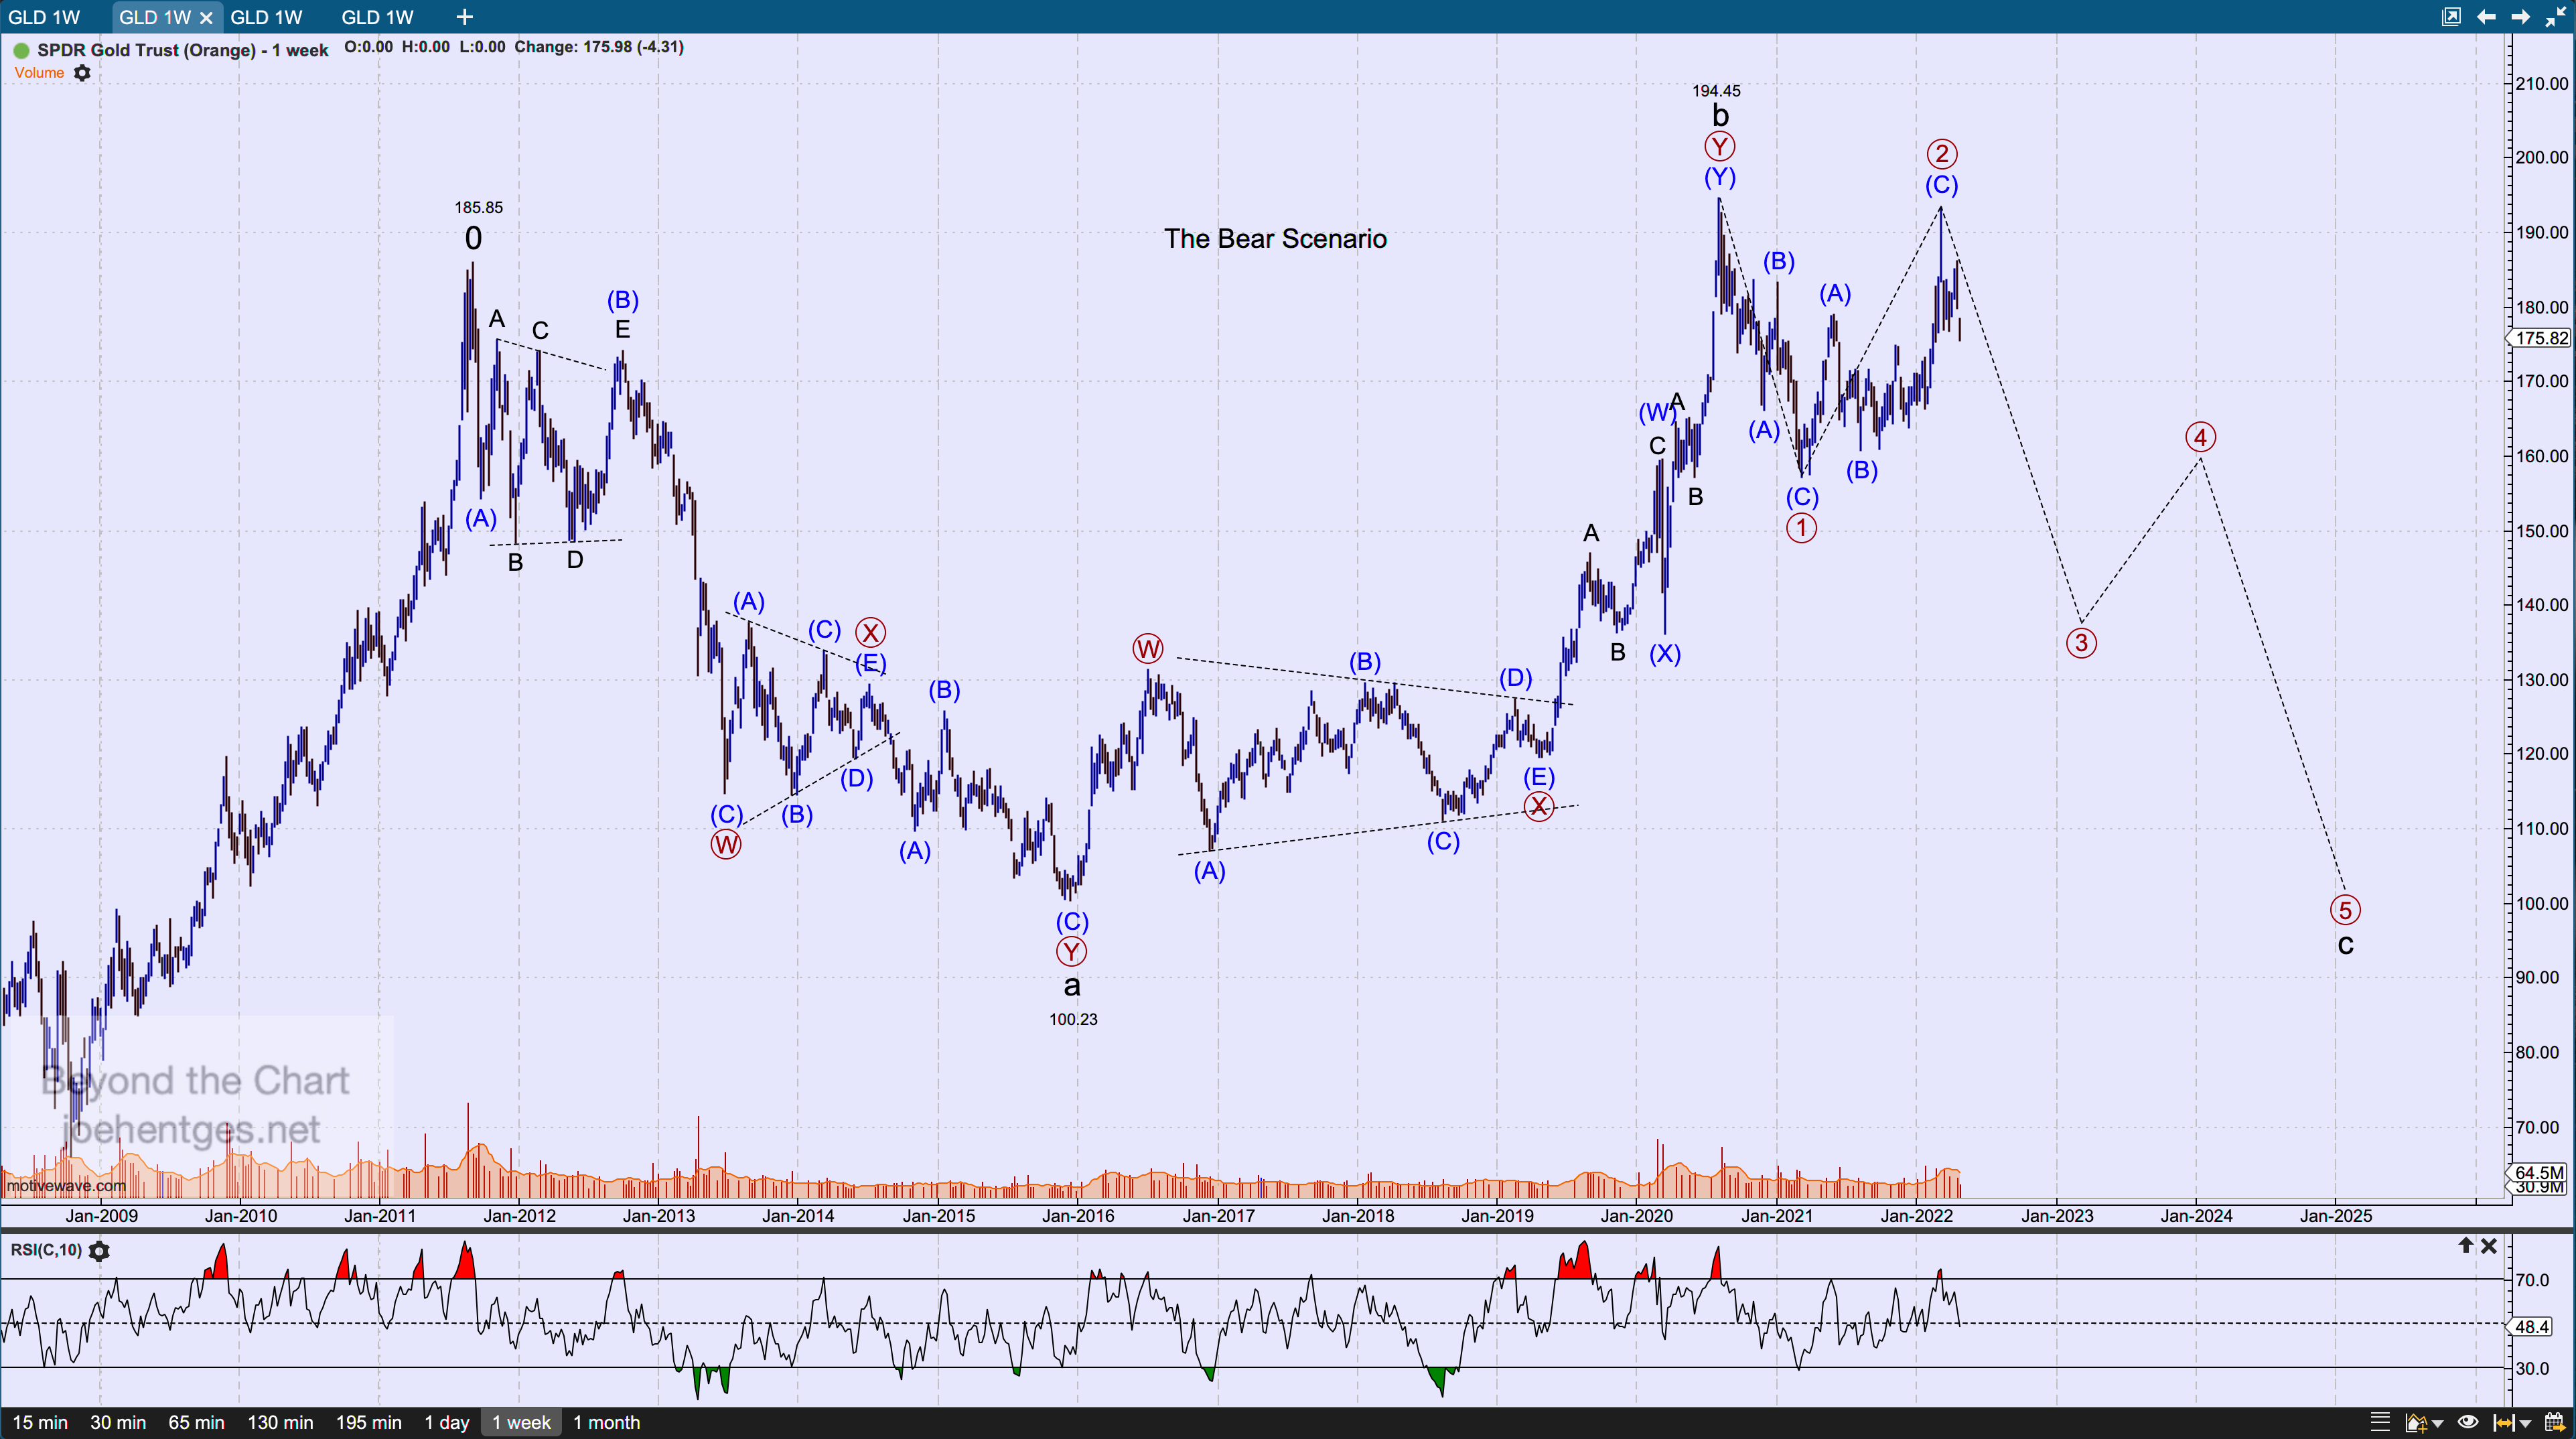
Gold really hasn’t reacted to the inflation news. GLD reached a high of 194.45 on August 6, 2020 which was tested again on March 8, 2022 hitting an intra-day high of 193.30 but that was it. GLD closed at 175.98 on April 27, 2022.  

So after trying to support the bullish view for a long time, I am now moving to the bear camp. The chart below is a long-term weekly chart of GLD. This chart shows the September 2011 high of 185.5 followed by a double three W-X-Y corrective pattern that concluded "Cycle Wave a" at 100.23 in December 2015.  

This was followed by another W-X-Y "Cycle Wave b" that punched to a slightly higher high as part of a large Elliott Wave “Flat" pattern. And we are now in Primary Wave 3 (circled) of "Cycle Wave c". Based on the price action of the last 2 years "Cycle Wave c" is carving out an ending diagonal pattern much lower. 

Where does this pattern fail? If GLD pushes above 194.45 then I would have to re-visit the bullish scenario.

Data thru April 27

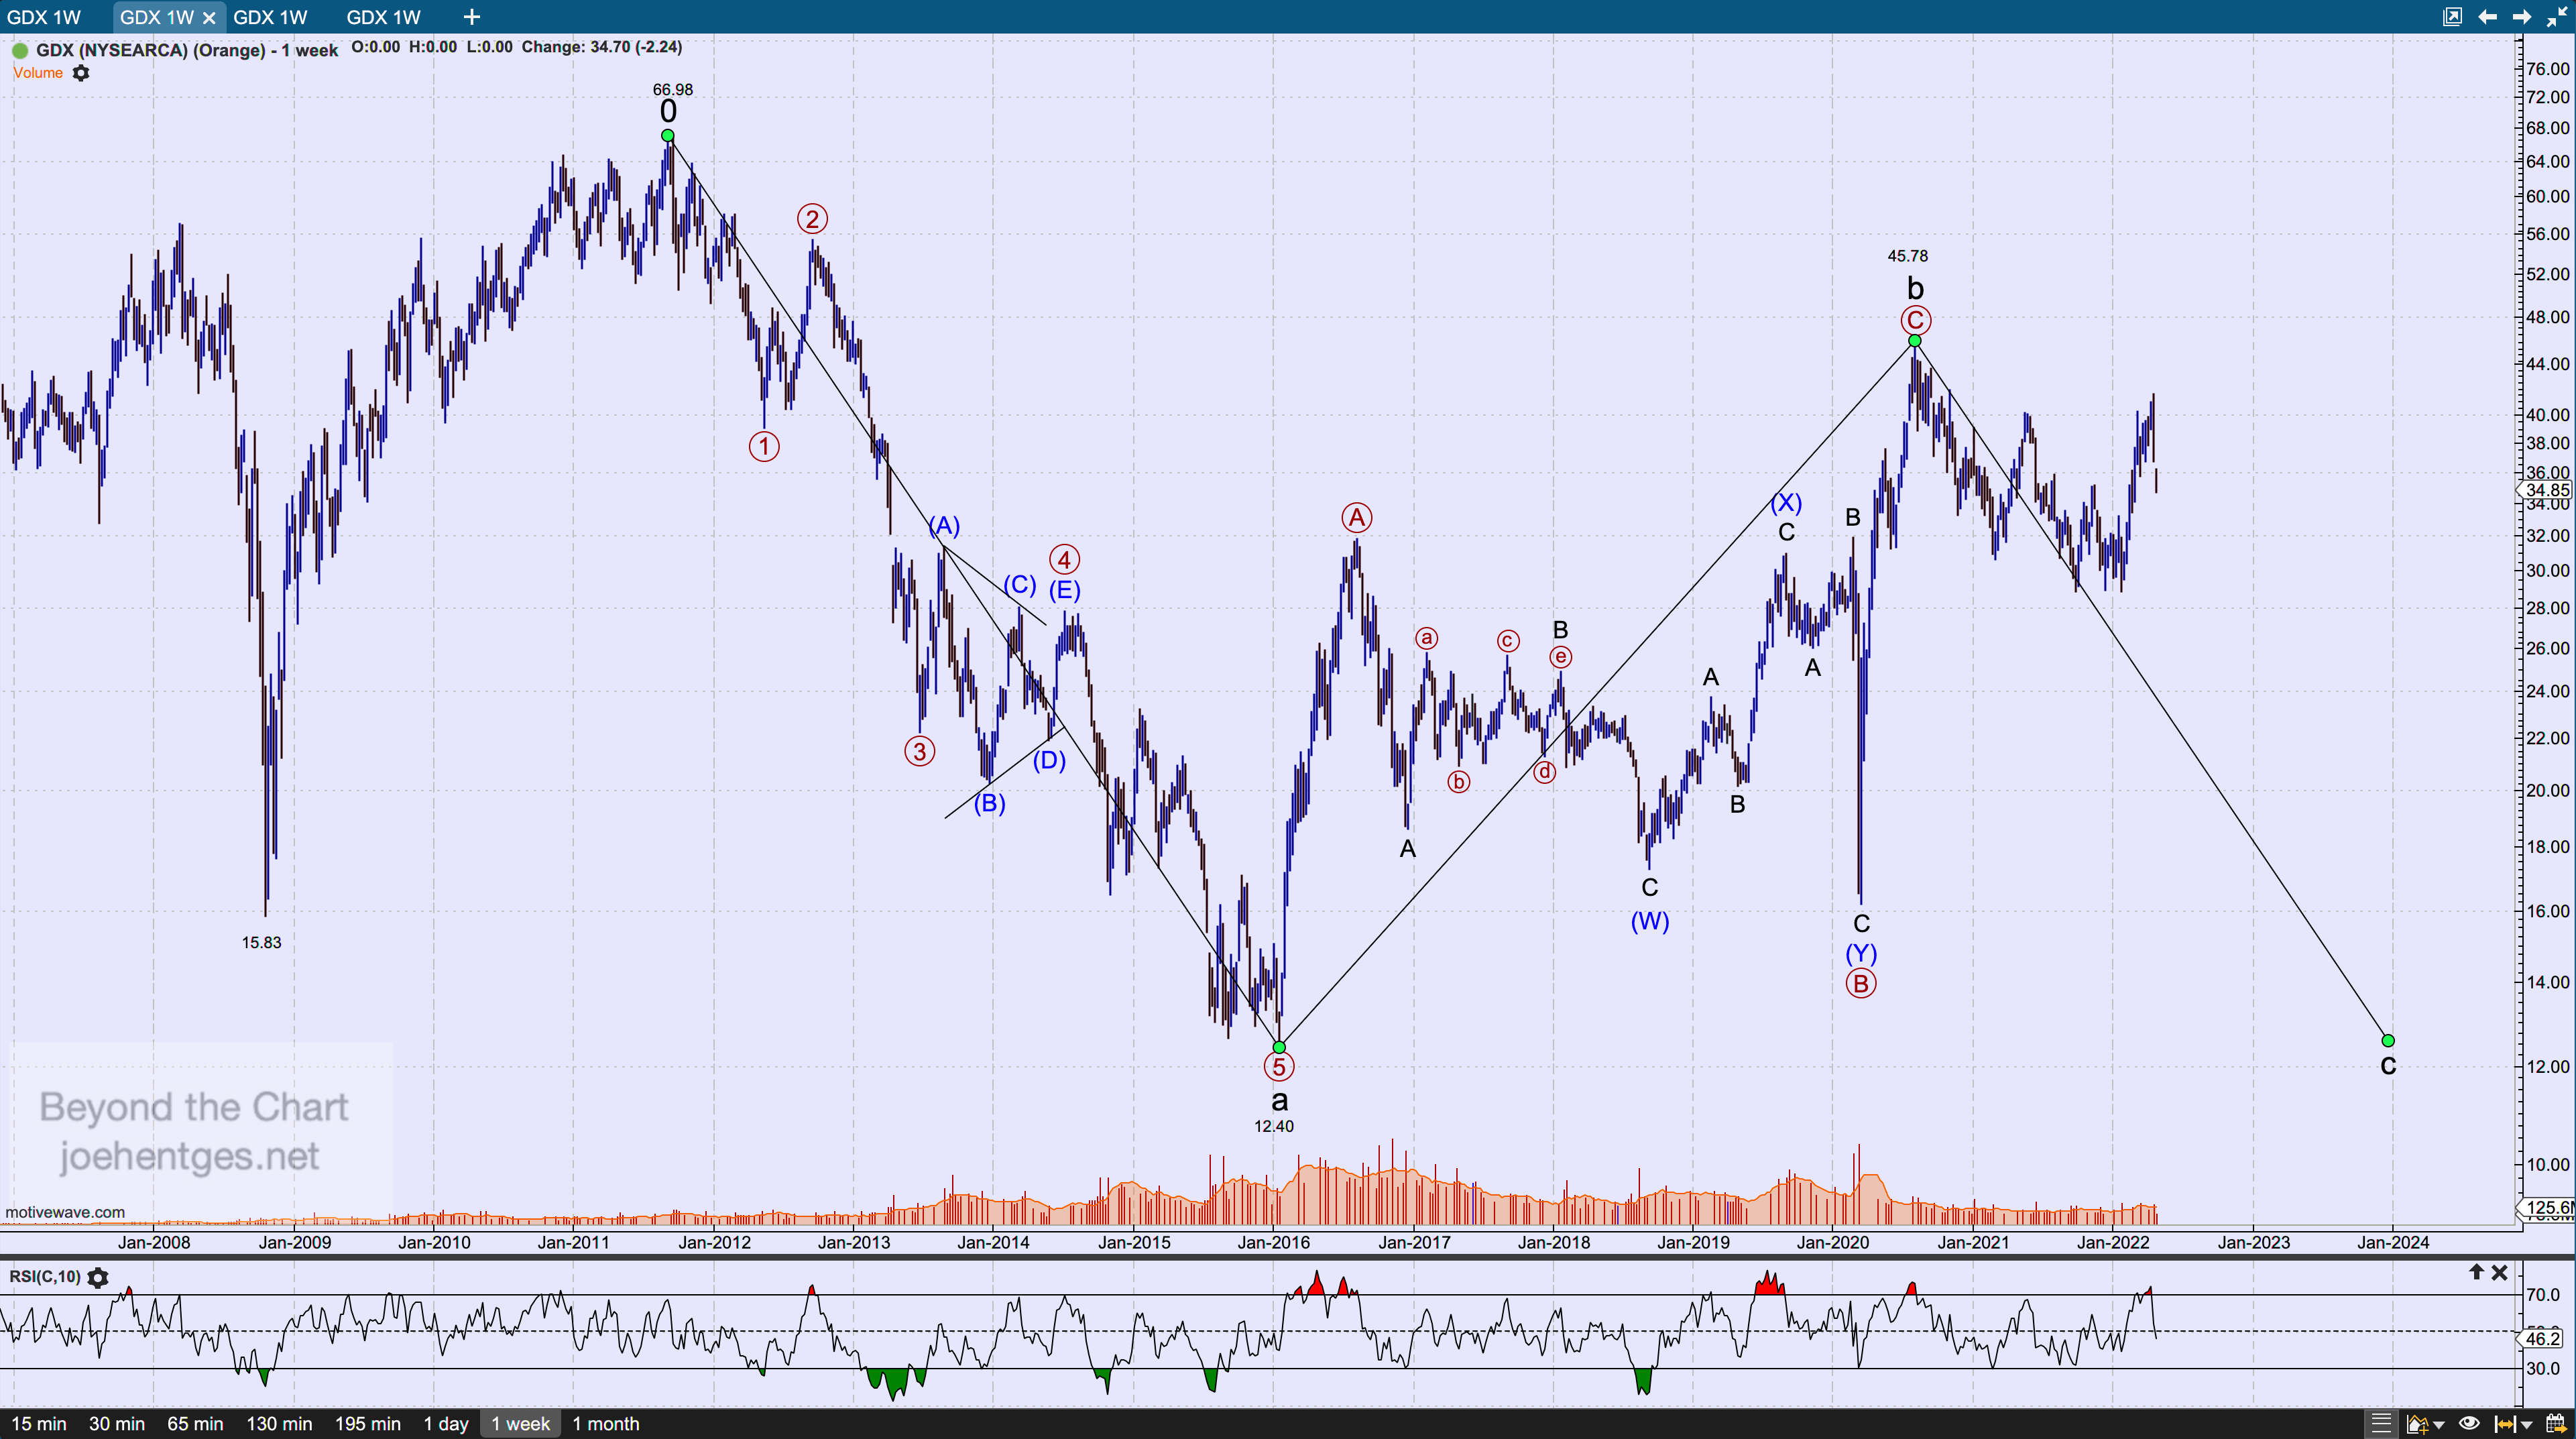
The gold miners are not in sync with gold and in fact have been a lot weaker, not confirming higher moves.  The first chart below is the Gold Miners ETF (GDX) weekly chart.  GDX and GLD were in sync at the high in September 2011 but GDX sold off in a 5 wave "Cycle Wave a" move to a low below that of the 2008 collapse.  The 5 wave move is significant in that it indicates the first leg of a corrective move down.

GDX then moved to a high of 45.78 in "Cycle Wave b" that did not even come close to confirming GLD’s push to a new high in 2020. So now GDX is in "Cycle Wave c” subdividing lower.

Data thru April 27

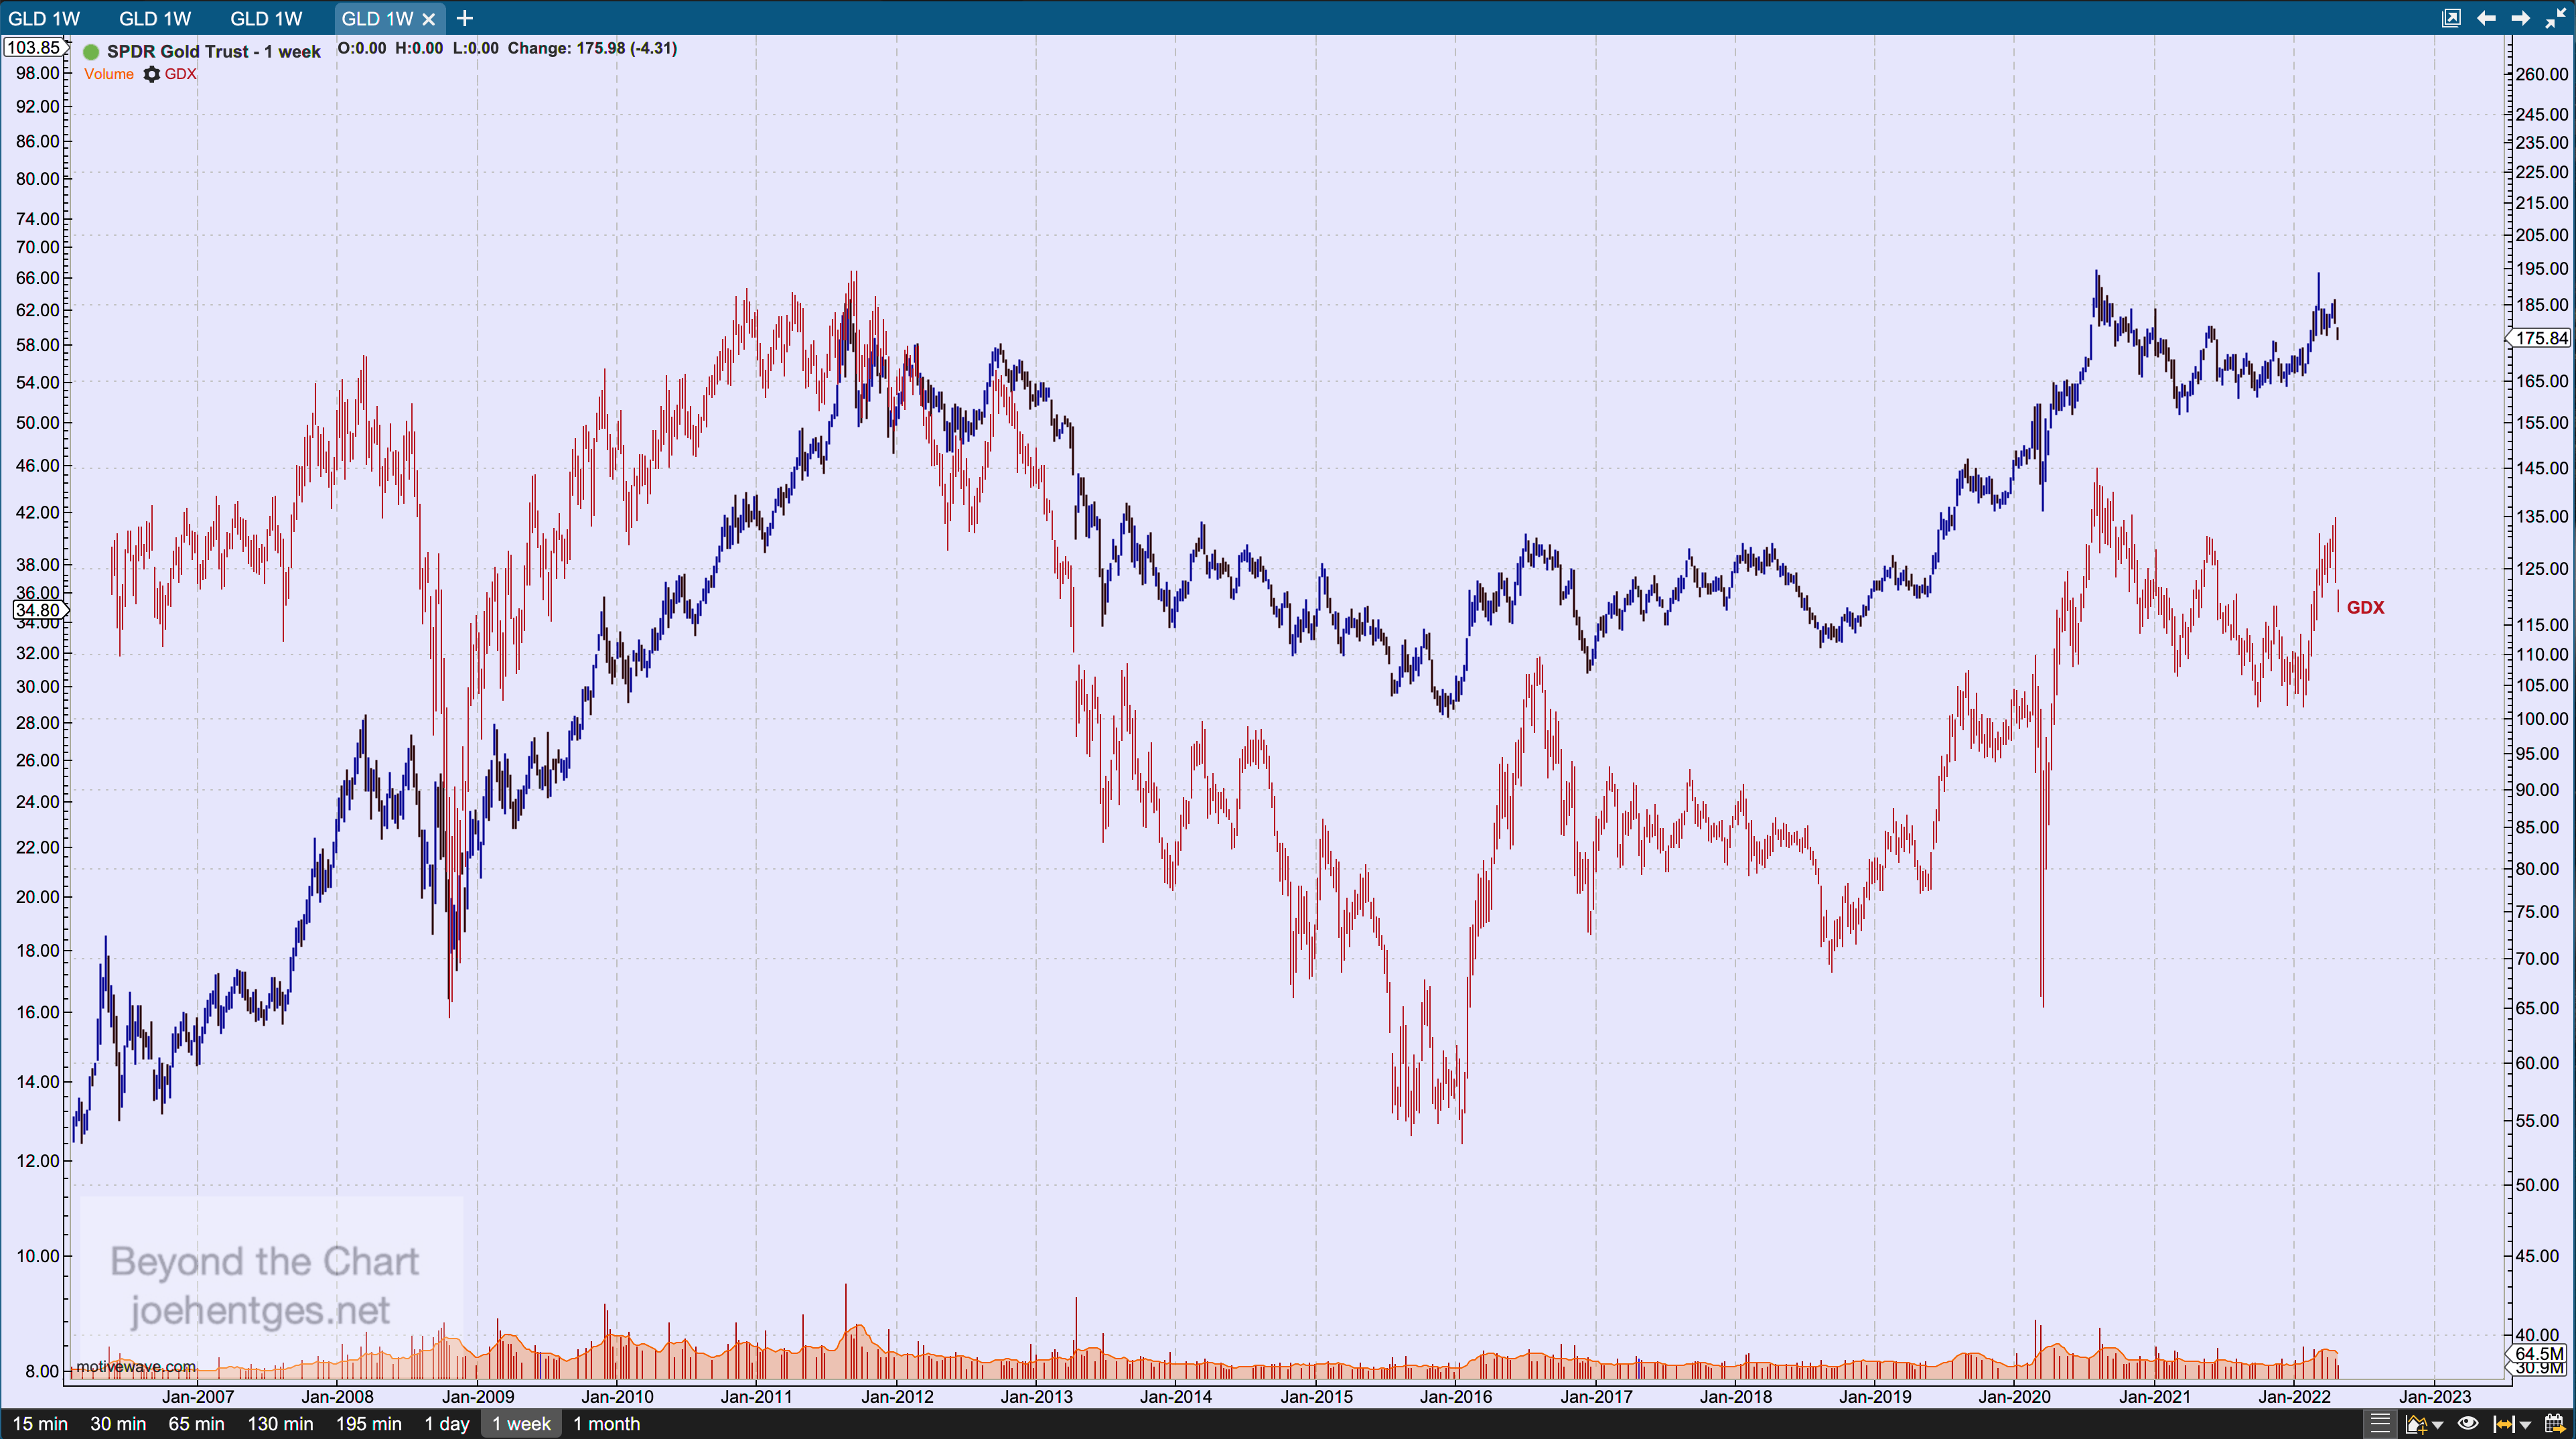
For comparison purposes the next chart shows GDX overlayed on top of GLD.  GLD in blue with its scale on the right.

Data thru April 27

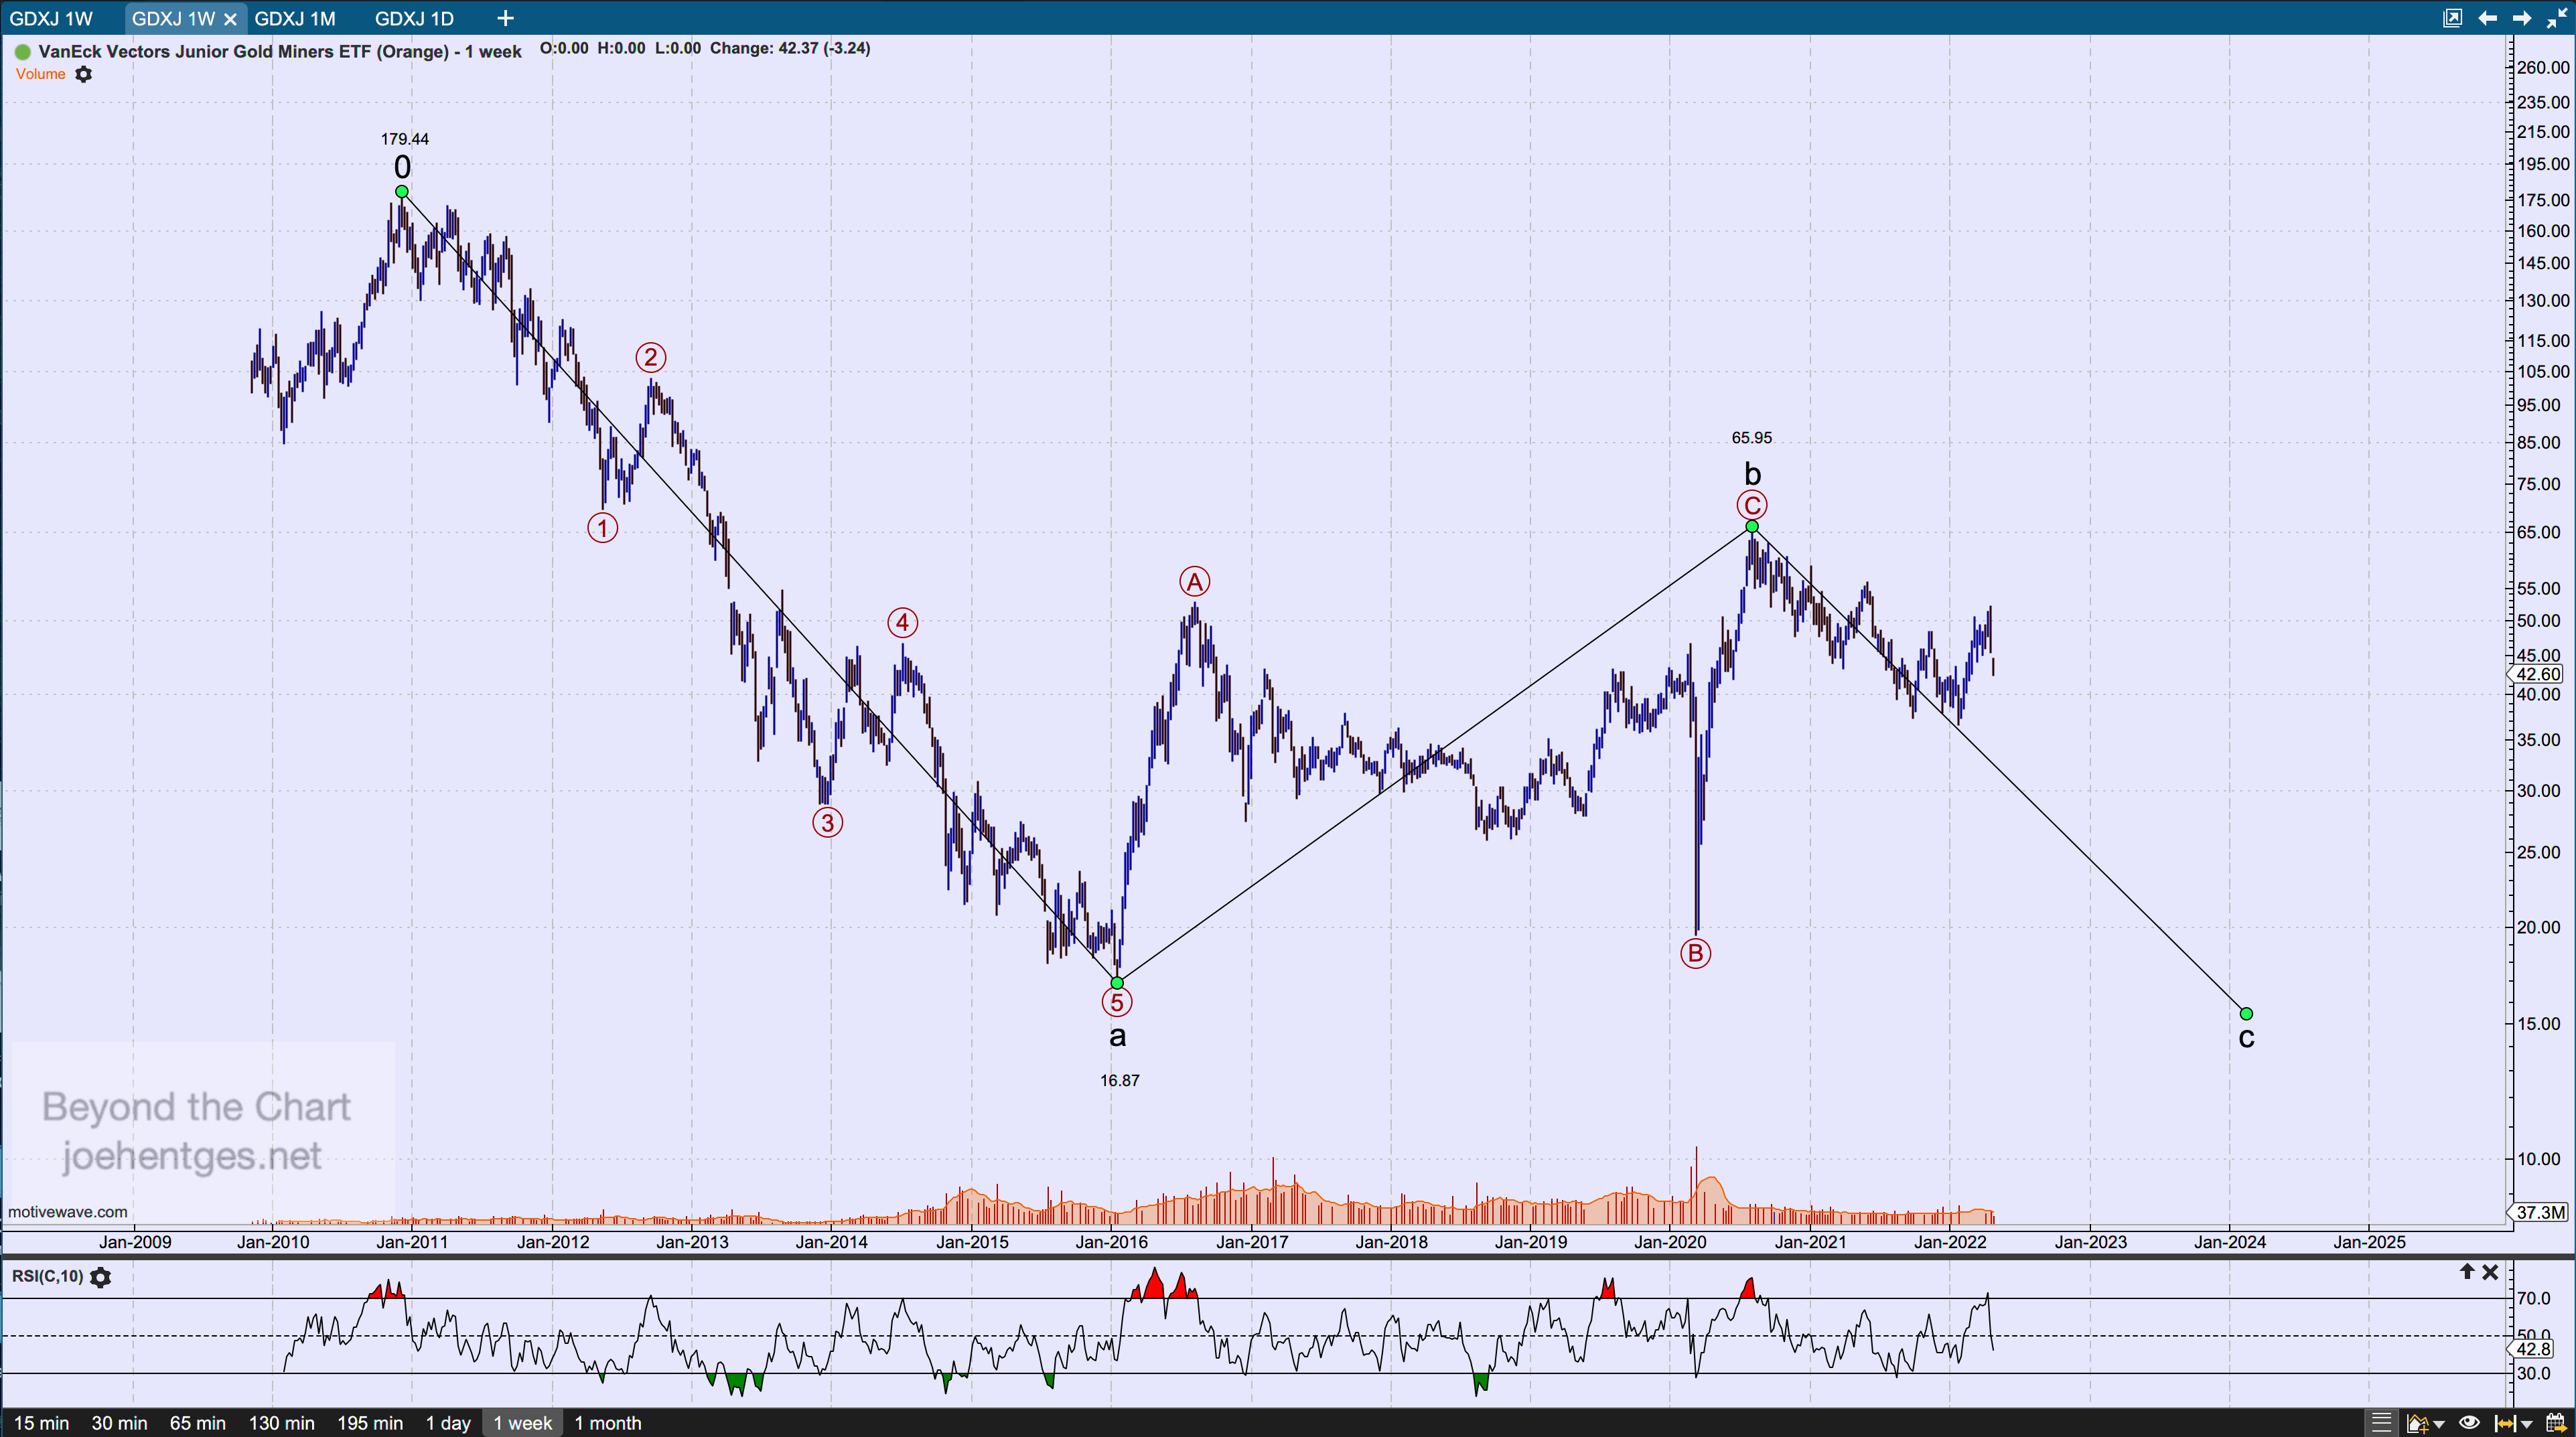
Not to be left out are junior gold miners. The Junior Gold Minors ETF (GDXJ) is shown in the next chart. It mirrors the GDX price action but is weaker. The 2020 high was only 37% of the December 2010 high. More recently the 2022 high did not even exceed the May 2021 high. GDXJ is now moving lower in "Cycle wave c". 

Data thru April 27

Big Tech About to Reverse

The Nasdaq Composite Index (Nasdaq) has been getting hit hard lately but hasn’t dropped as much as the Dow Jones Industrial Average (INDU) or the Russell 2000 Index (RUT).  One indication of the damage going on is the net 52 week High – Low indicator which on Friday December 3rd hit -713. 

It seems the Nasdaq and S&P 500 Index (SPX)are being held up by just a few stocks. And you know which ones these are. They are the FAANG+ stocks of Facebook, Amazon, Apple, Netflix, Alphabet (GOOGL) plus Microsoft, Nvidia and a few others.

This post focuses on the SPDR Technology ETF (XLK) and its top three holdings which make up 51.5% of all the holdings. These are Apple (AAPL), Microsoft (MSFT) and Nvidia (NVDA).  When these big tech names roll over and start to break down they will take the XLK, Nasdaq and the SPX a lot lower.

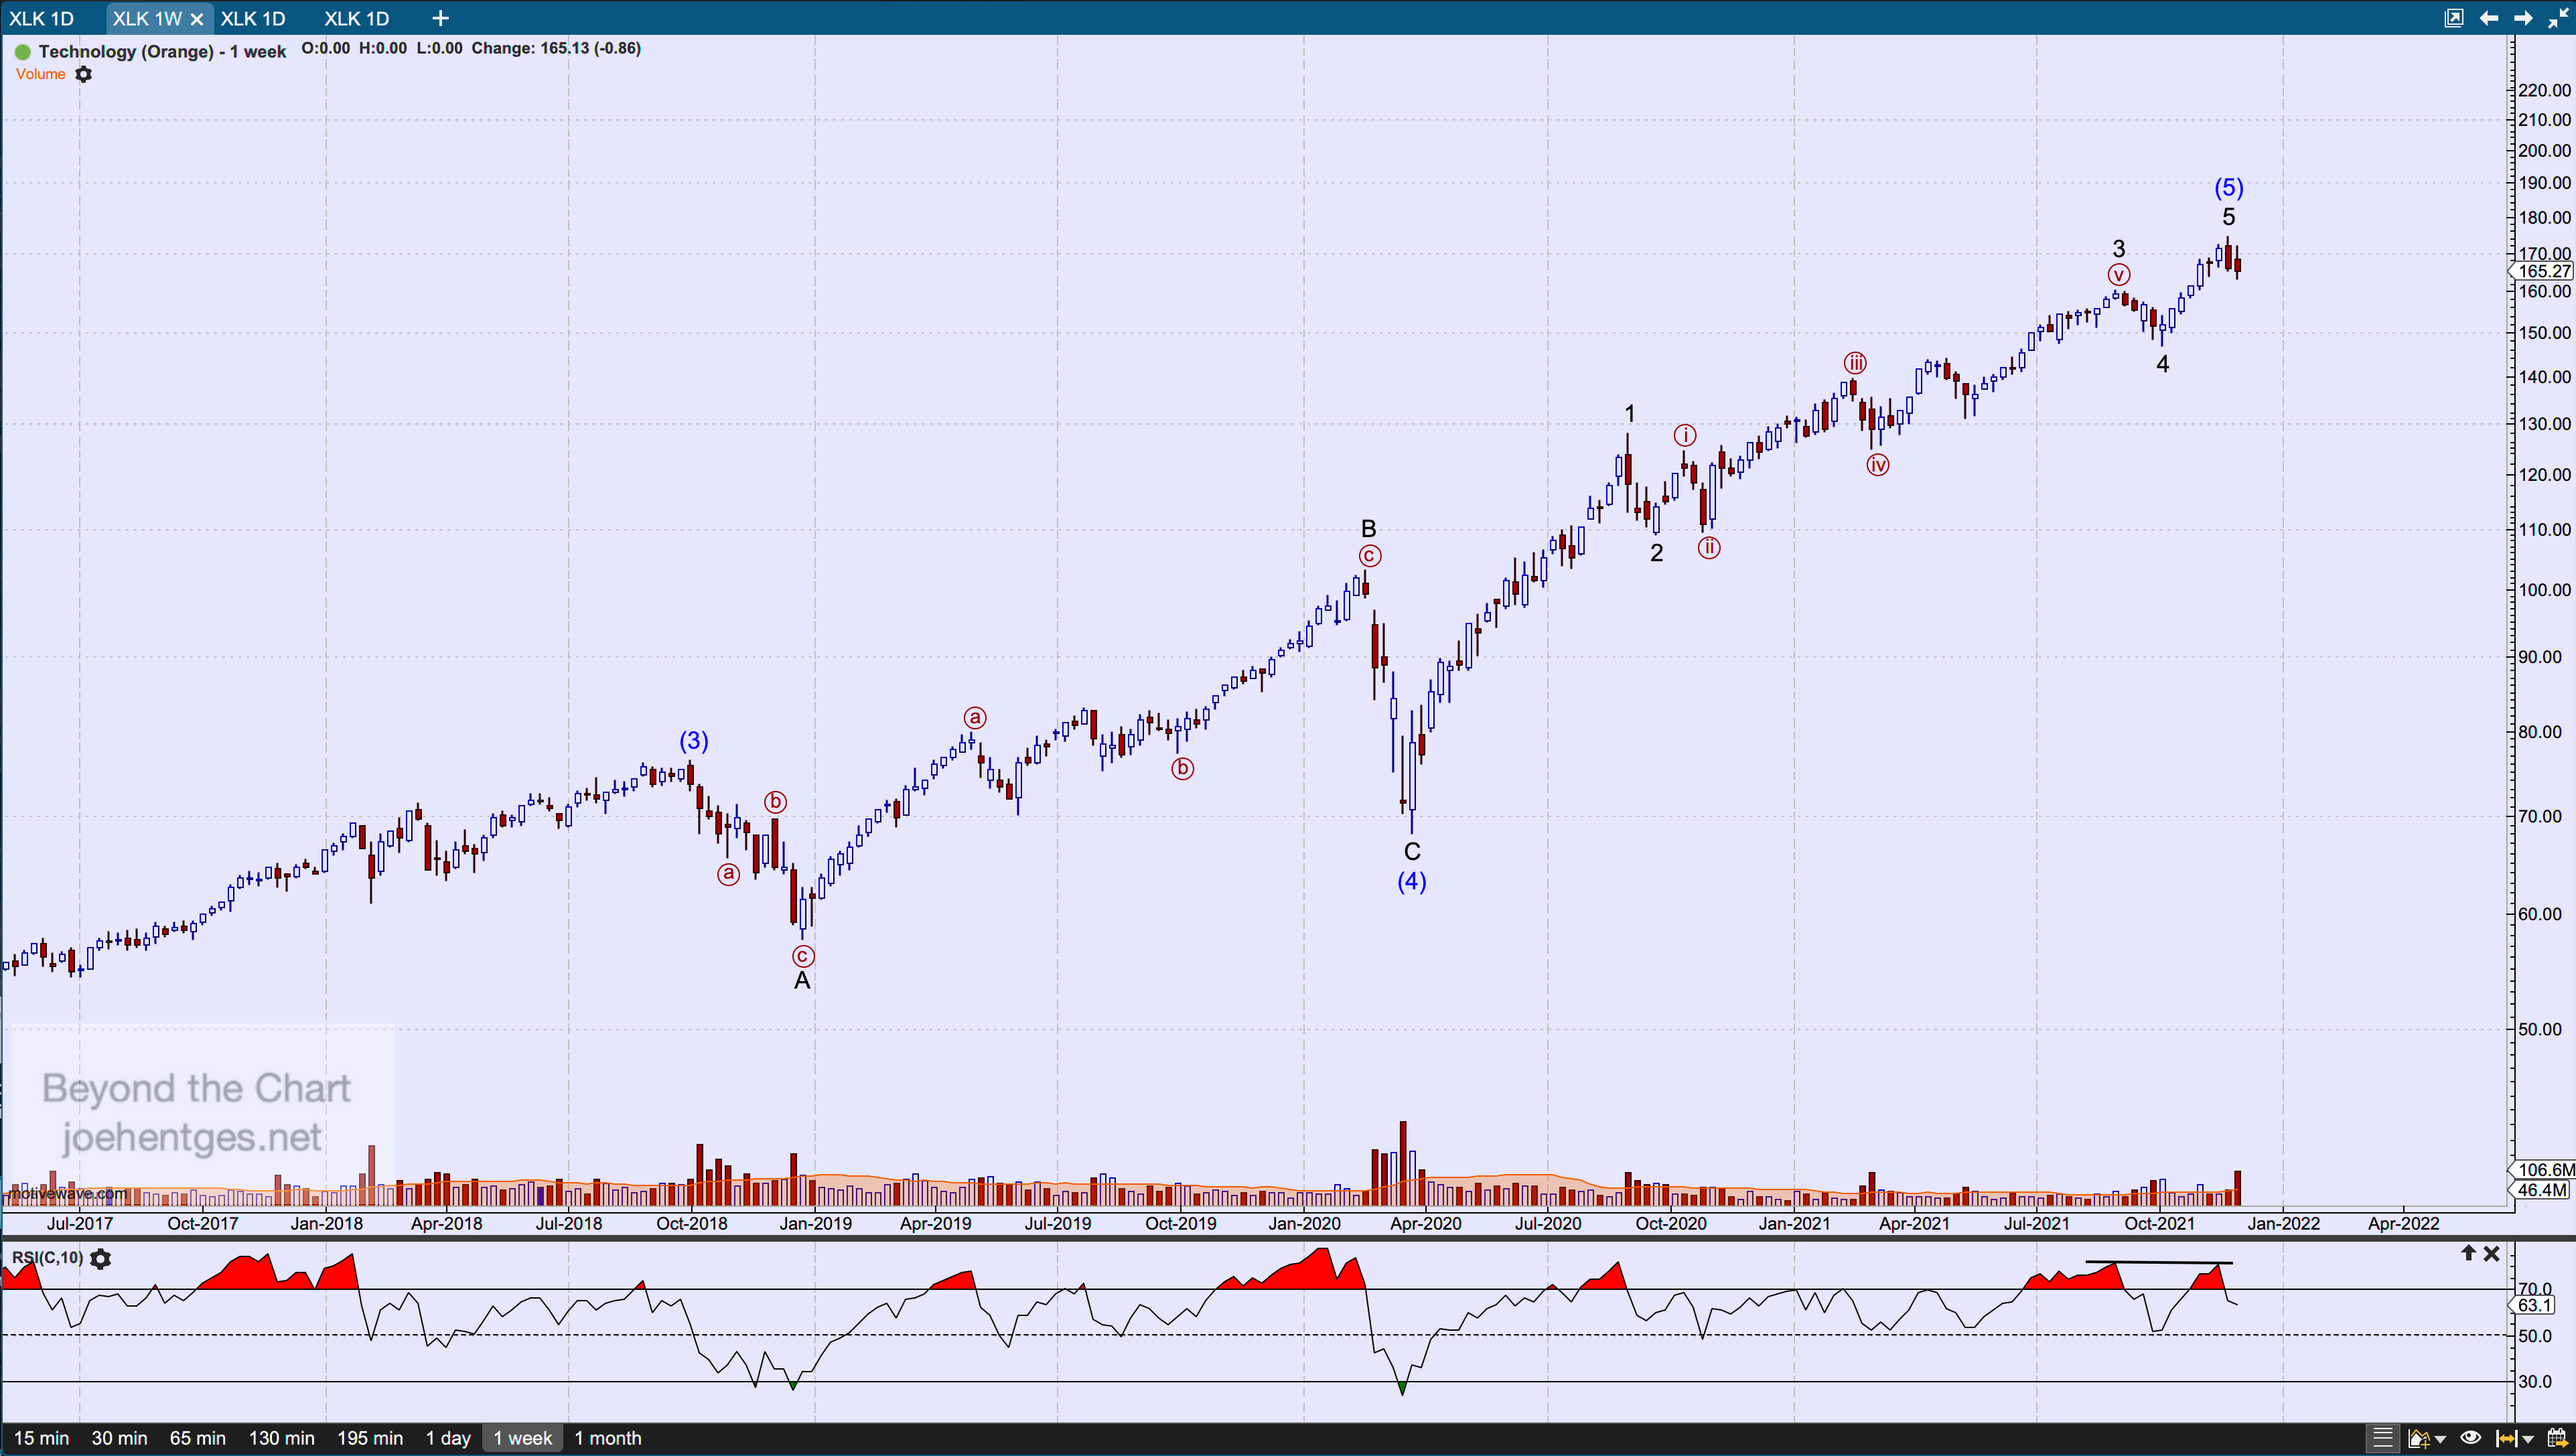
First let’s start with the XLK. Below you see a weekly chart. The Elliott Wave count shows a Running Flat Wave (4) that ended with a low the week of March 22, 2020. From that low there are 5 waves up complete with the high during the week of November 21. That high is 174.25. For this count to hold that high should not be broken.  Next up is AAPL.

Data thru December 3, 2021

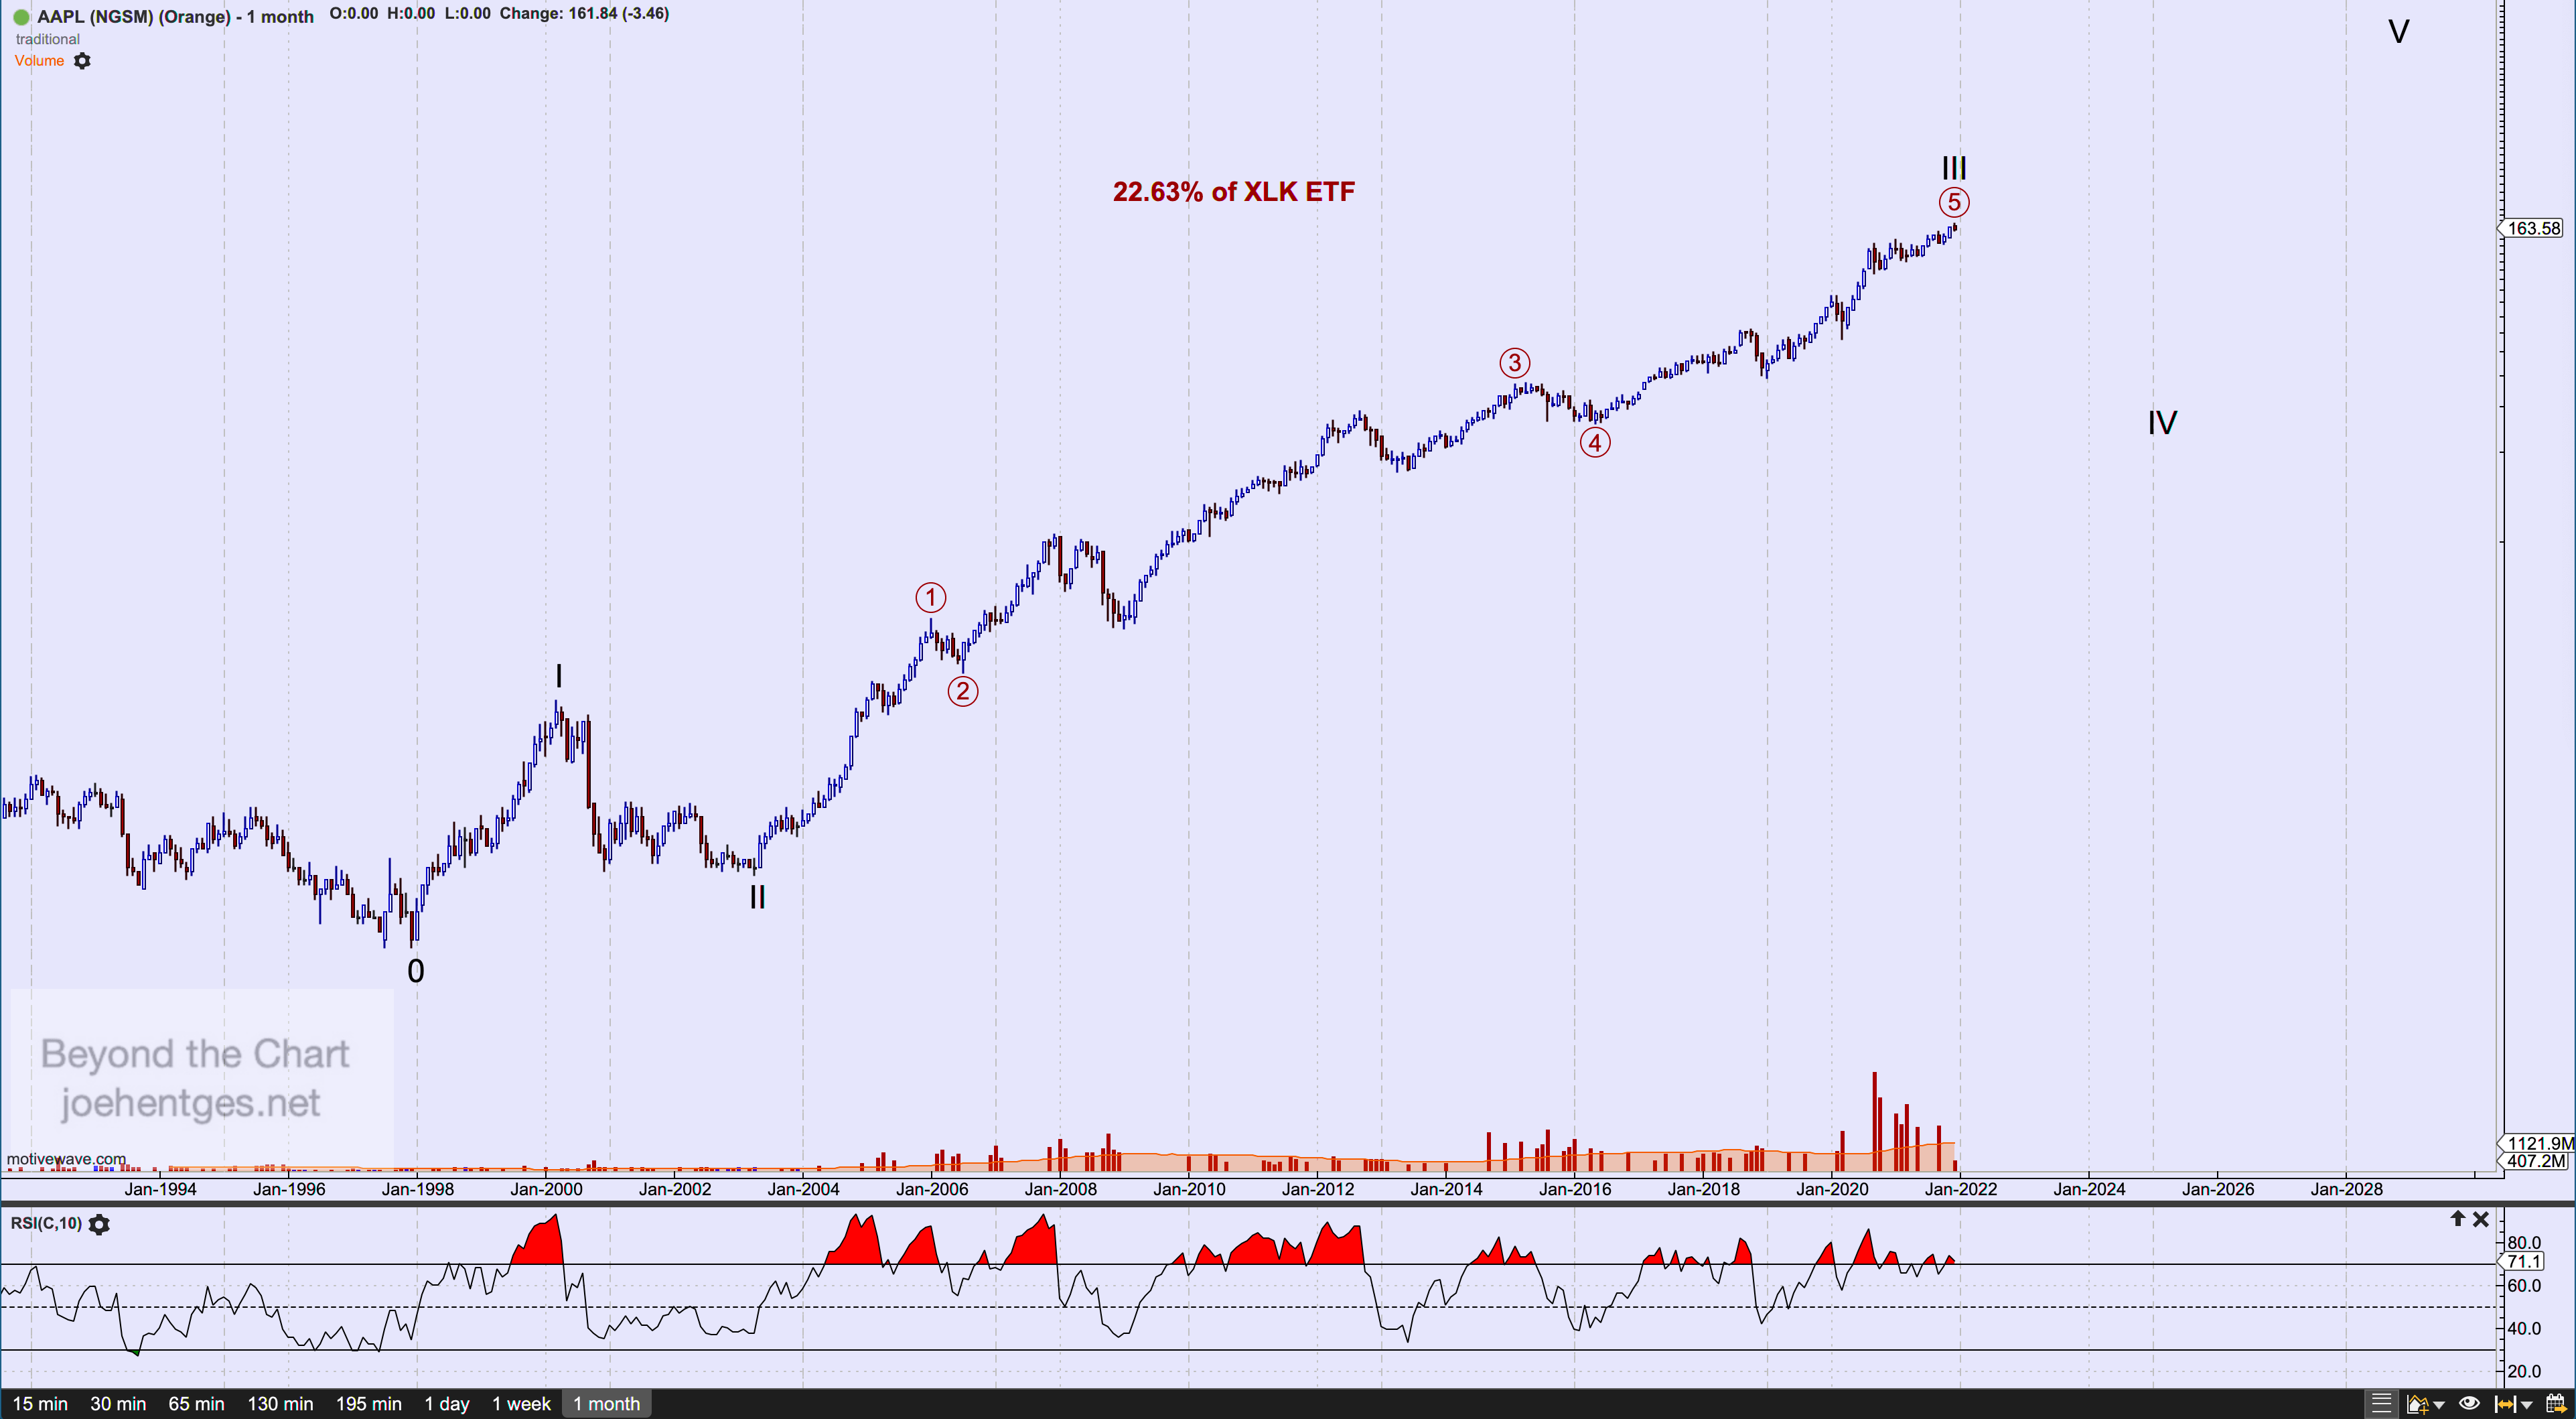
The chart below is the long-term monthly chart of AAPL This is not all the data for AAPL as it first went public on December 12, 1980. The Elliott Wave count I show starts with the 1997 low which occurred in both July and December of that year. 1997 was when Steve Jobs returned to Apple. I show that AAPL just completed a huge Cycle Wave III up from the Wave II low in April 2003.

Data thru December 3, 2021

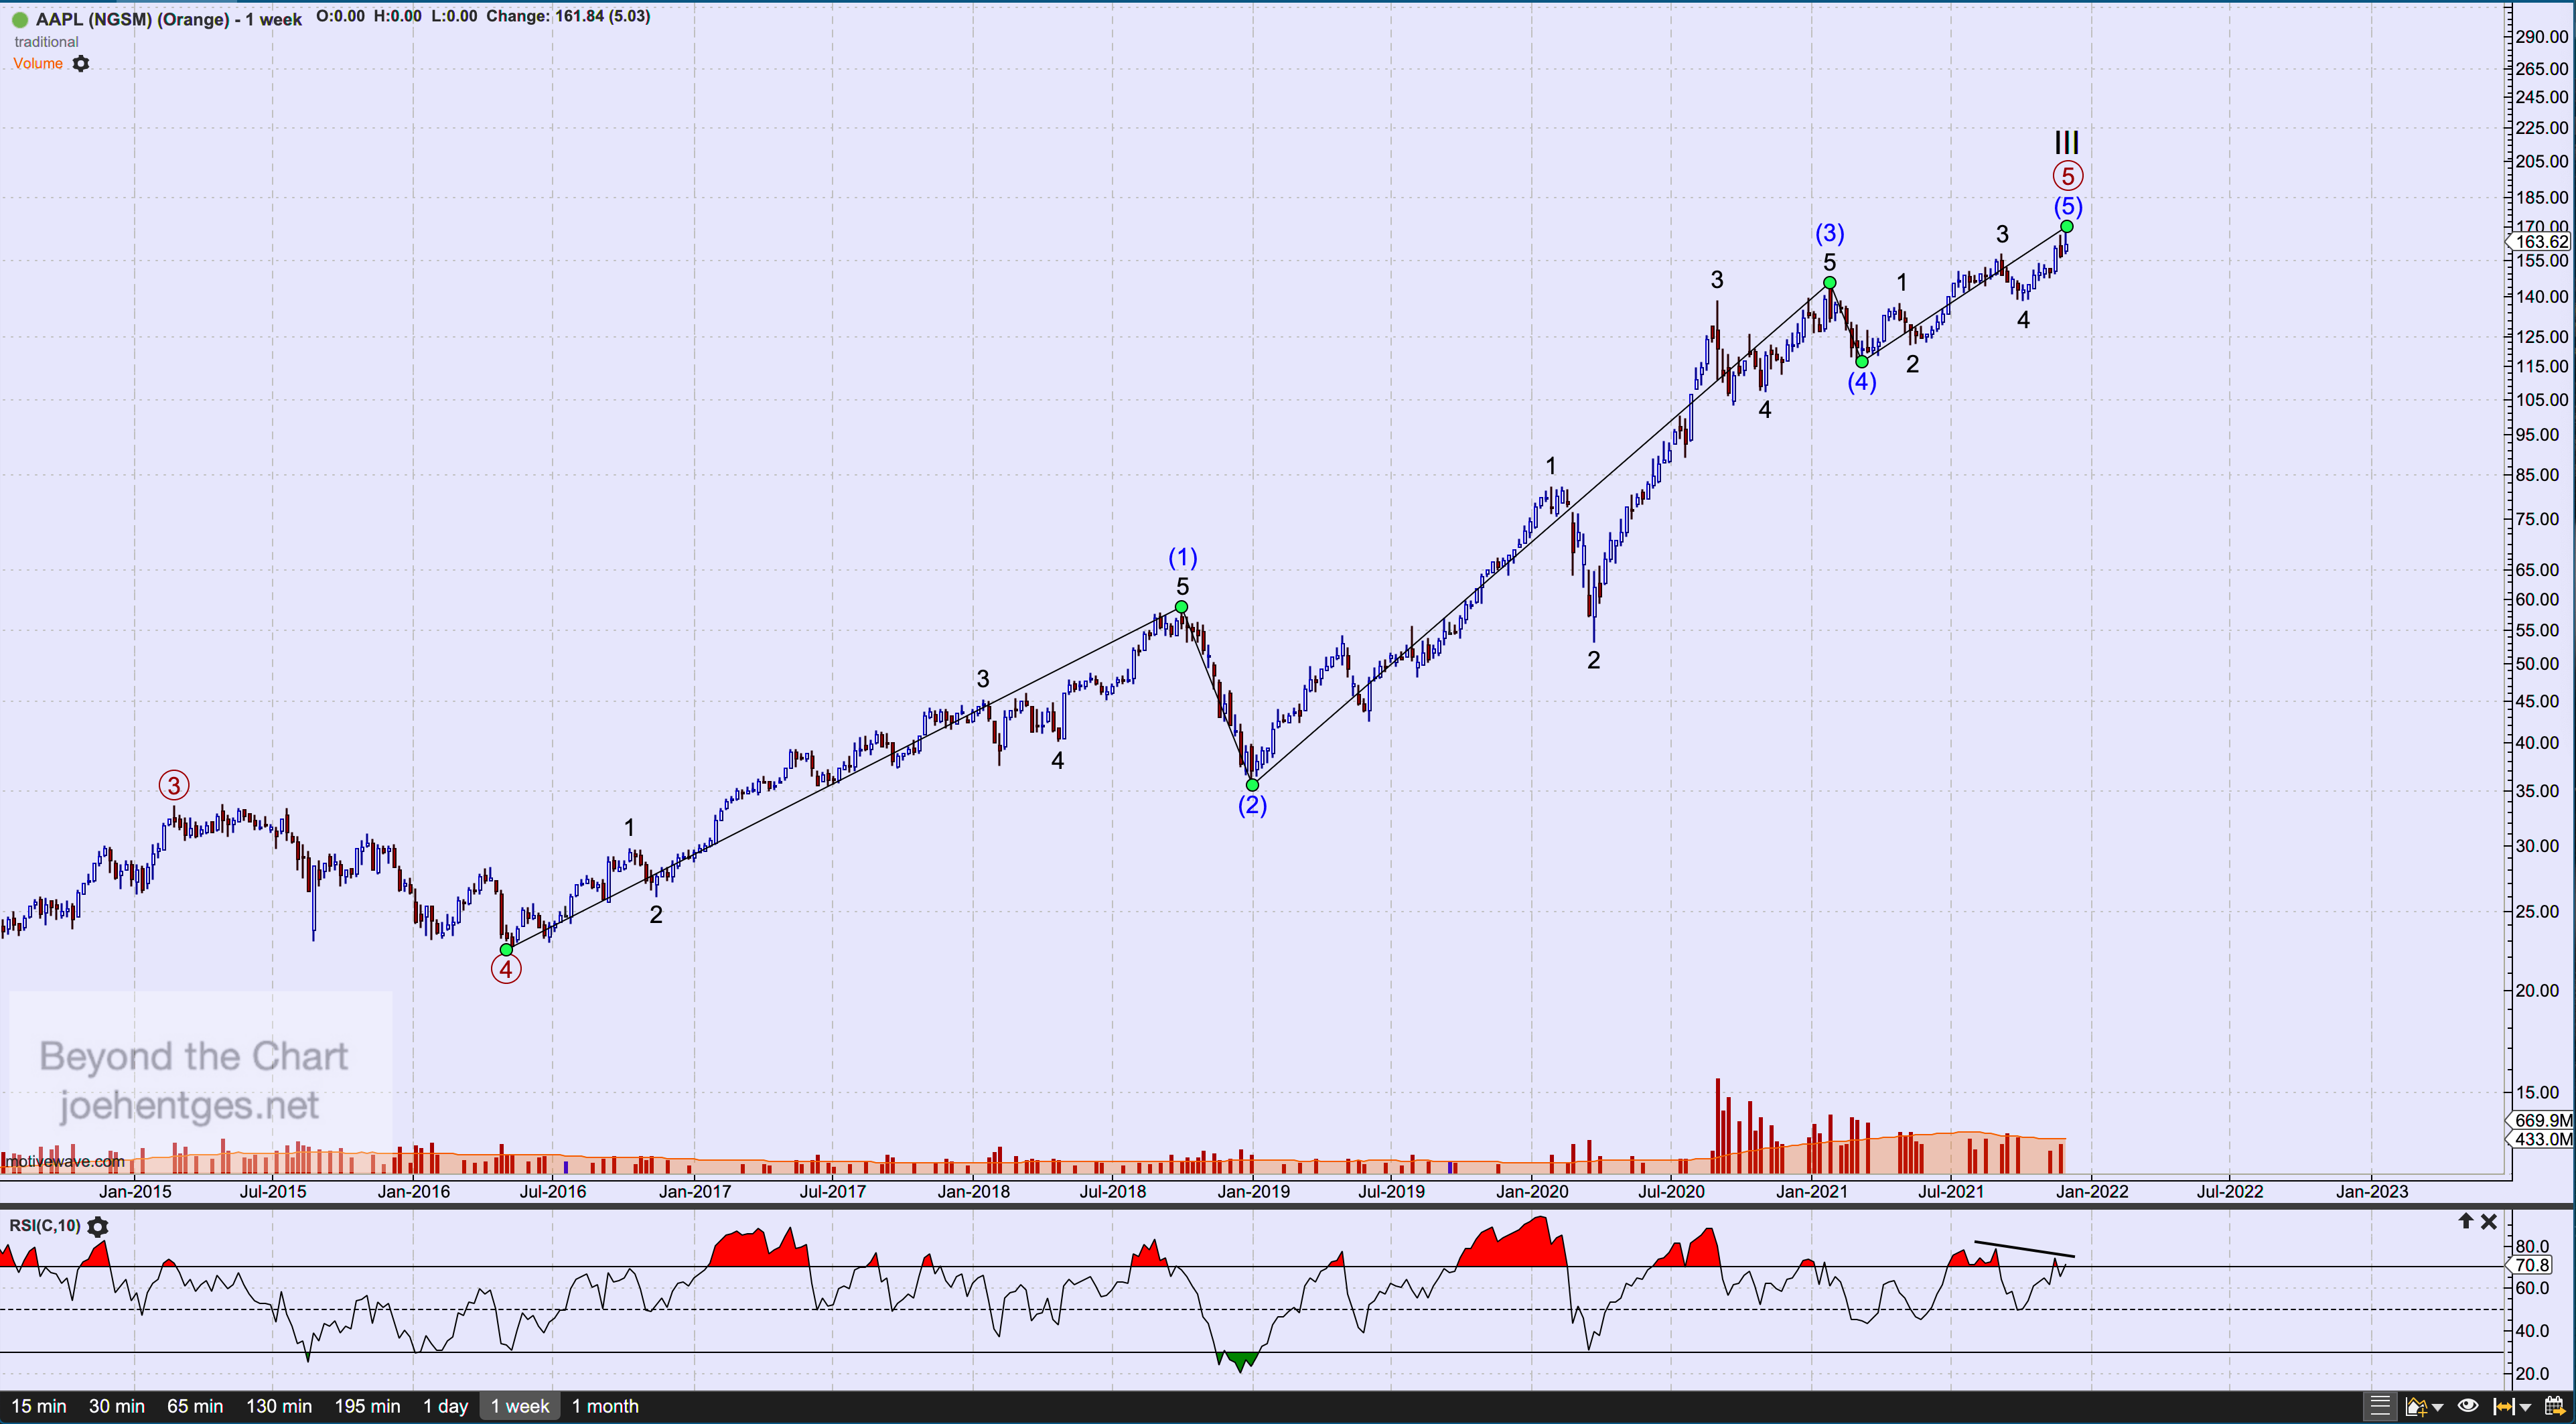
Now let’s look at the weekly chart. In the weekly chart below I show the five intermediate waves up from the 2016 low and the five minor waves that complete Intermediate Wave (5).  I expect the $170.30 high to hold or the 5th wave up is not yet complete. At this point watch closely for a continued break down in price. Now let’s move on to MSFT.

Date thru December 3, 2021

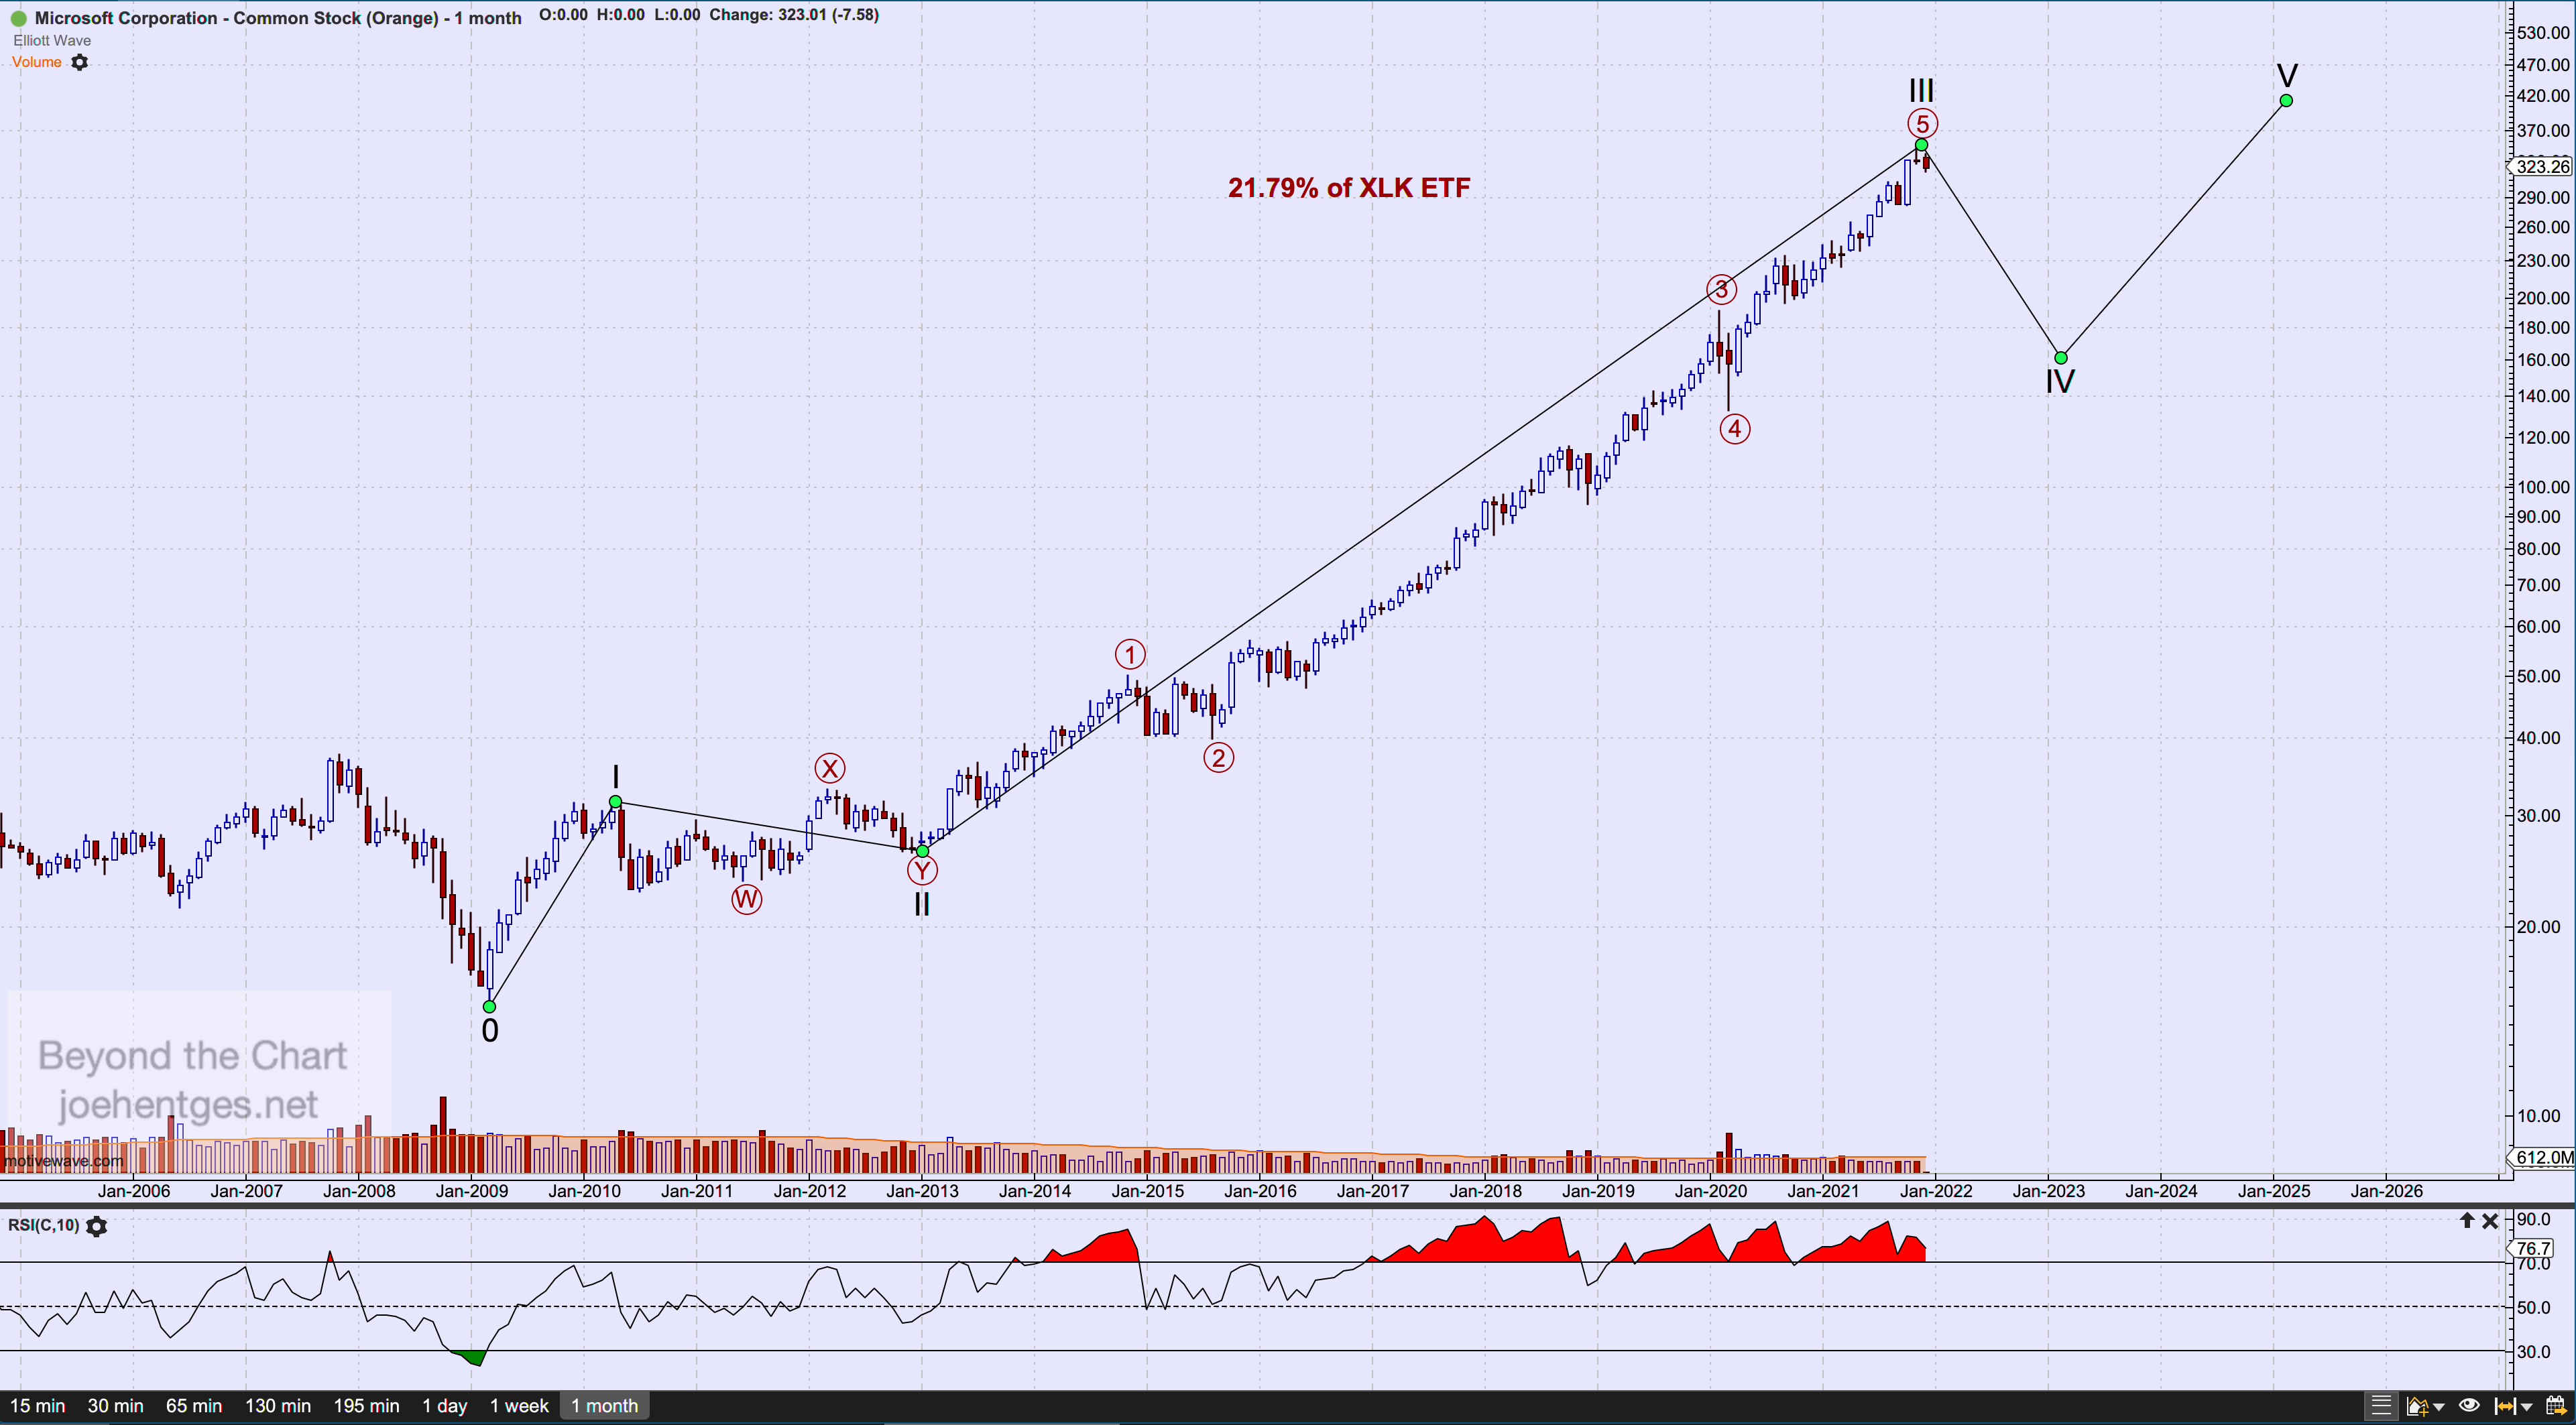
The chart below is the monthly chart of MSFT. I show a wave count from the March 2009 low. Similar to AAPL, MSFT just completed a huge Cycle Wave III ending with the $349.67 high the week of November 21, 2021.  It has now begun its Cycle Wave IV which should take many months to complete and may take a variety of shapes.  I expect this to pull back into the territory of the previous Primary Wave 4 (circled). 

Data thru December 3, 2021

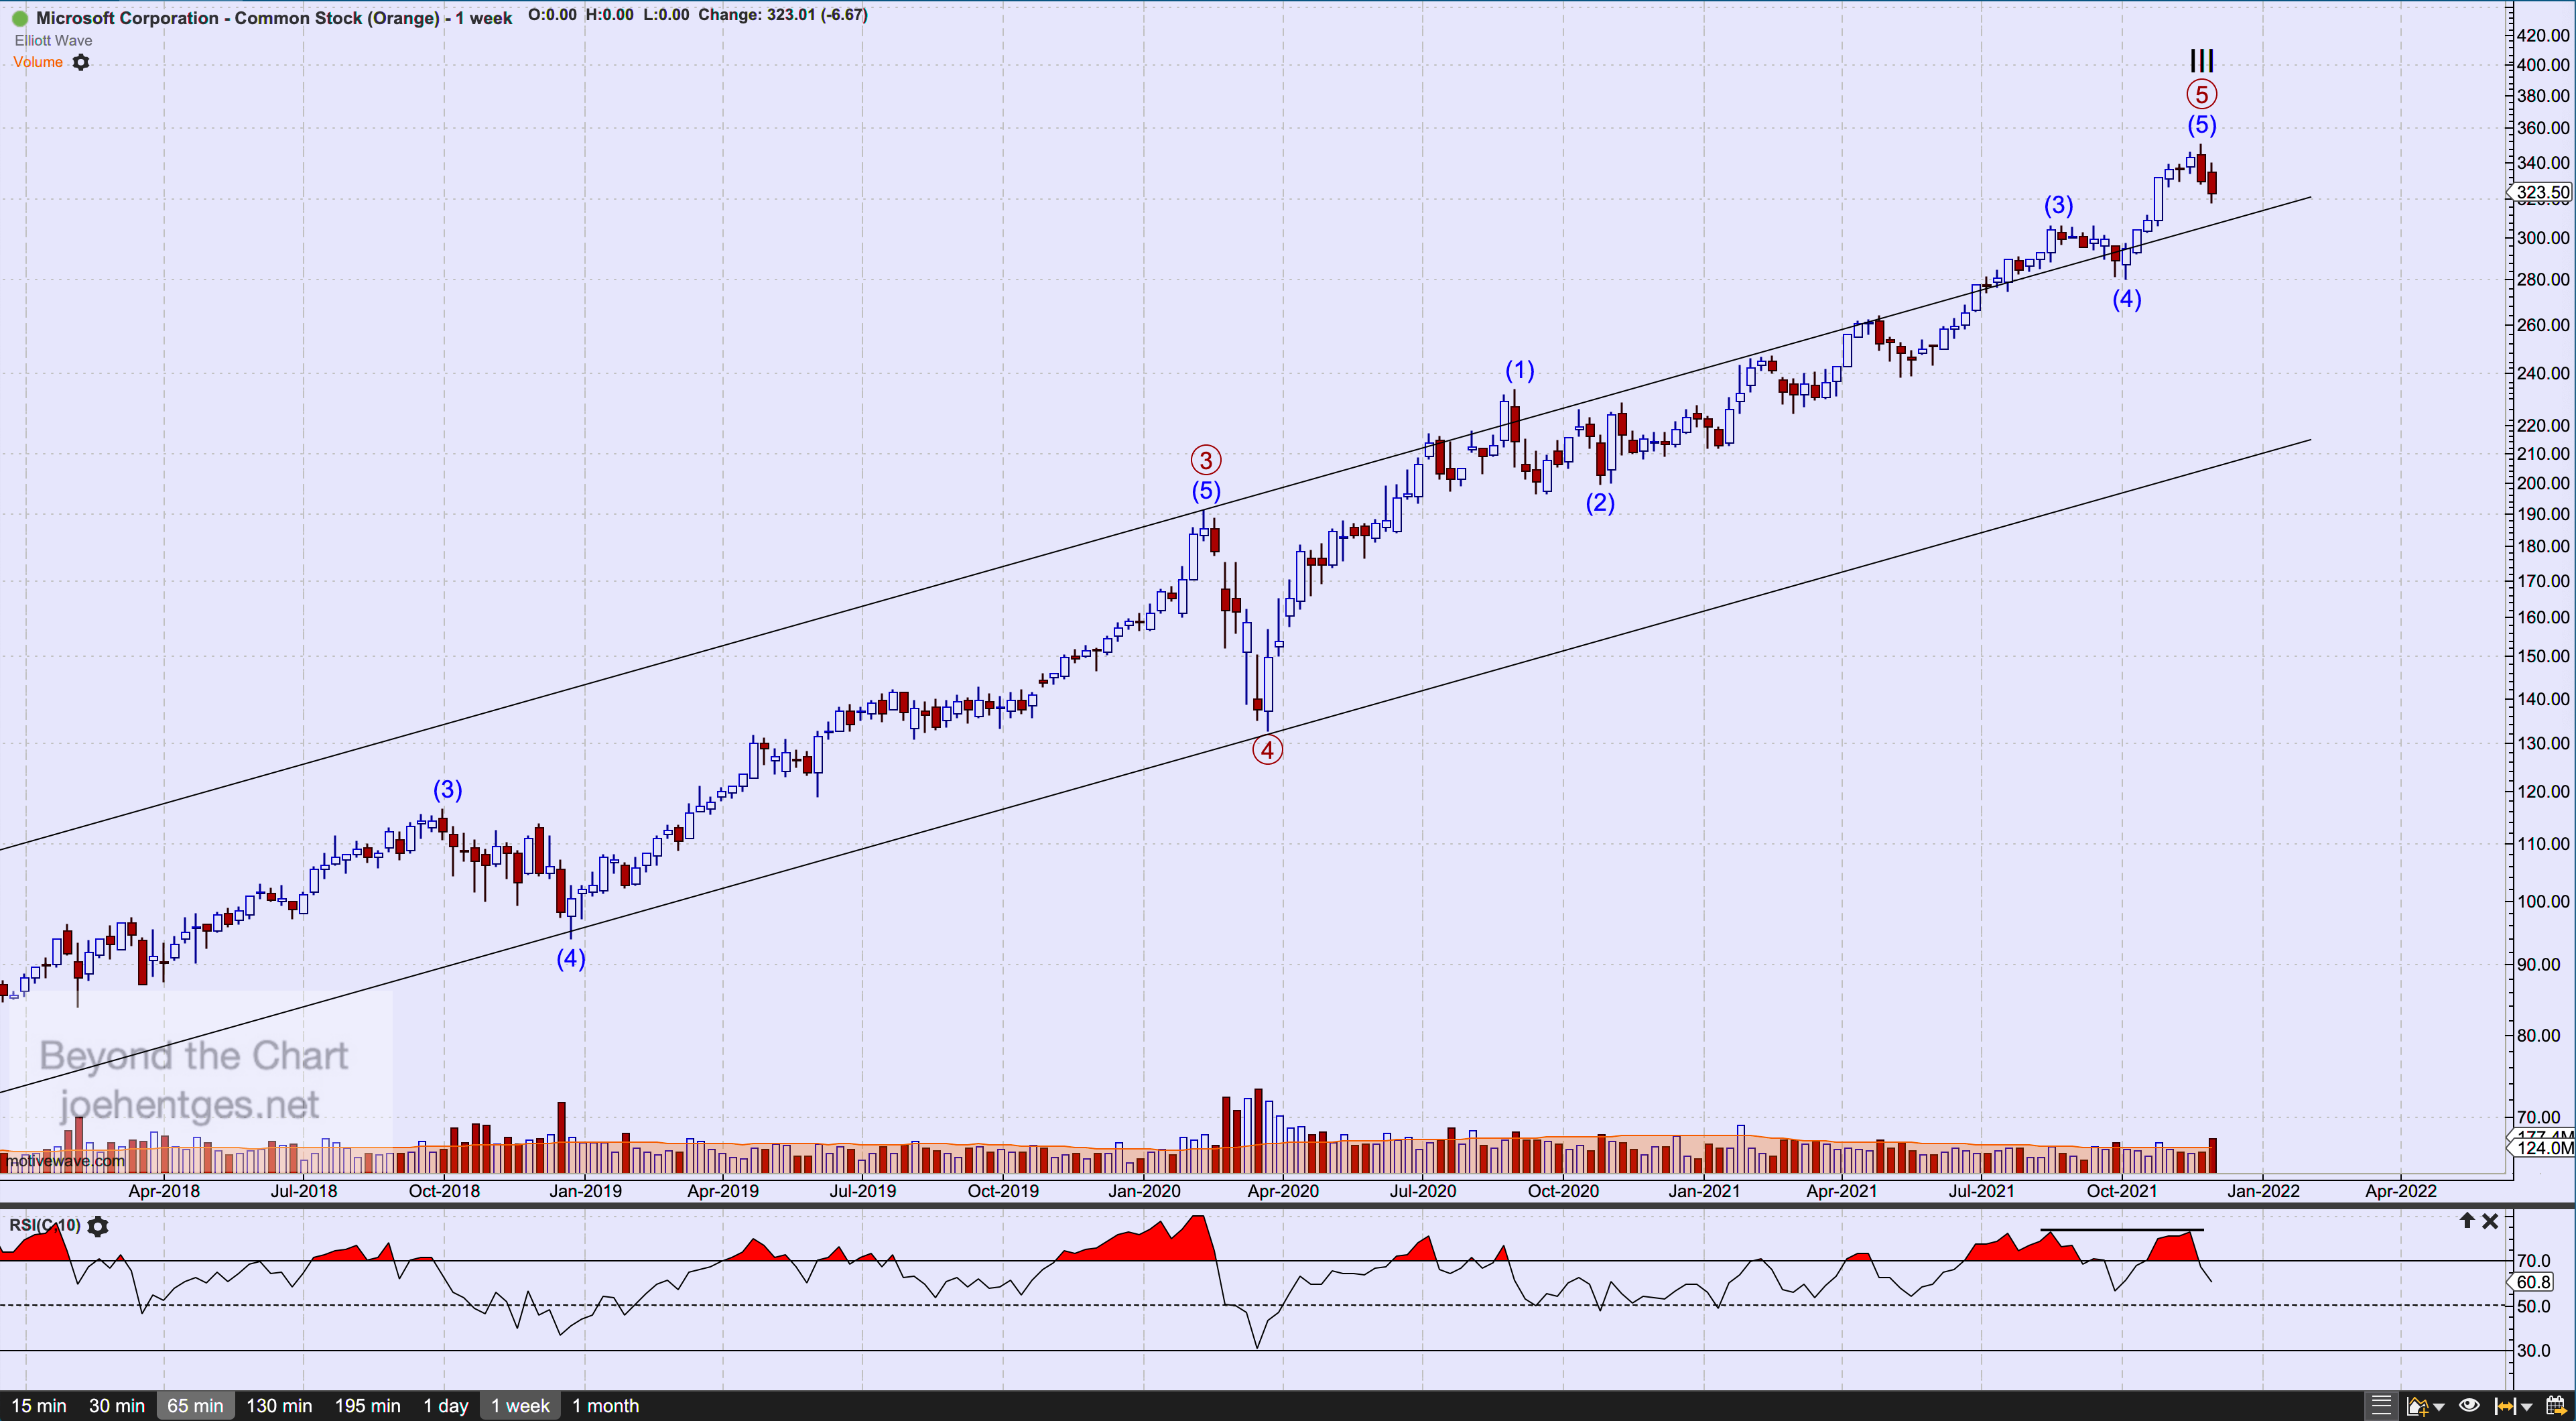
The weekly chart below shows five waves complete from the March 2020 low. Again for this count to hold, the November 22 high needs to hold.  Next target will be a break of the Intermediate Wave (4) low at $280.25.

Data thru December 3, 2021

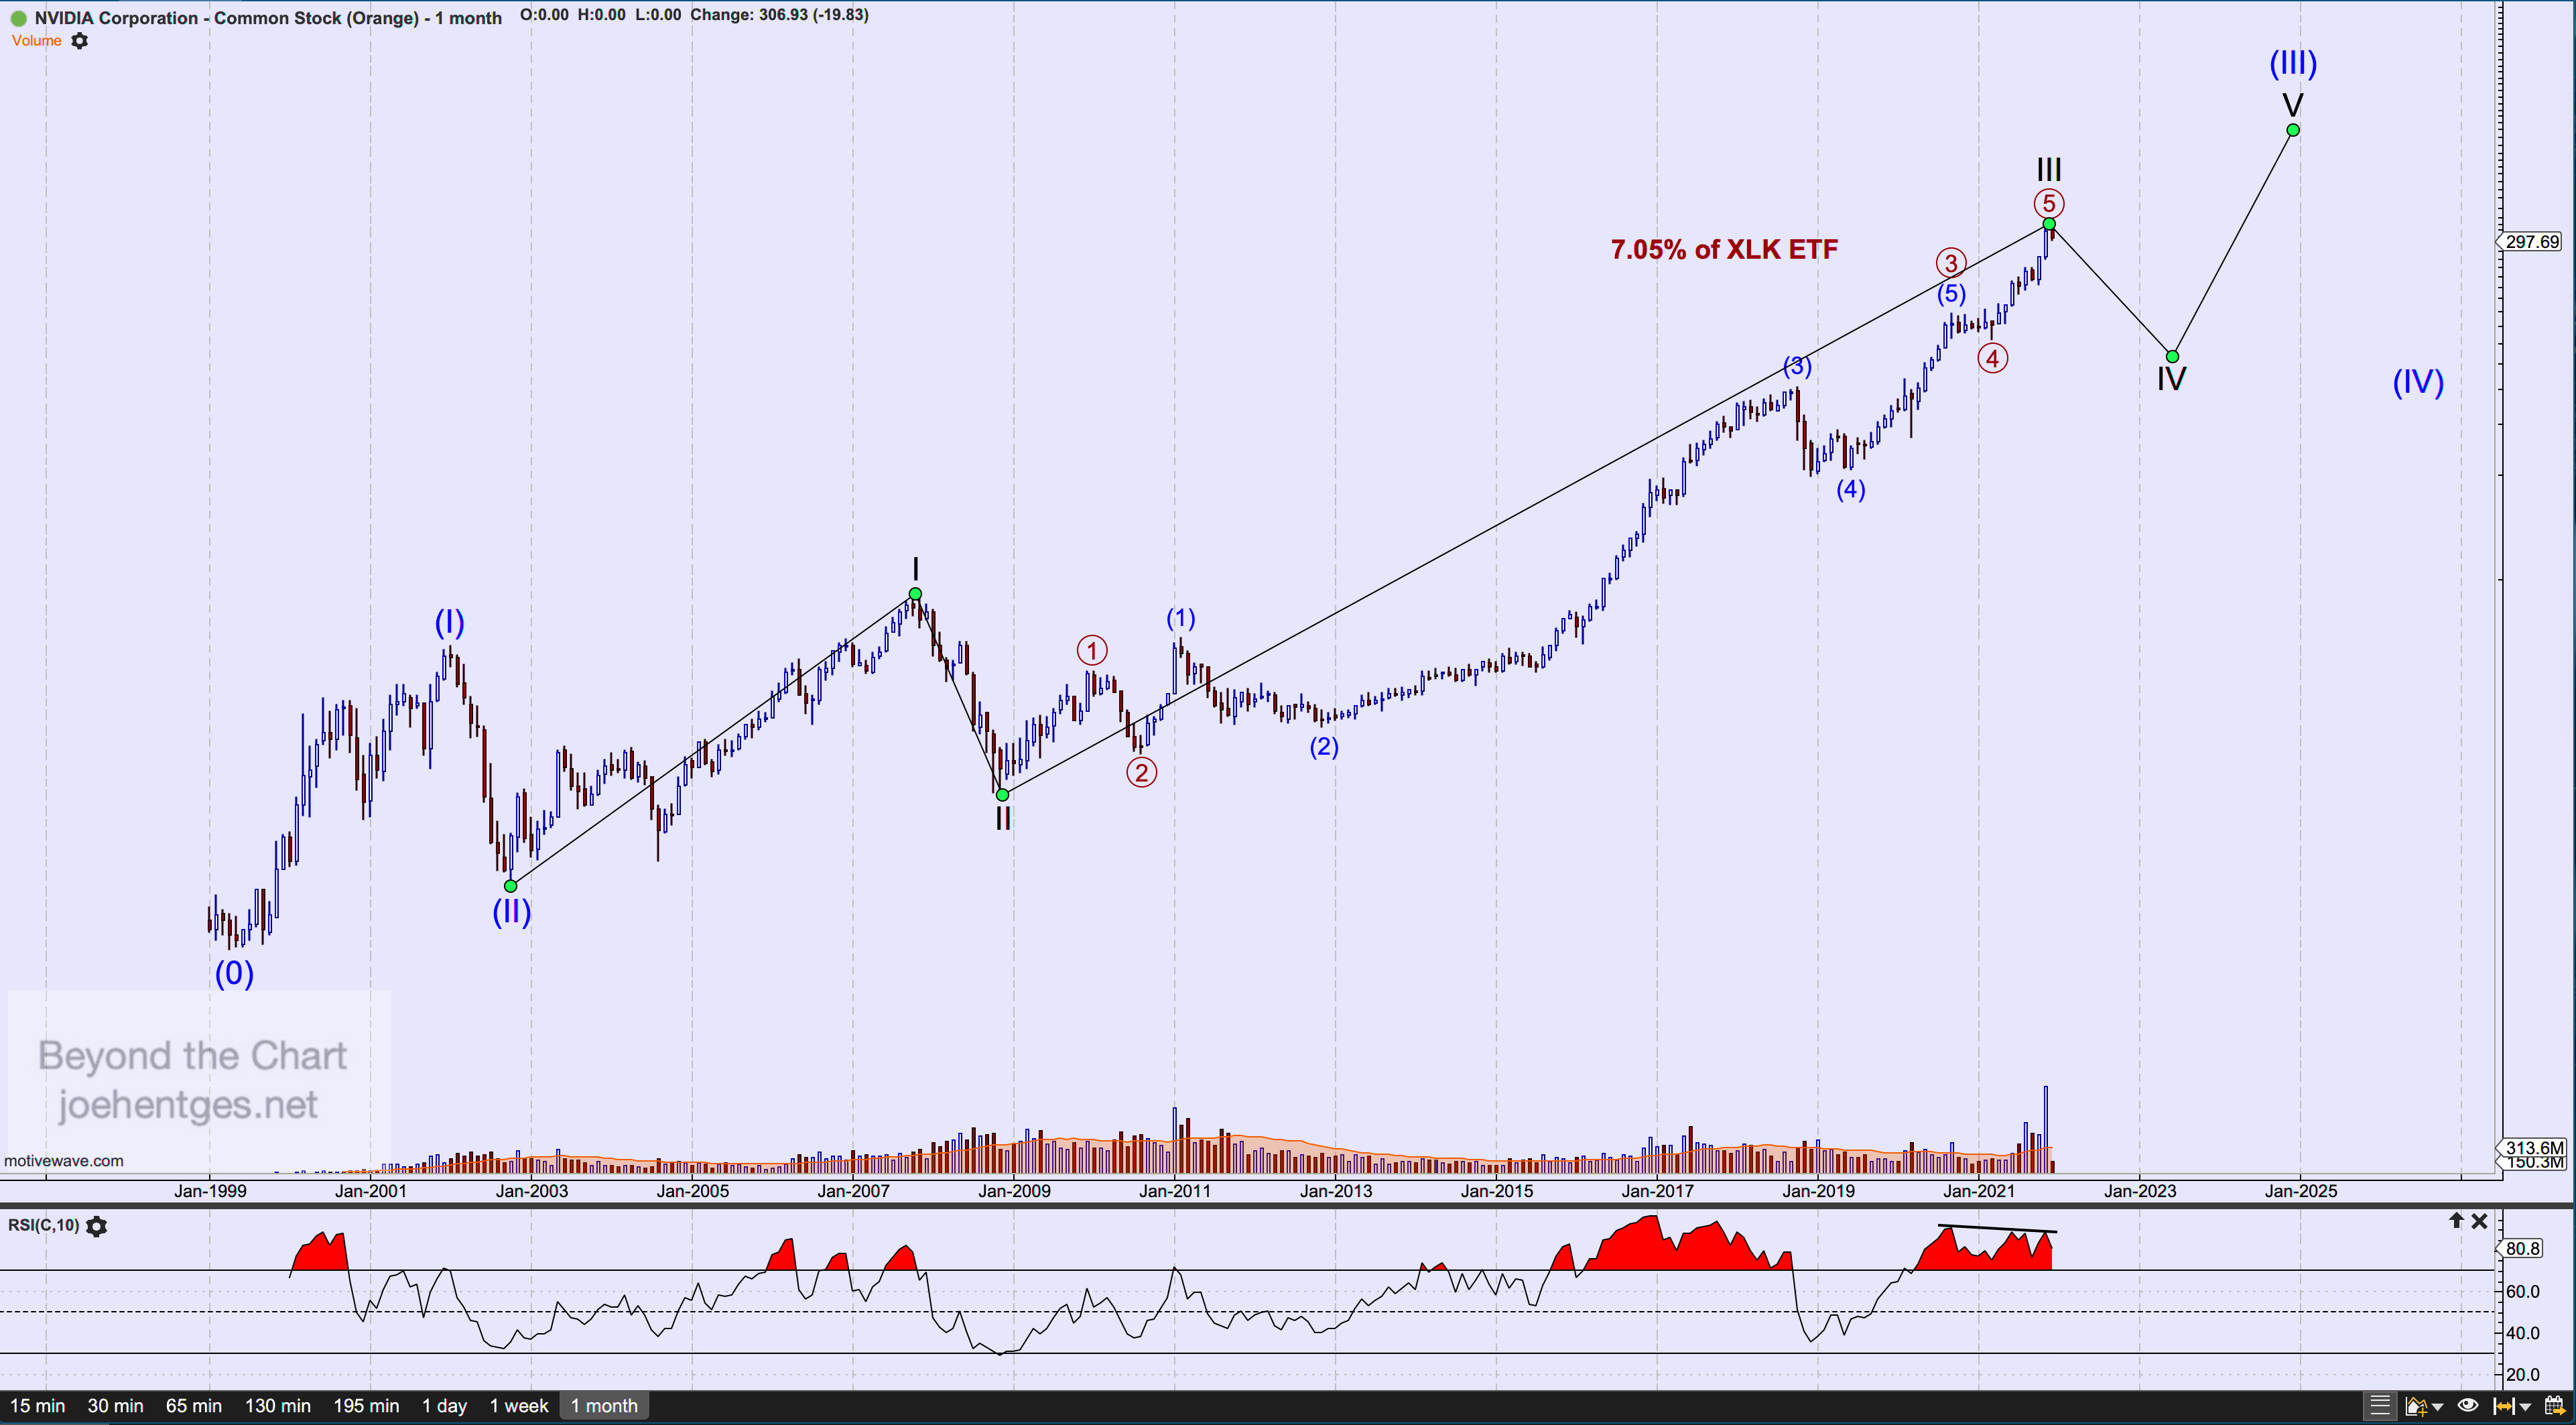
Our last stock is NVDA. The monthly chart below shows all the data since it went public in January 1999.  The Elliott Wave count shows a SuperCycle Wave III underway from the October 2002 low. I believe that Cycle Wave III of SuperCycle Wave (III) is complete with the high of $346.47 on November 22.  It will now undergo a Wave IV correction that should chop sideways. 

Data thru December 3, 2021

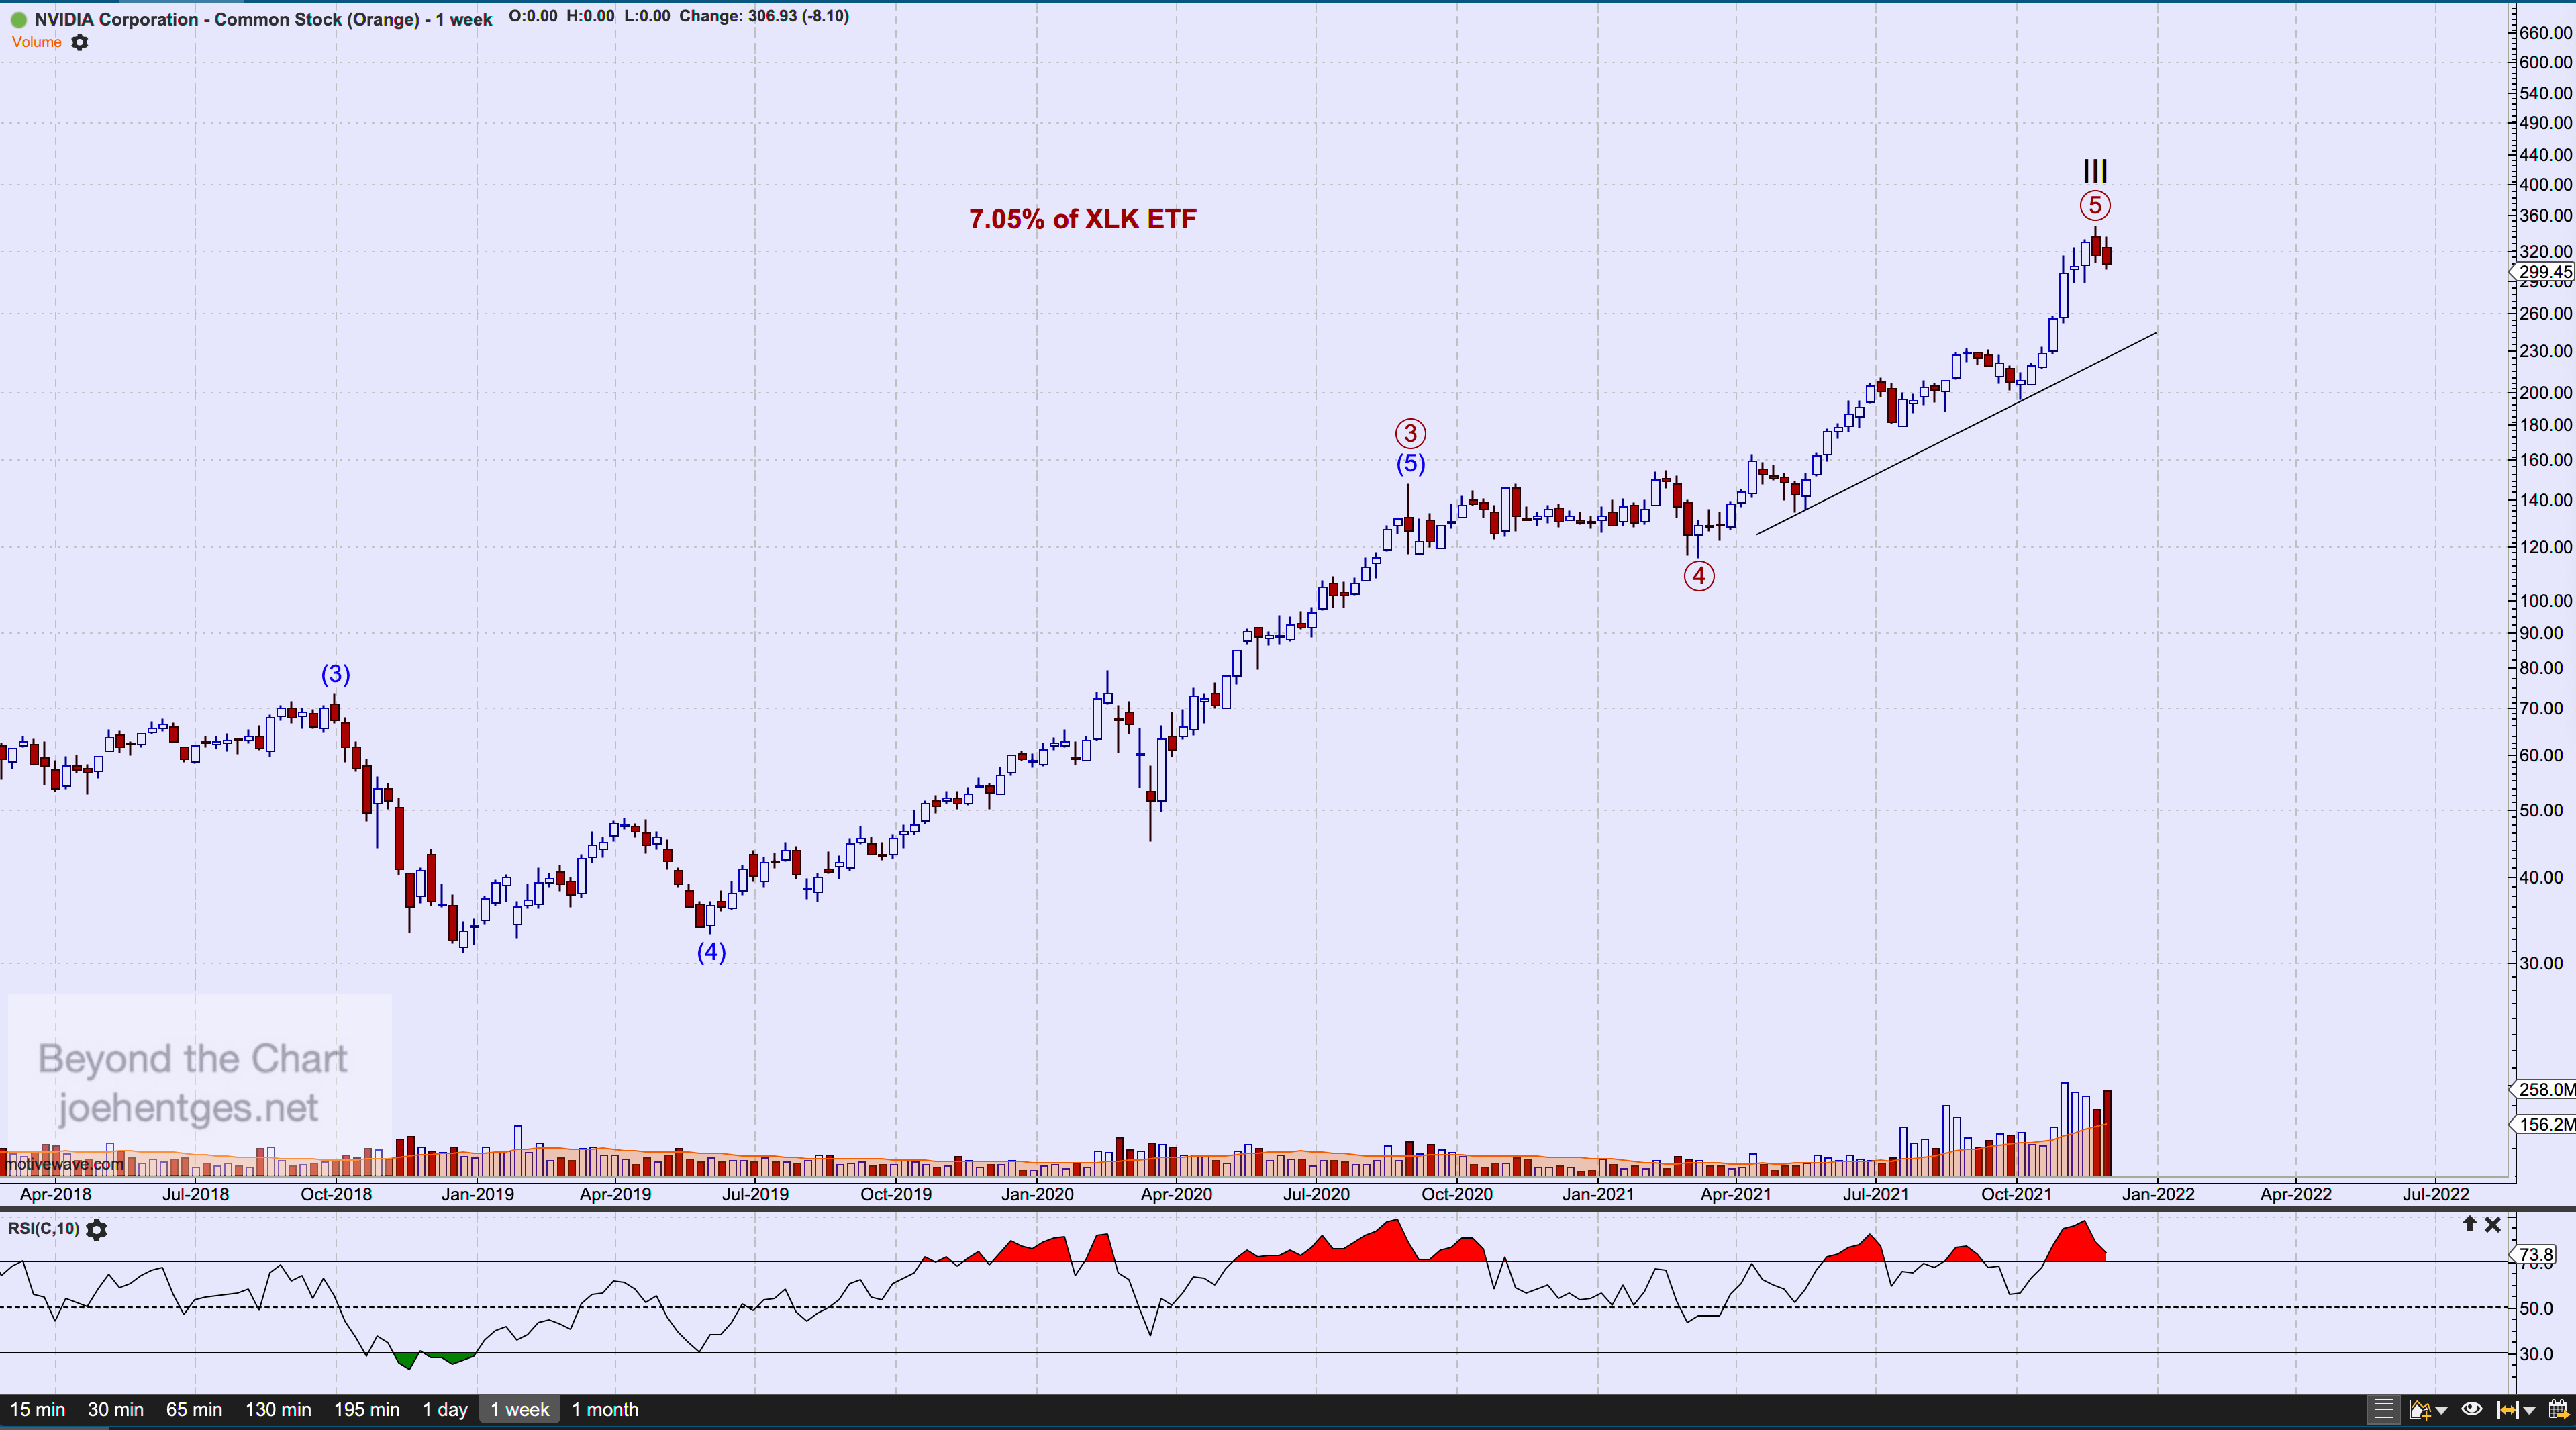
The weekly chart of NVDA shows a relatively short Primary Wave 5 (circled). If the high of $346.47 is indeed in, then price should break down thru the trend line shown on the chart.  

Data thru December 3, 2021

Crude Oil Squeeze?

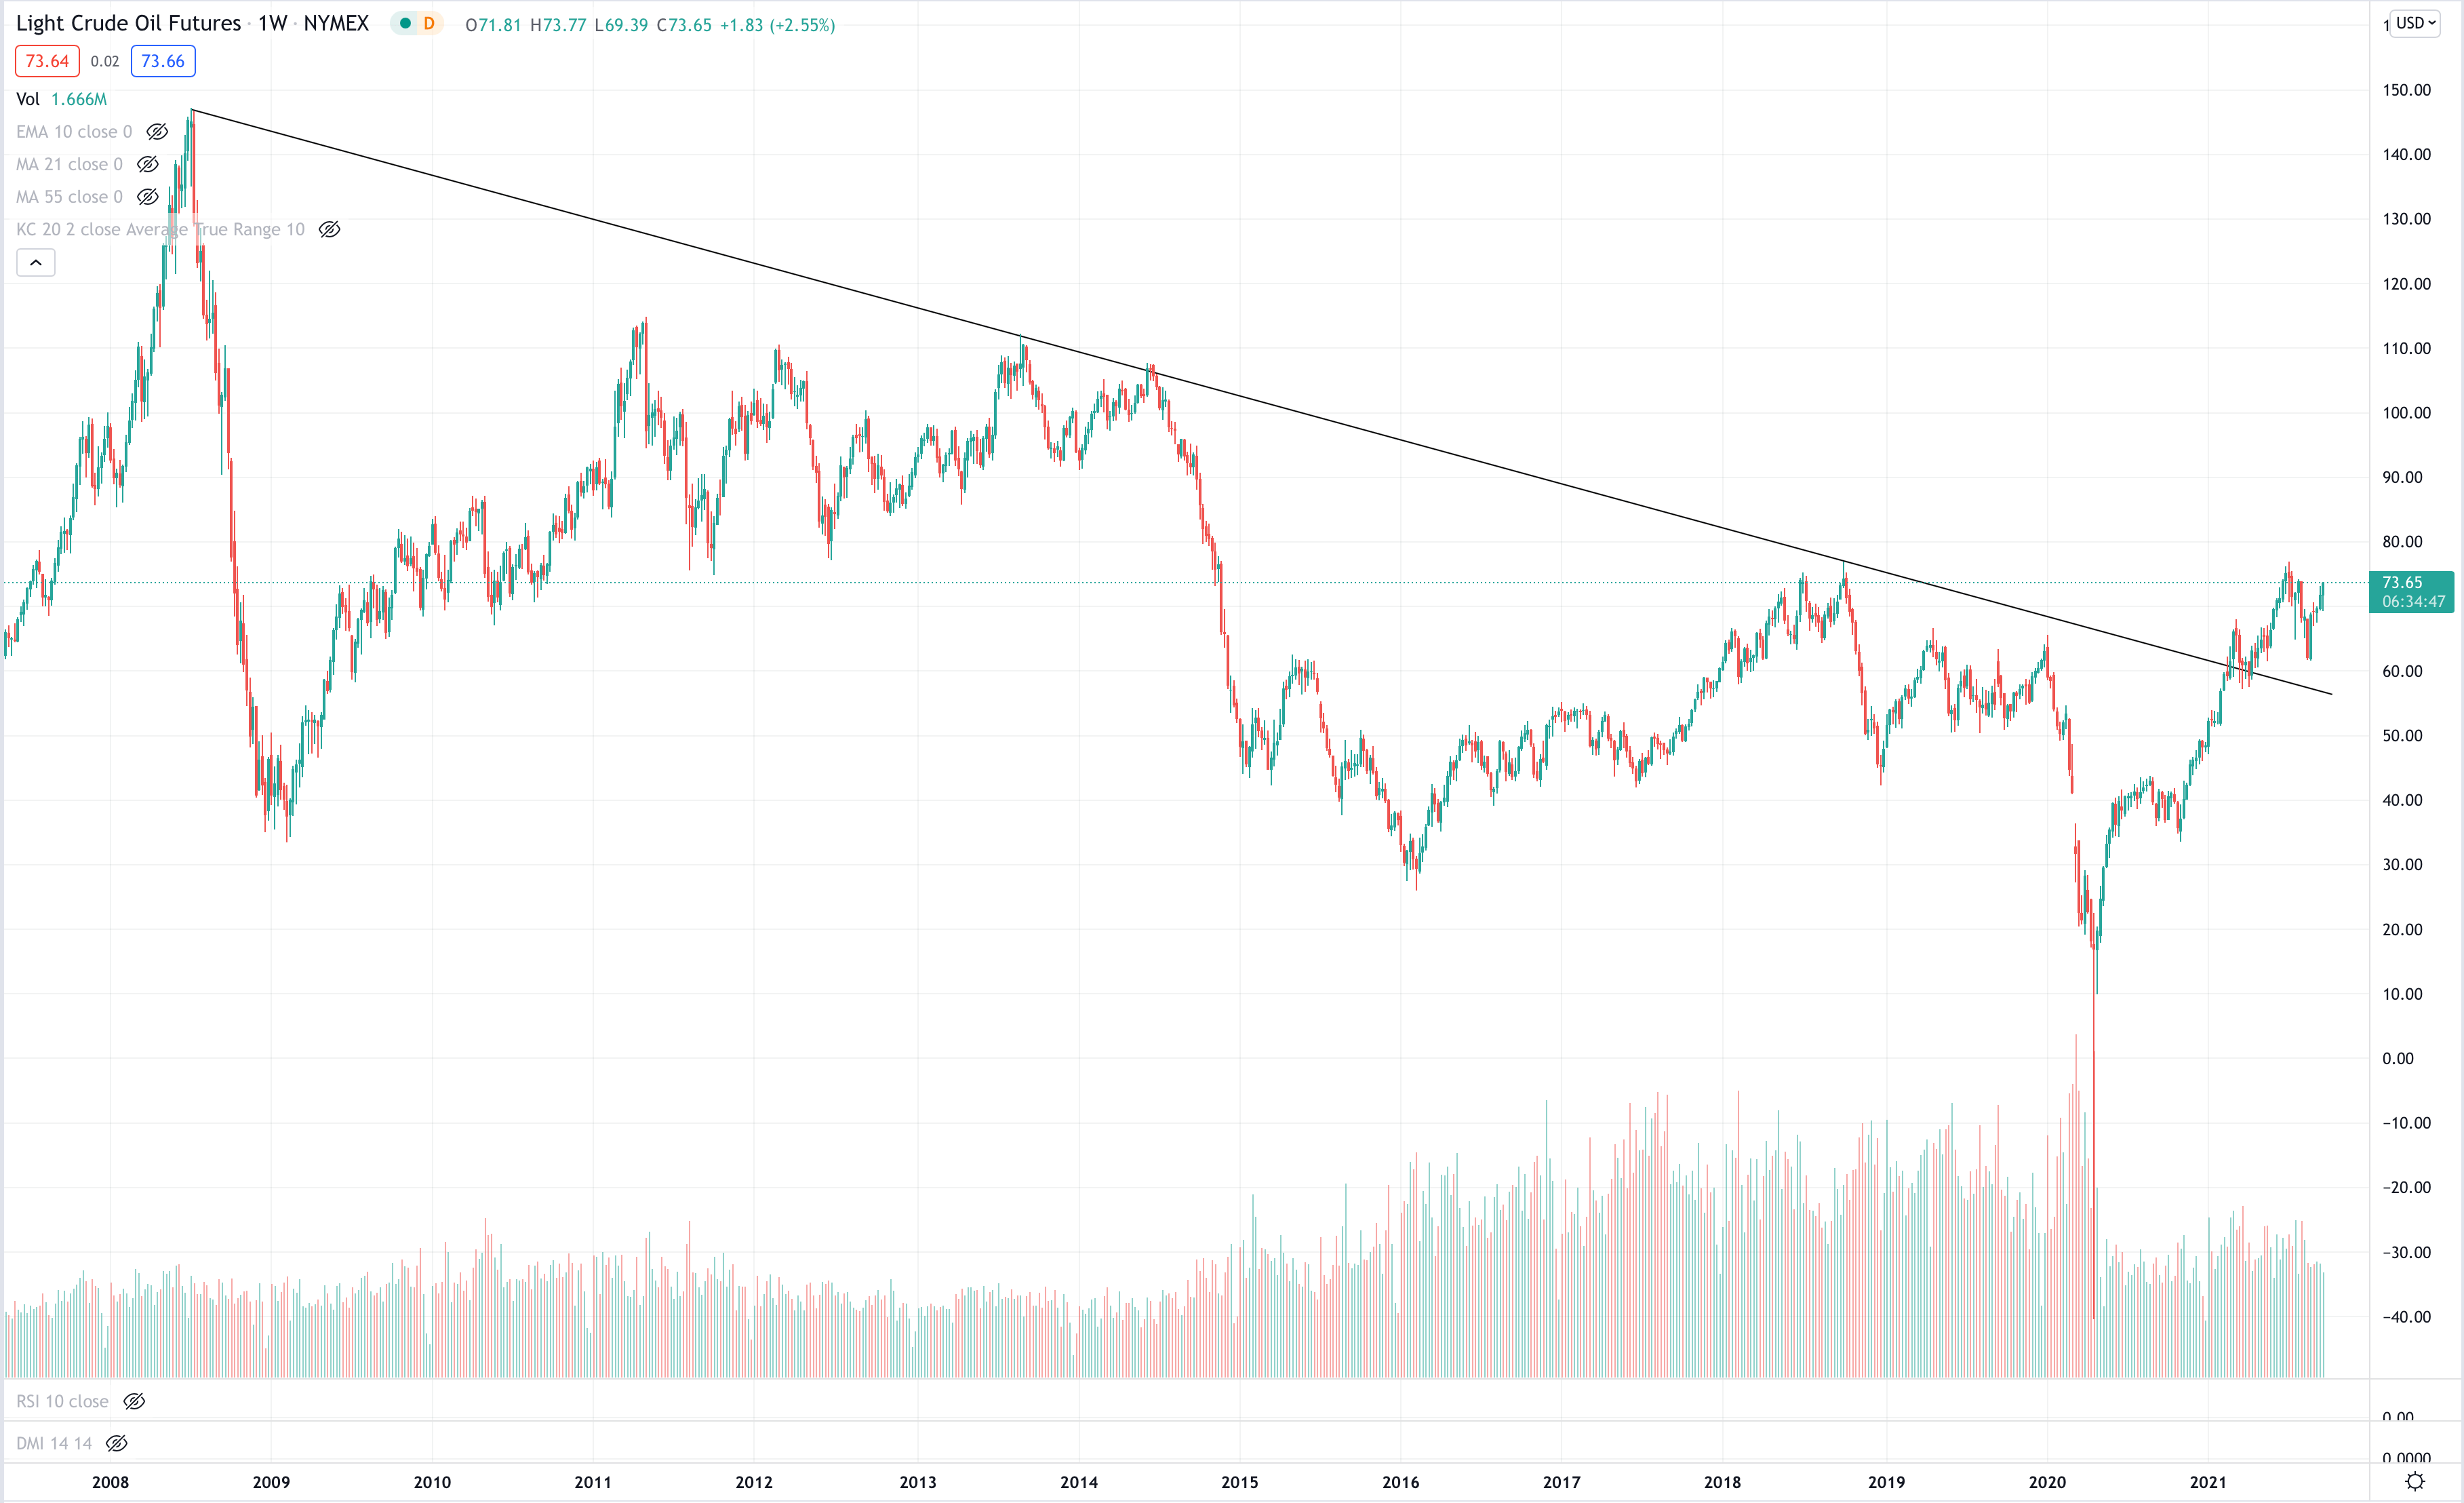
It’s no secret that commodities have been in one heck of a rally over the last year or so.  And that includes crude oil. Light Crude Oil futures fell to a never seen before -$40.32 in April 2020. They have since rallied to a high of $76.98 in July of this year. In the process, Light Crude Oil futures broke a 13 year downtrend from the peak in July 2008.

There appears to be overhead resistance at $77 which when broken would enable Light Crude Oil futures to surge possibly into the 90’s.  What could possibly cause a crude oil squeeze and drive the price significantly higher? Any number of things but I don’t think it matters. What matters is the price action.  

Data thru Sept. 24 10am CT

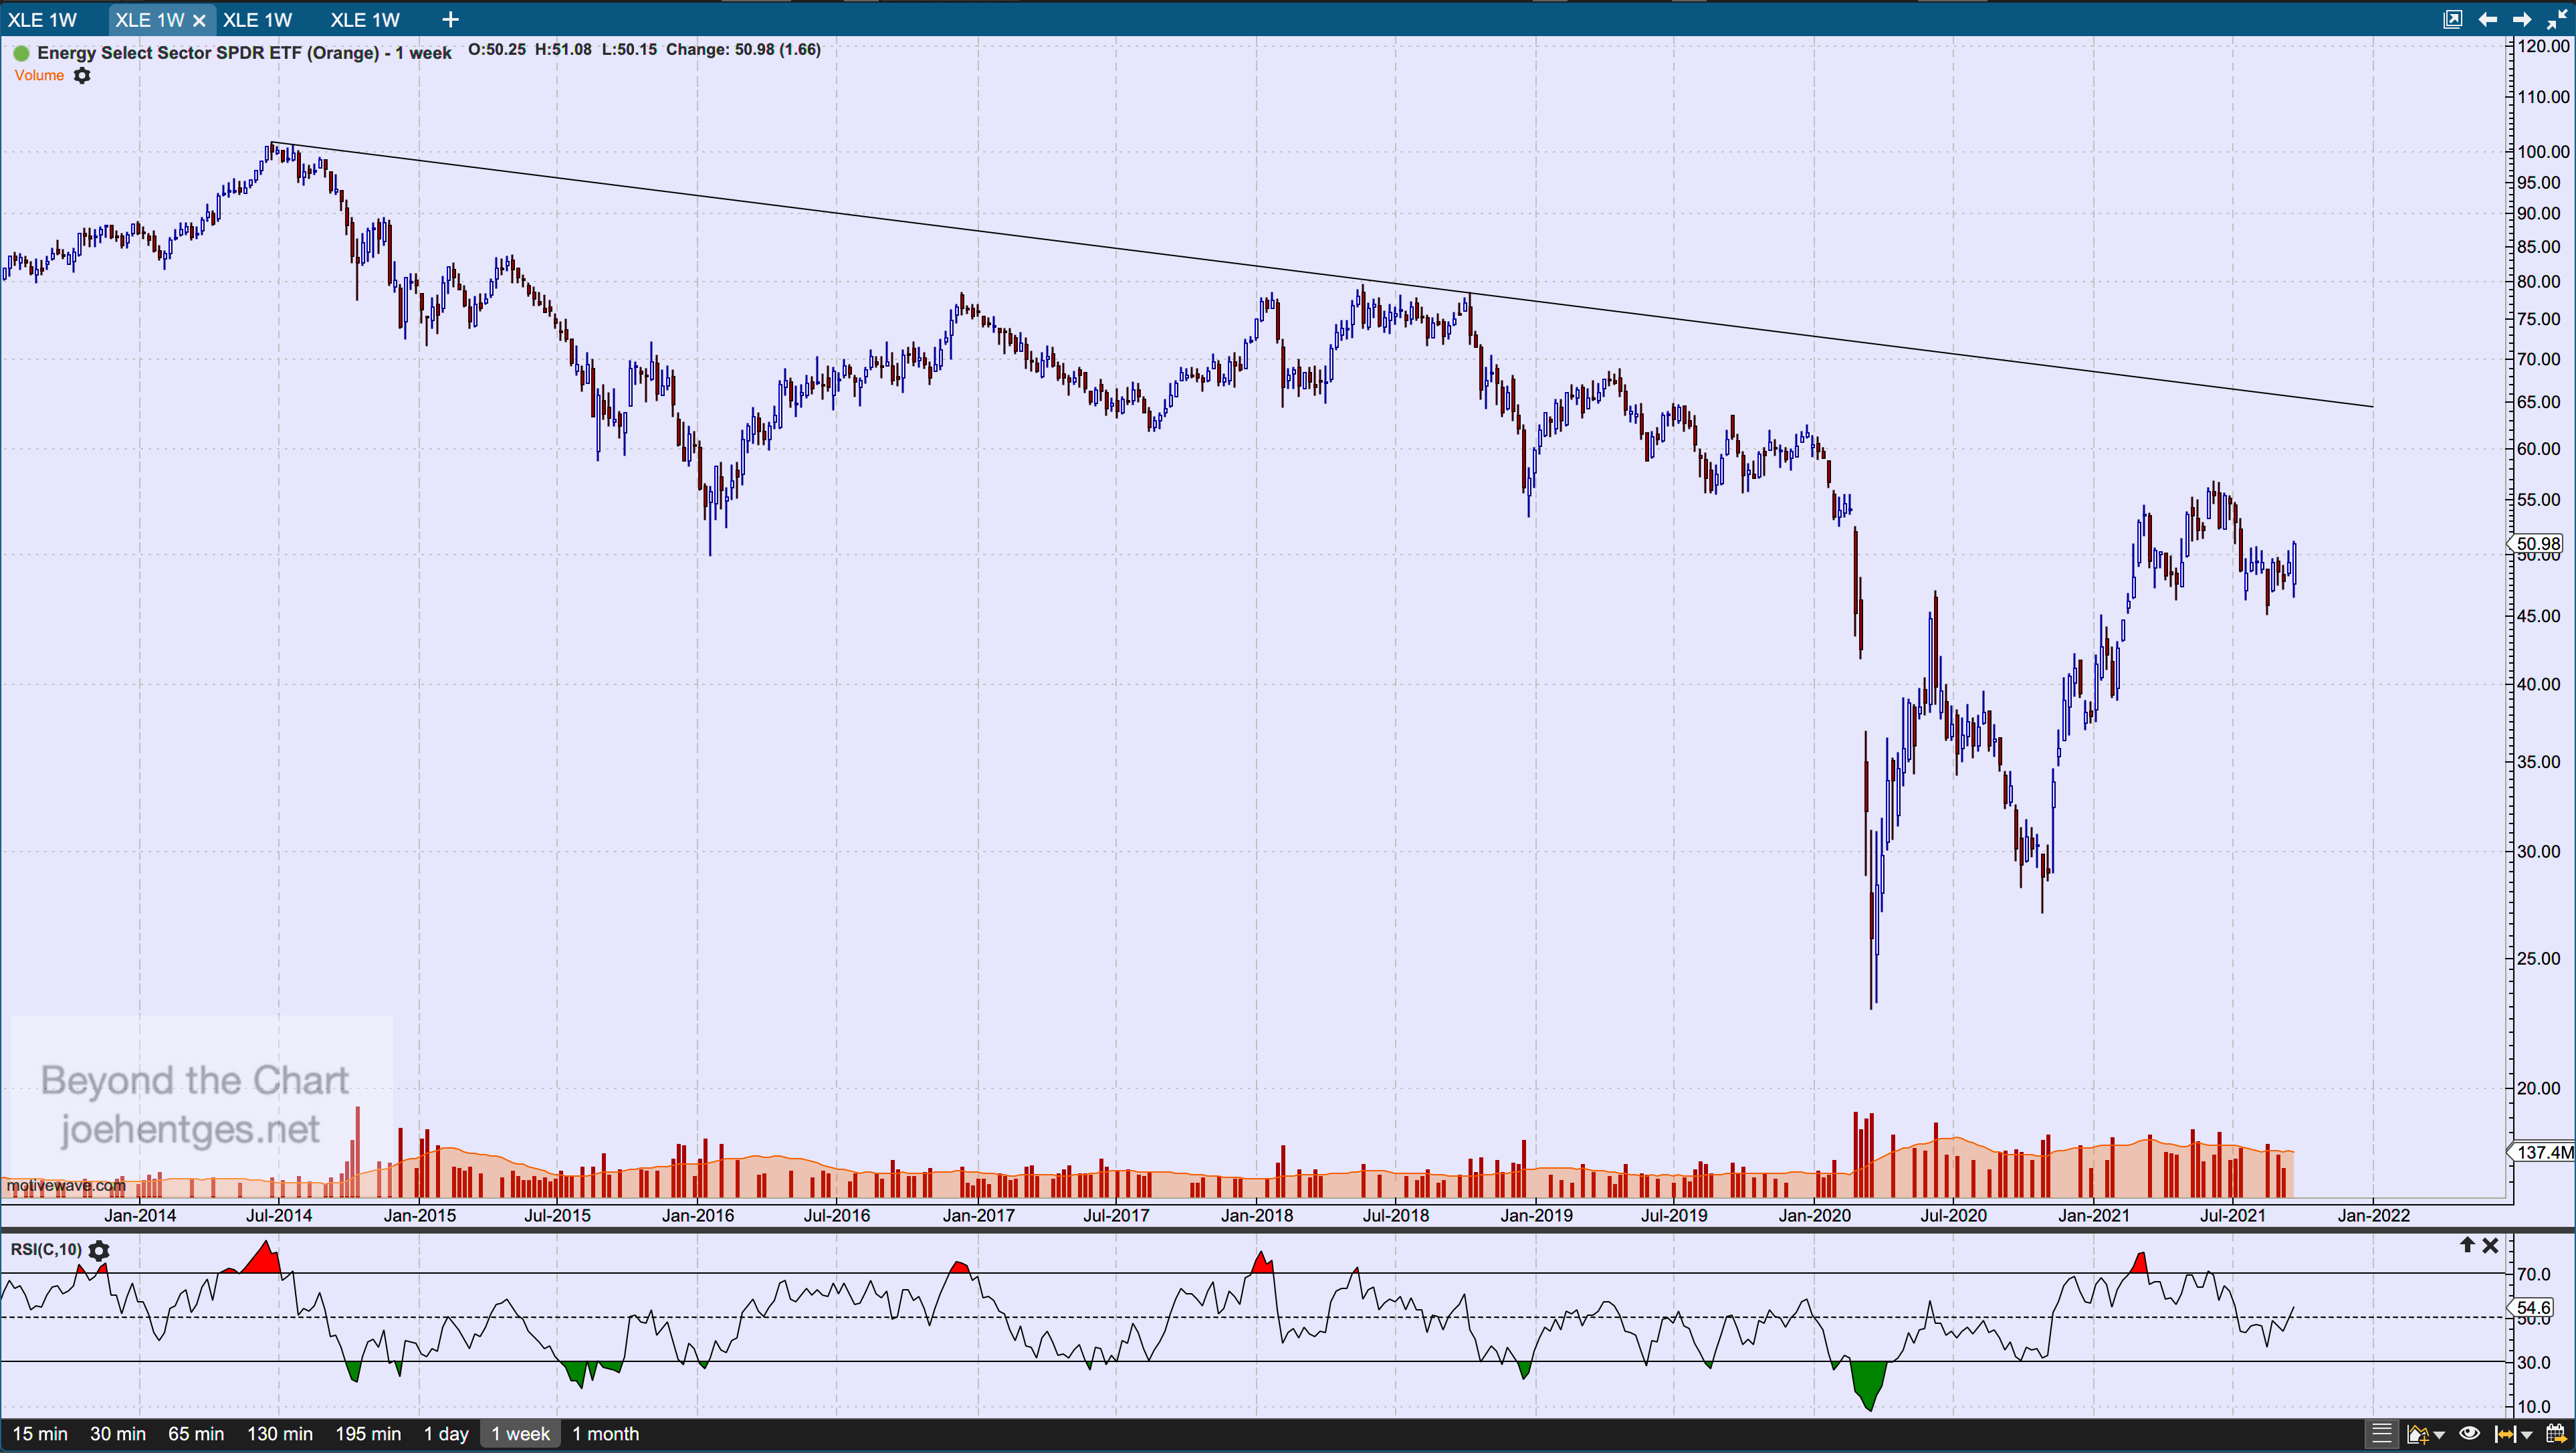
So what about energy stocks? Let’s take a look at the Energy Select Sector SPDR ETF (XLE). From a high of $101.52 in June 2014 they dropped to an intra-week low of $22.88 in March 2020. XLE rallied back to an intra-week high of $56.65 in early June of this year. They have since pulled back some but appear primed to challenge that 2021 high. 

Data thru Sept. 24 10am CT

In the daily chart below, XLE appears to be breaking out of a small Head & Shoulders Bottom pattern.  This projects to the $56 area.  Beyond that, there appears to be plenty of overhead challenges. We’ll see how strong this decides to get. And how much of a move occurs in Light Crude Oil futures. 

Data thru Sept. 24 10am CT

  • a couple of years ago
  • Energy
89 Year Echo

Must Consult the Past

"Whoever wishes to foresee the future must consult the past; for human events ever resemble those of preceding times...this arises from the fact that they are produced by men who have been, and ever will be, animated by the same passions."   - Machiavelli

Powered by WishList Member - Membership Software