
All Posts by Joe Hentges

Have Semiconductors Run Out of Steam?

Semiconductor stocks had one heck of an explosive move from the end of March into mid-June.  The VanEck Semiconductor ETF (SMH) went from a close of 362.53 on March 30 to a closing high of 668.91 on June 22. A whopping 84.5% in 57 trading days or about 2 ½ months.
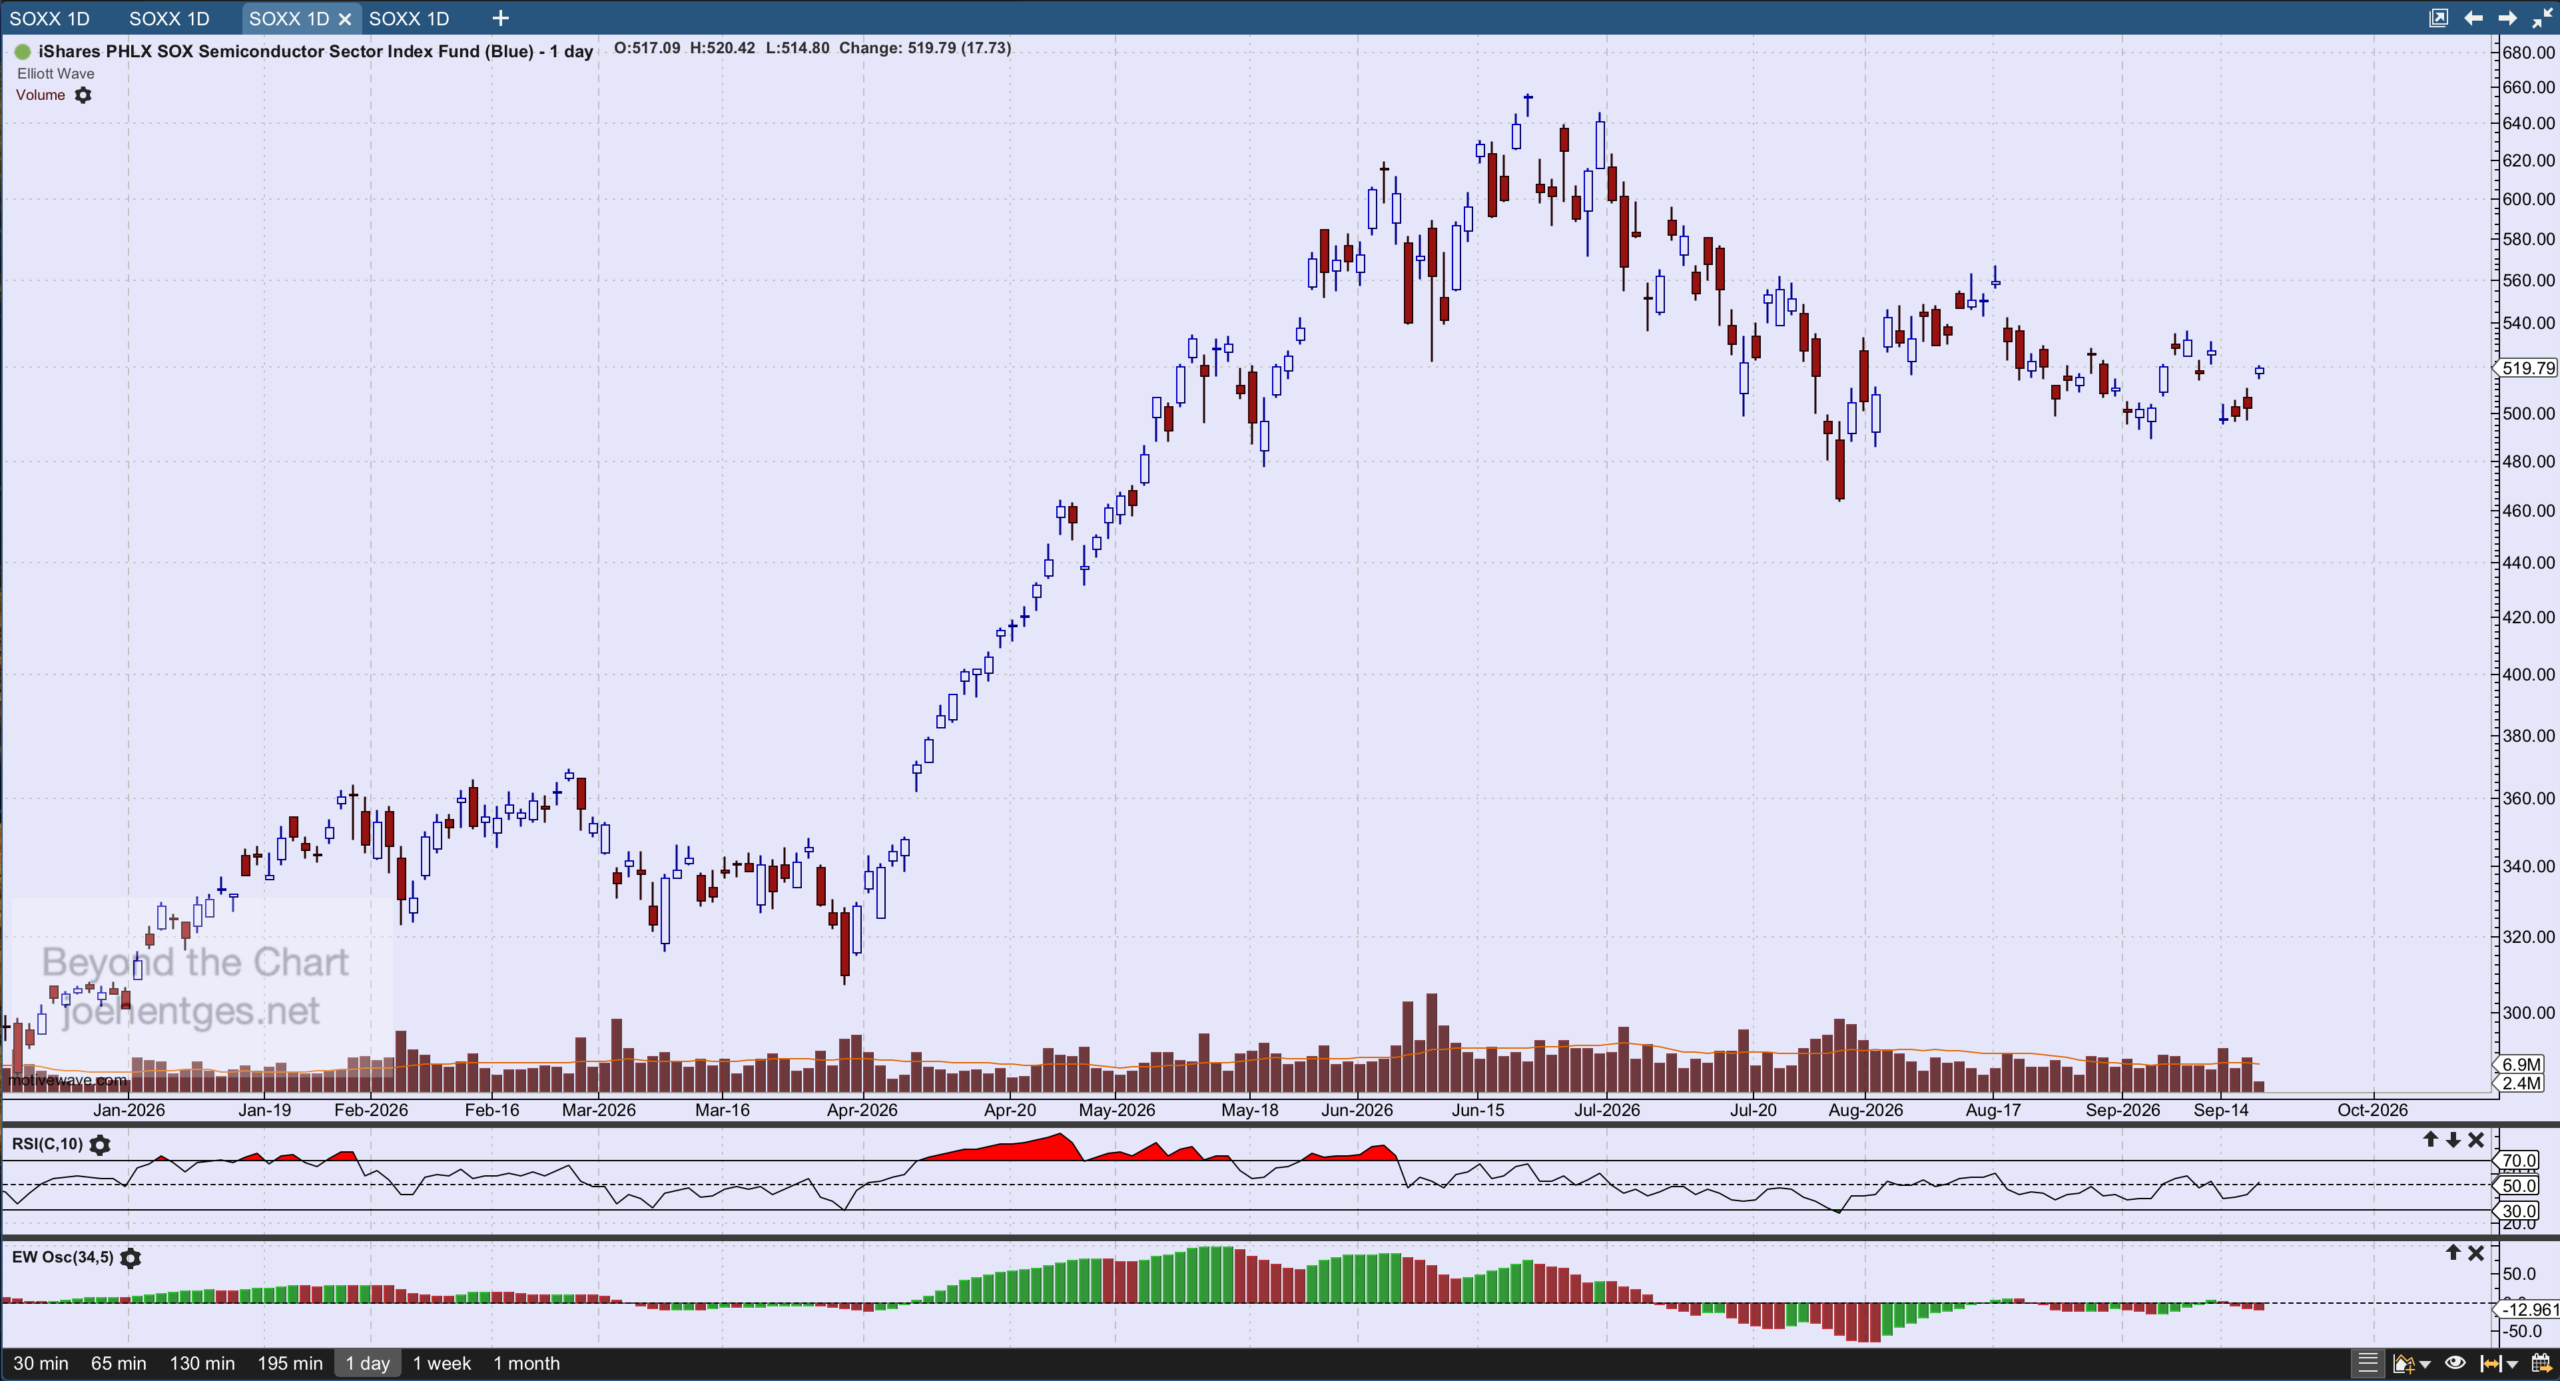
The iShares Semiconductor ETF(SOXX) did even better. It went from 309.79 to 655.01 in the same exact timeframe…up 111.4%. For purposes of this post I am focusing on SOXX.  The chart above shows the explosive April – June move.  With the closing low on July 29 of 465.00, the SOXX gave back 55% of the entire move up from March 30th.

Let’s take a look at the longer term timeframe to get a better perspective on where we are in the overall cycle.  
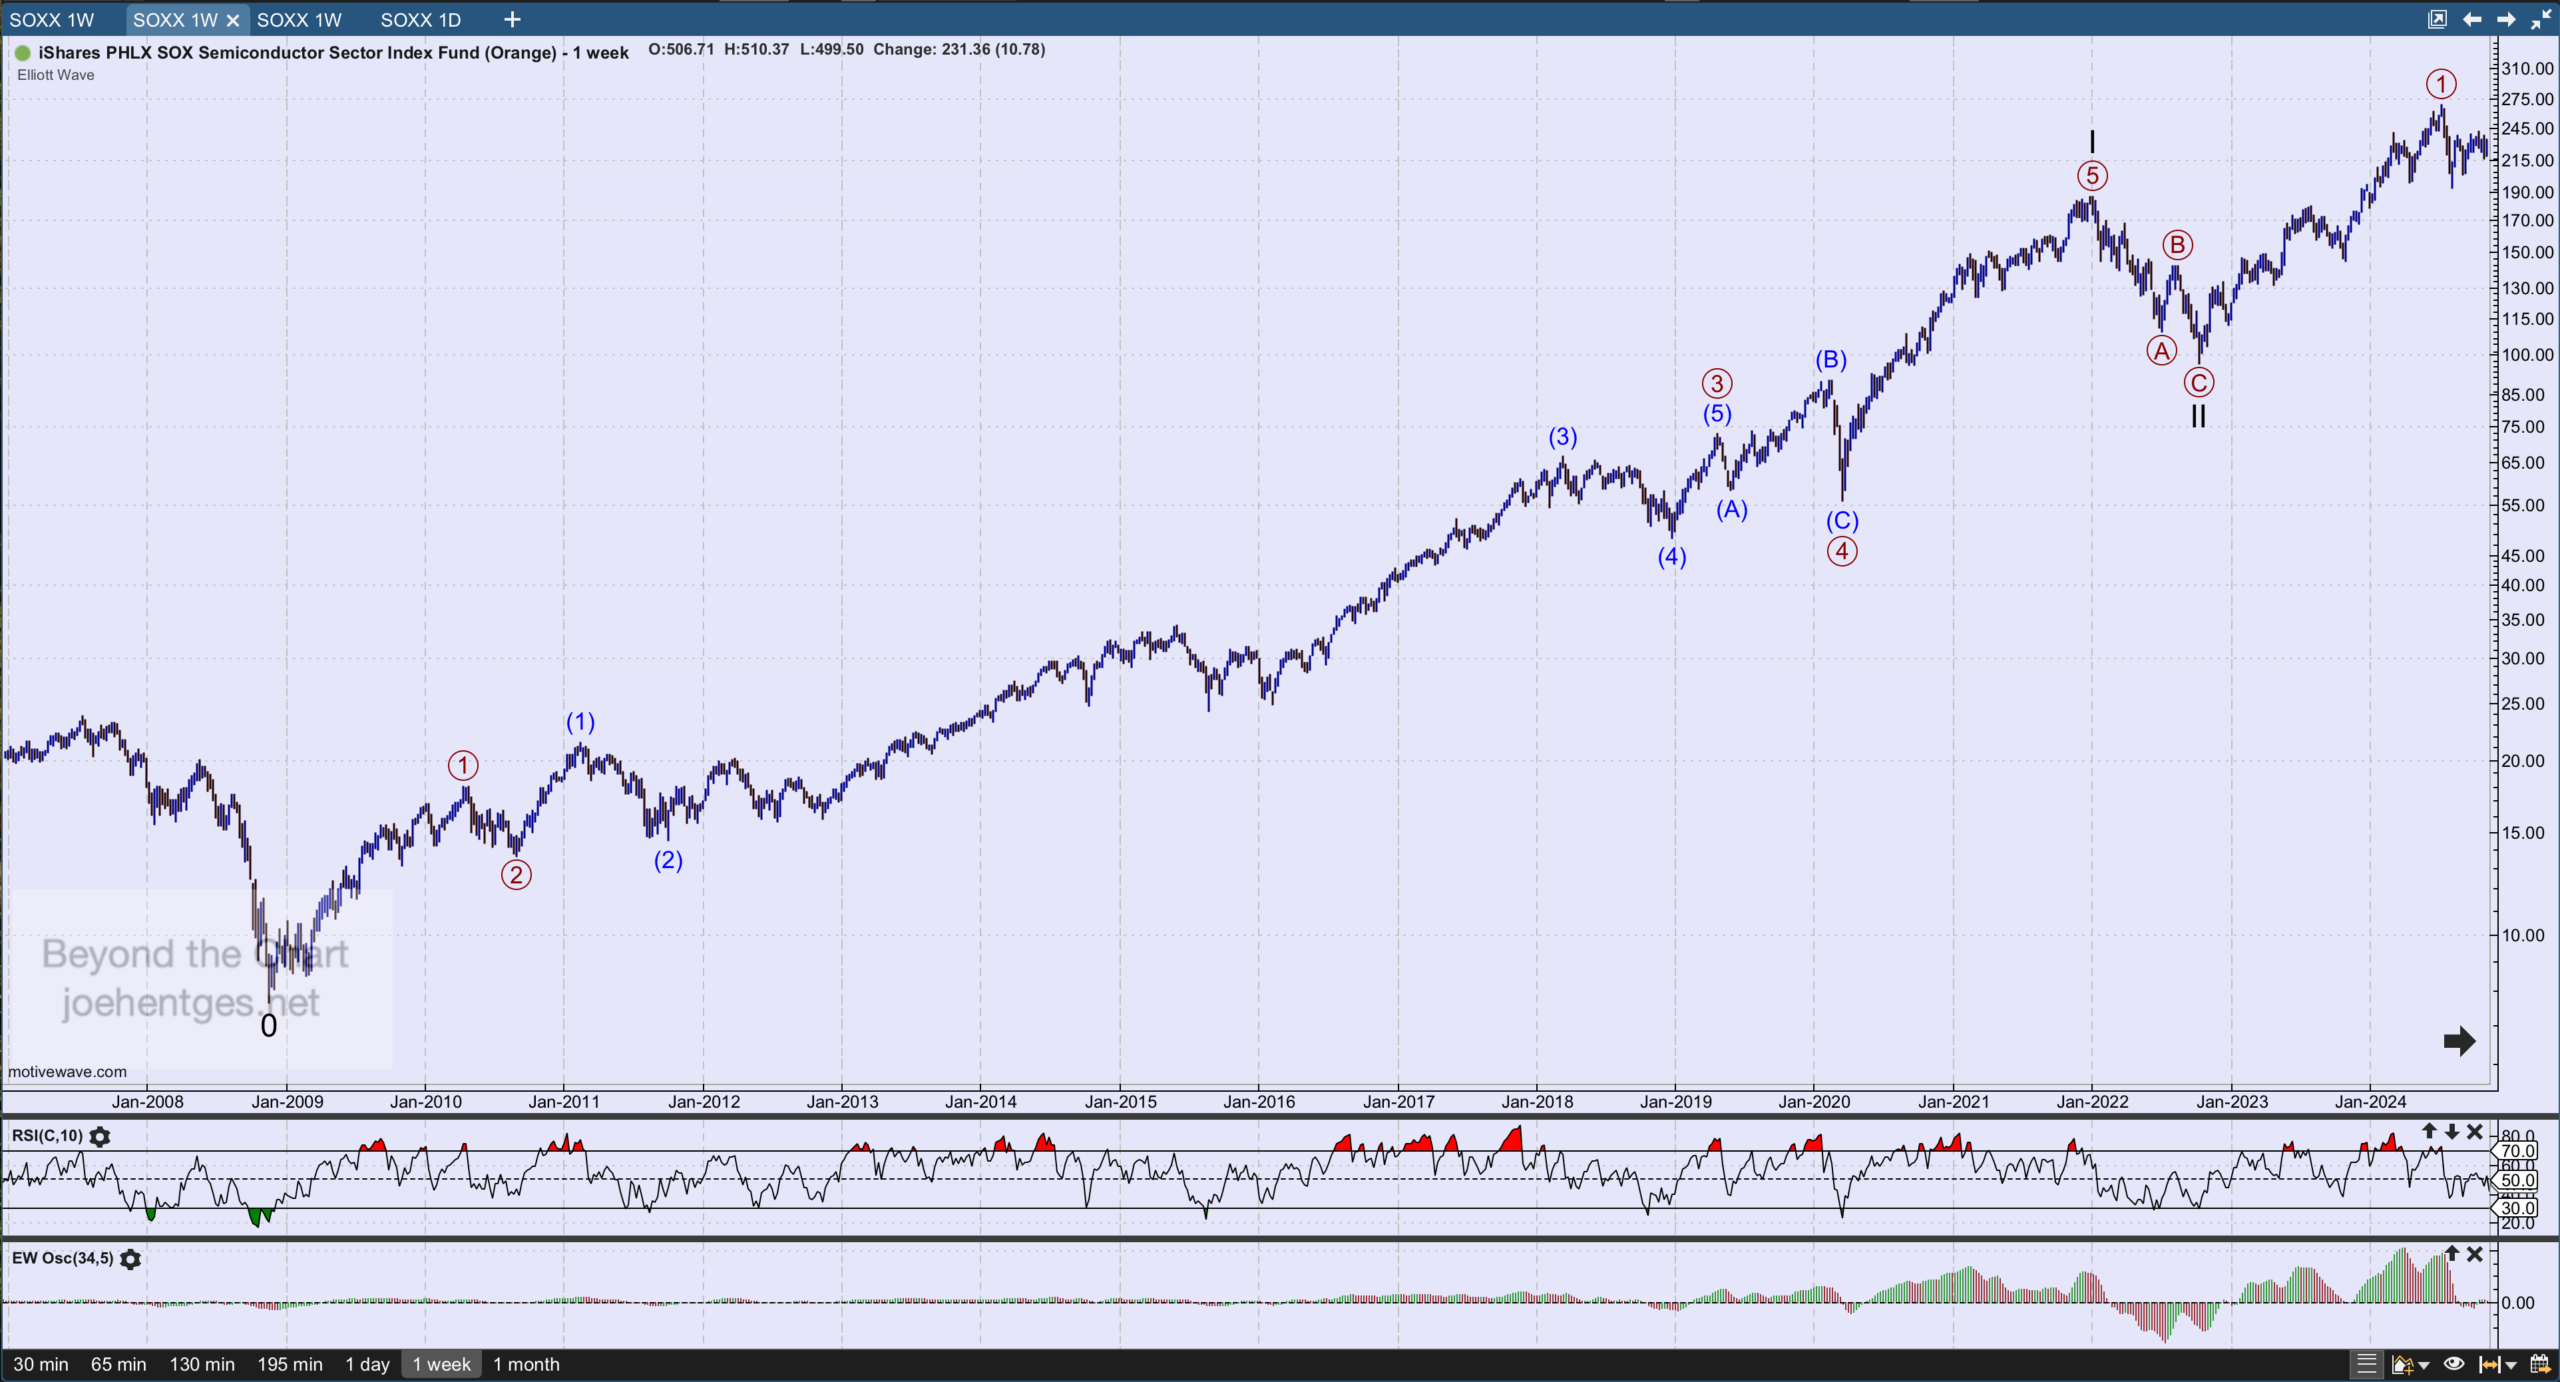
The latest major move for the semiconductors began at the low of 7.63 the week of November 16, 2008. Notice that this was 3 months before the stock market bottomed in March 2009. 

The chart above focuses on what I believe are the first two major waves, Cycle Wave I and Cycle Wave II.  Clearly there was an extended 3rd wave in Cycle I, therefore creating what most likely is an extended wave for Cycle Wave I.  

When you look at Cycle Wave II, it seems to be a relatively short wave for a wave two. This is distorted due to the semi-log scale needed for the long-term picture.  When the scale changes to linear you can clearly see that Cycle Wave II retraced 50% of the entire move of Cycle Wave I. This is shown below.
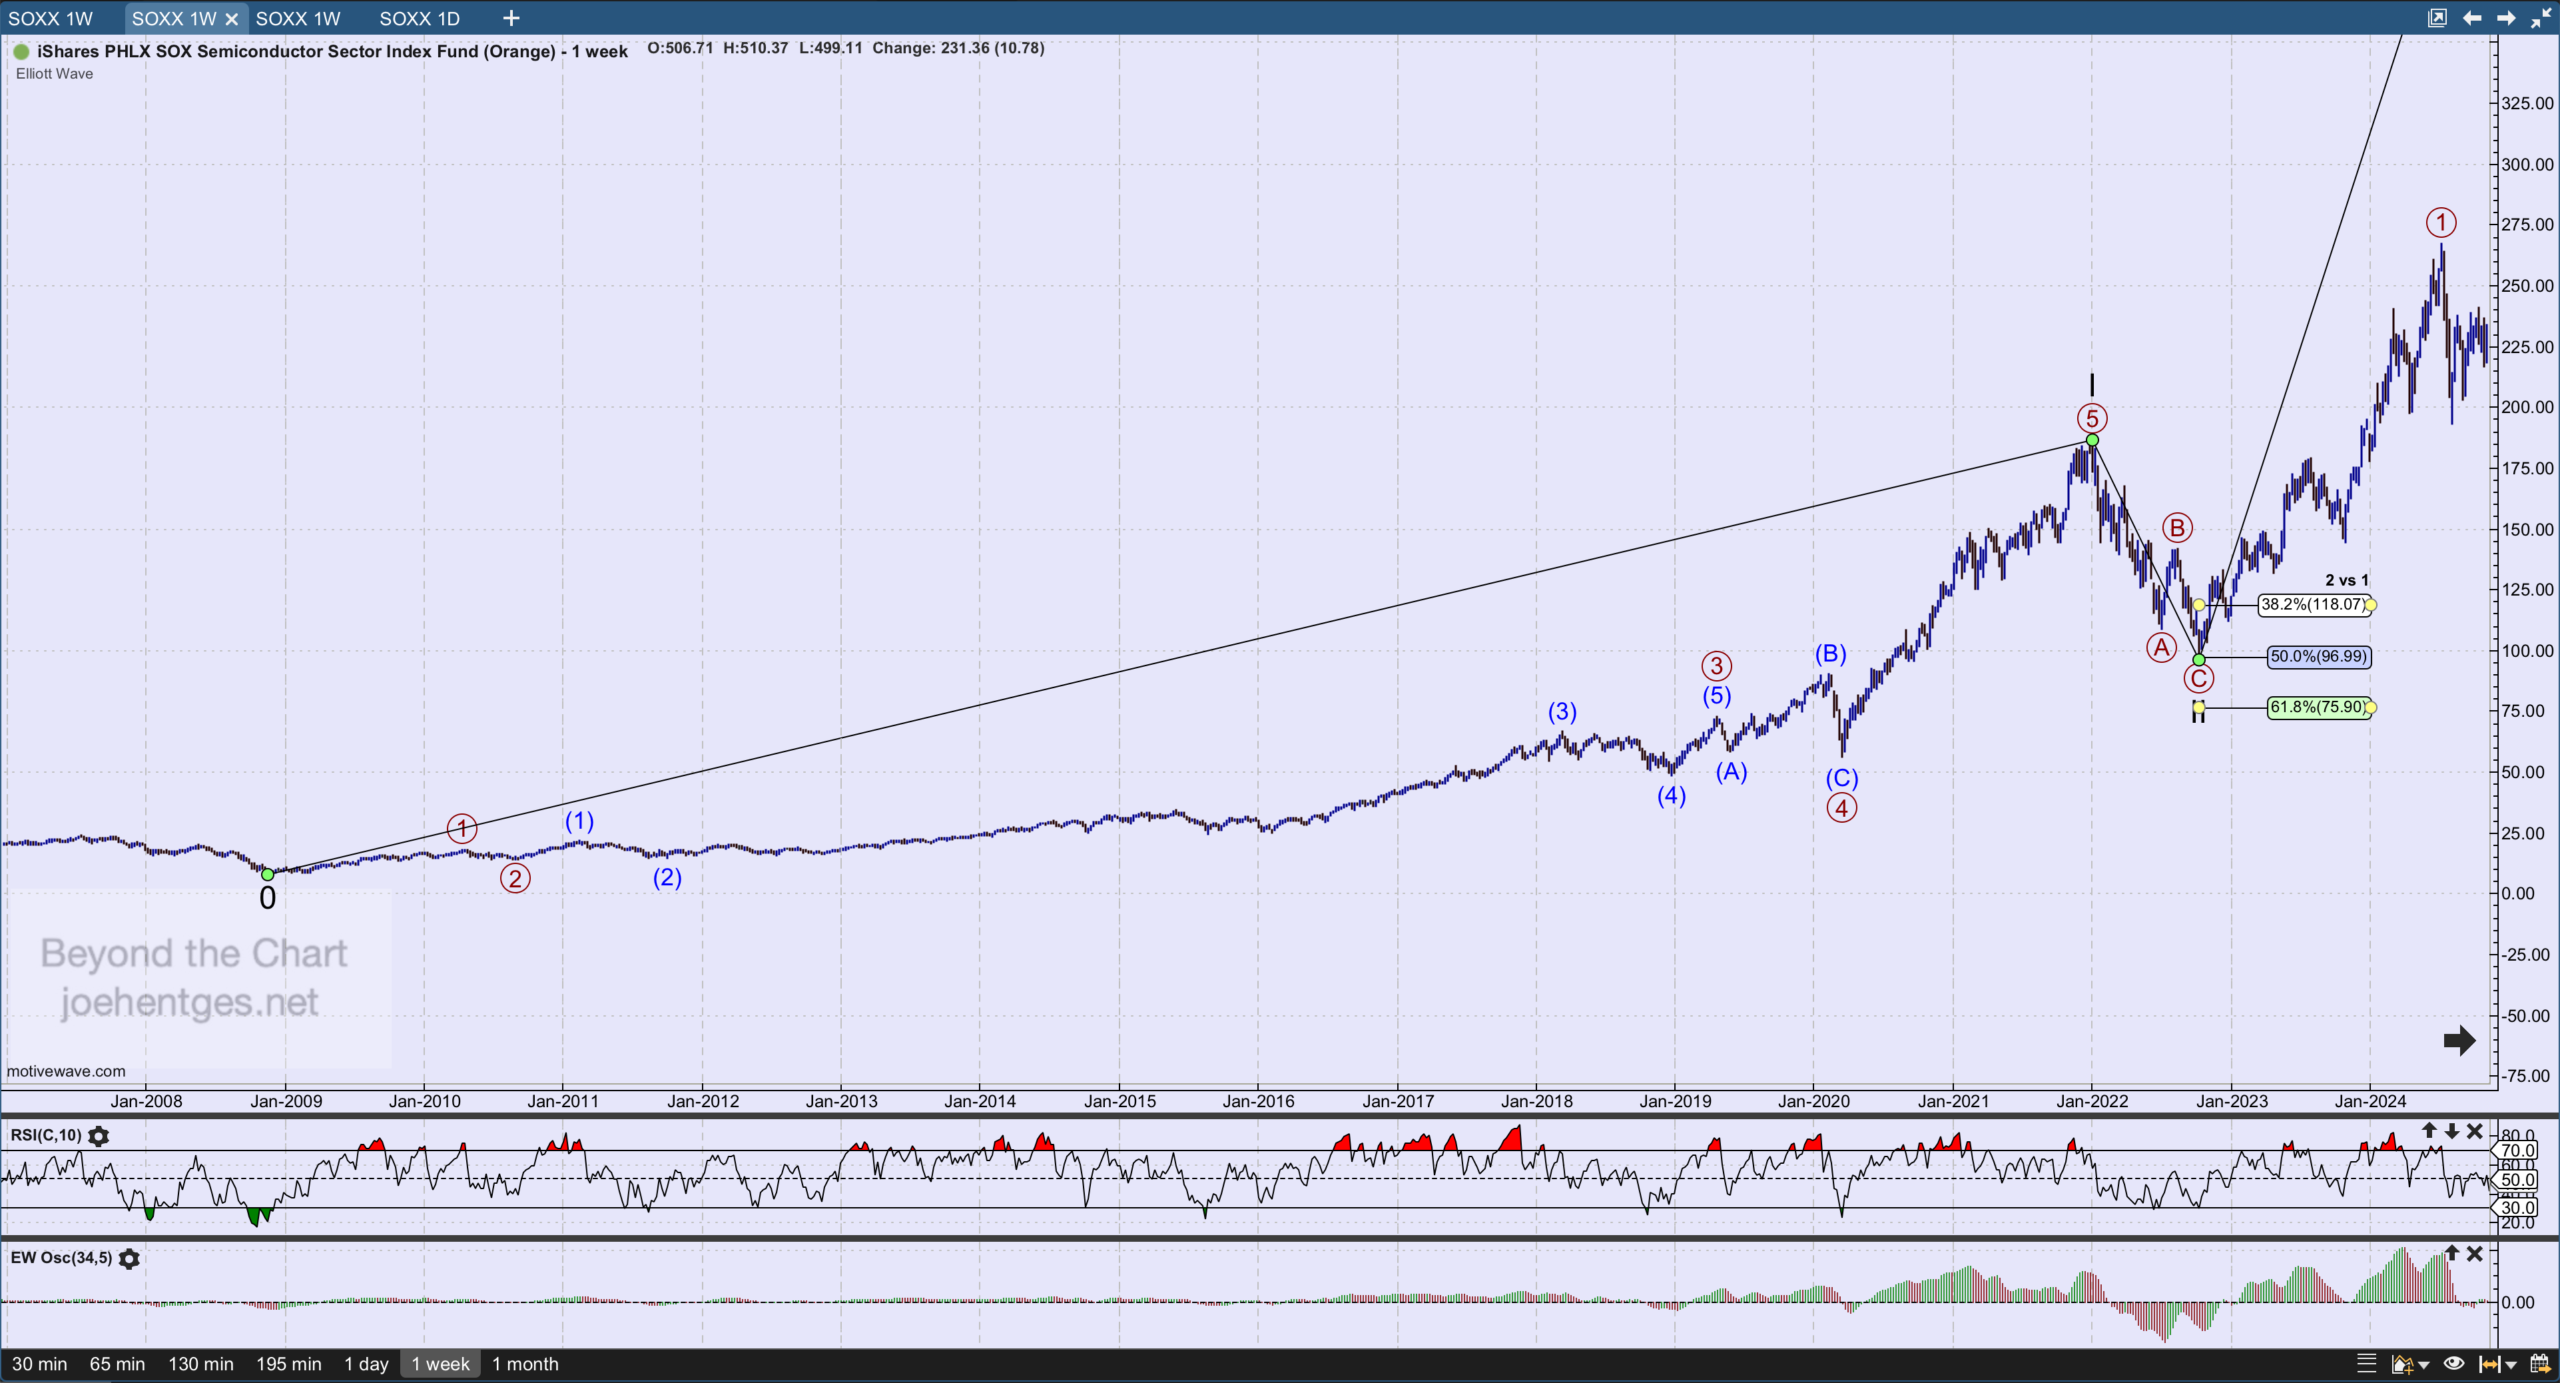
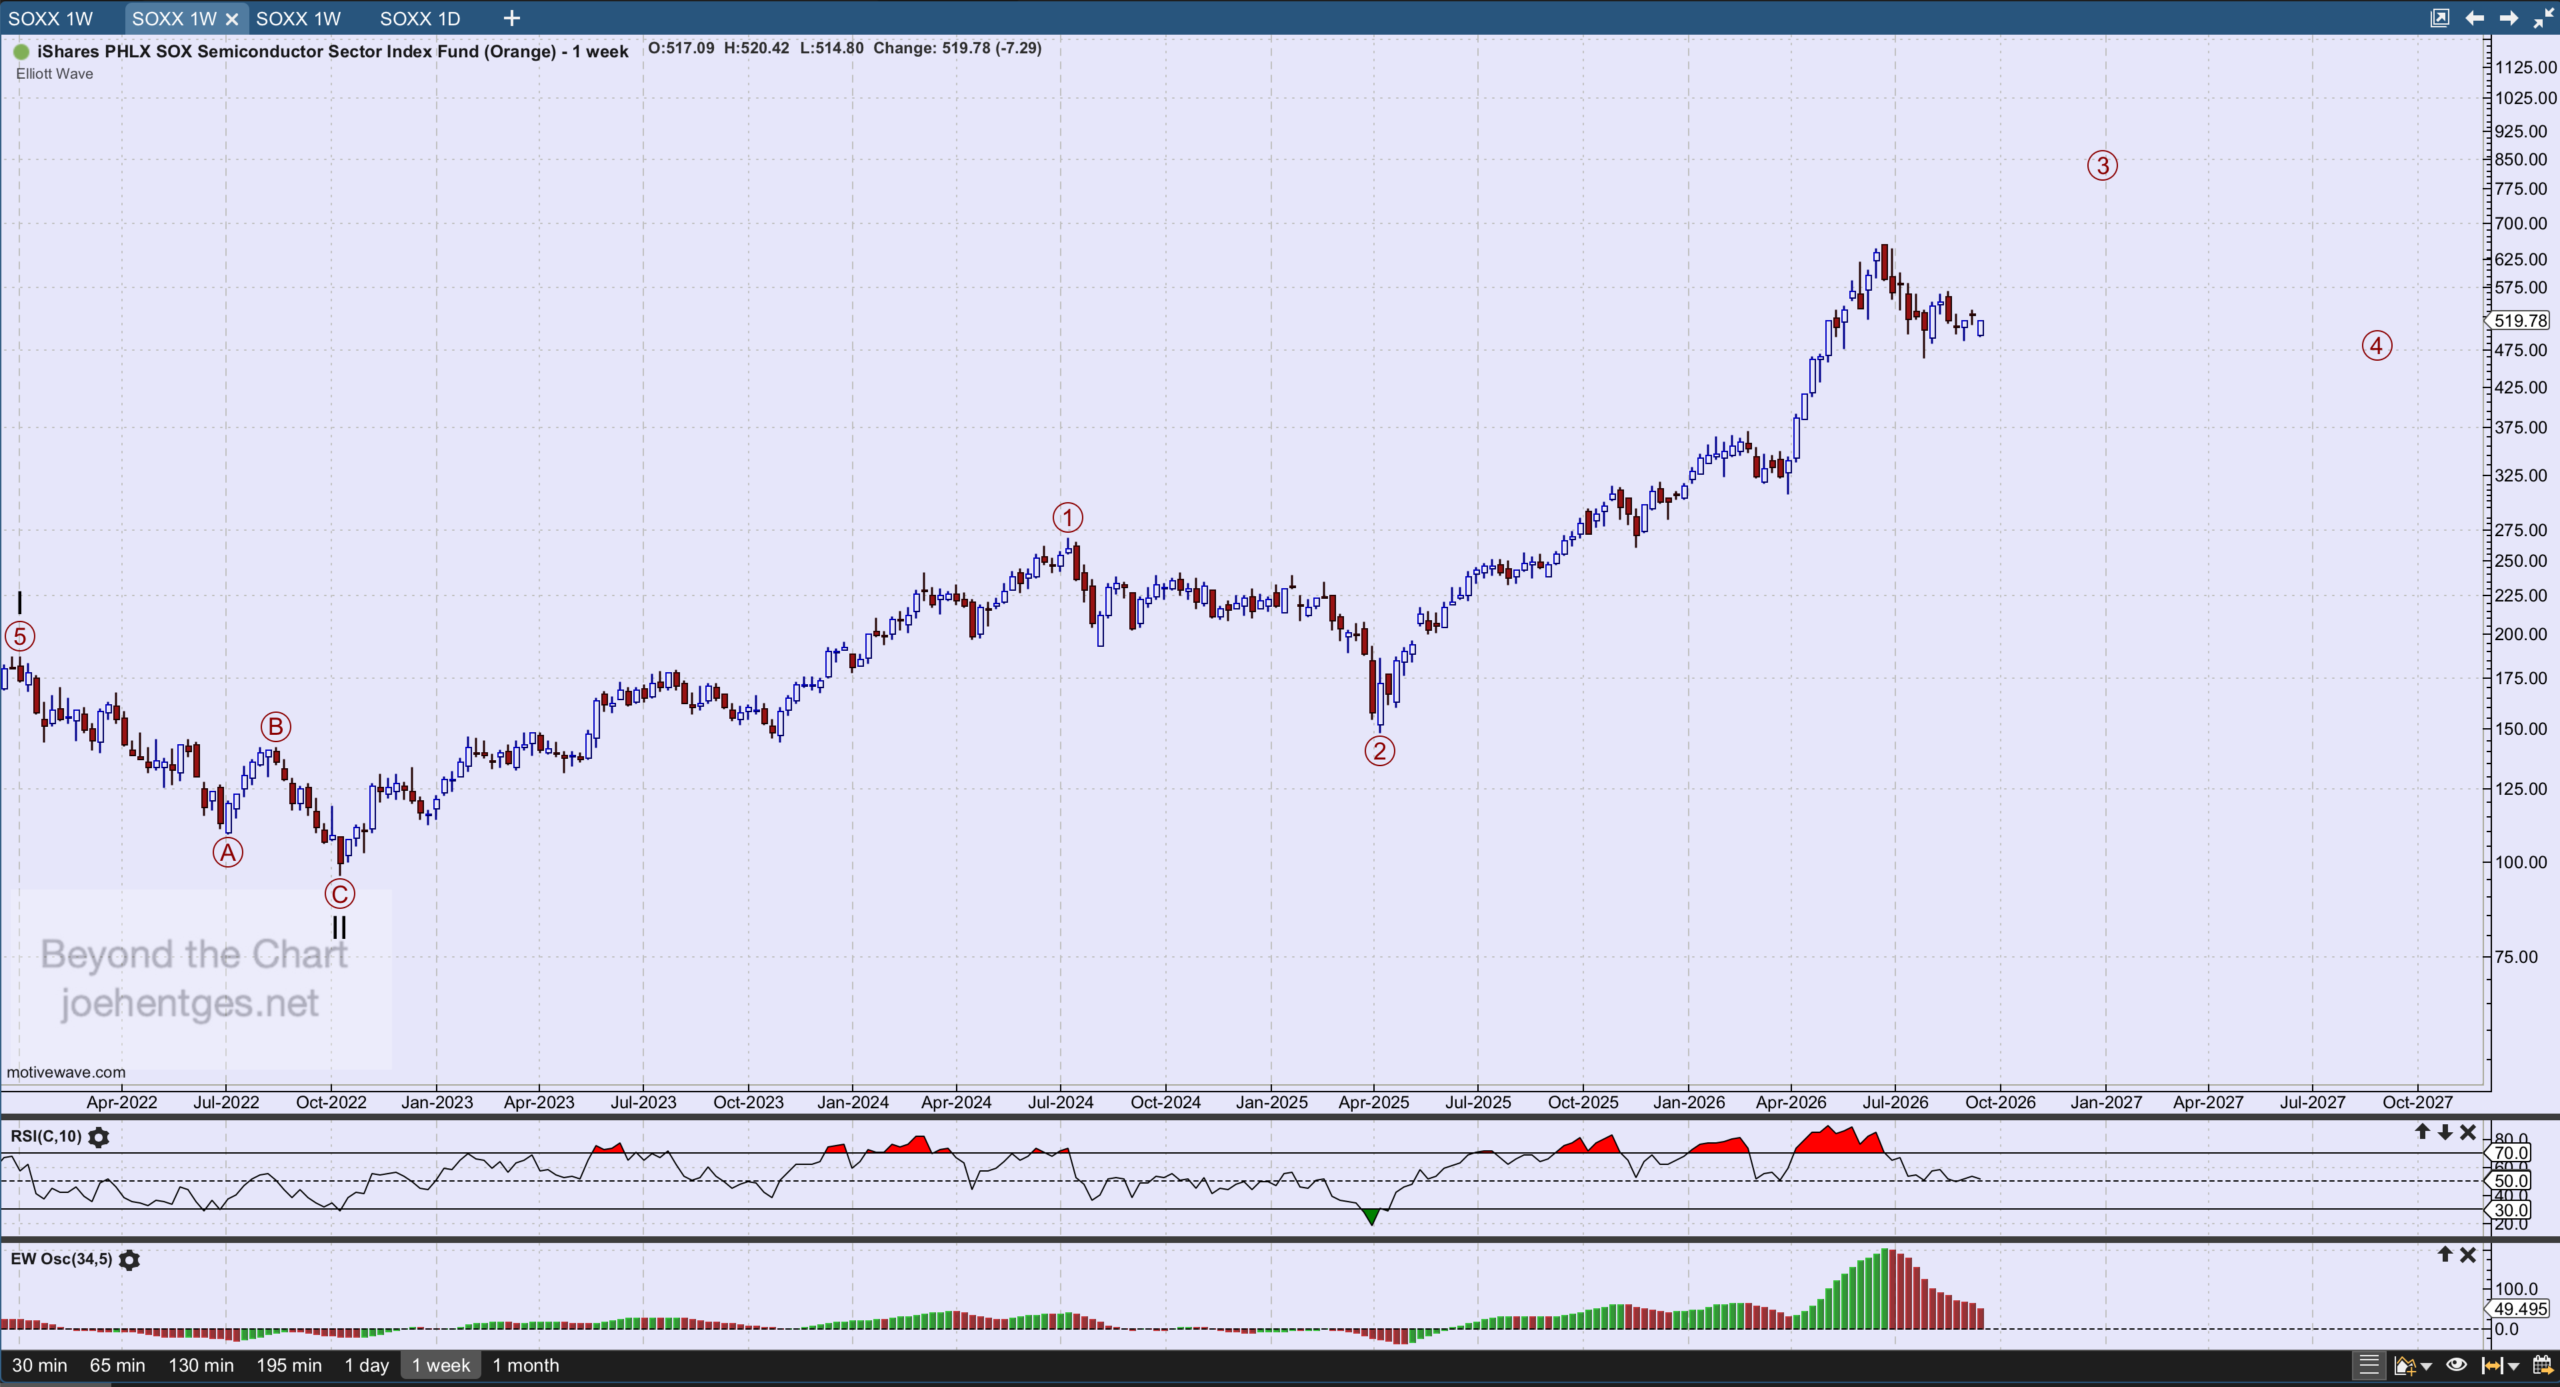
So now let’s focus on Cycle Wave III. This began with the low of 95.94 the week of October 9, 2022.  We are currently in Primary Wave 3 (circled) and it doesn’t look complete. Based on Fibonacci relationships my target for Primary Wave 3 is 778.  But first let’s zoom-in to see how the waves are unfolding.
The chart below shows Intermediate Waves (1), (2) and (3). Wave (3) shows the strong move from March 30 to May 11 as Minor 3 within Wave (3).  This fits perfectly, in that the 3rd wave within a 3rd wave is typically the strongest wave. Minor wave 5 is an ending diagonal with Wave (3) peaking on June 22.

This chart also shows the percentage retracements of Wave (2) and Wave (4).  Wave (4) looks complete and was a deep retracement of Wave (3), almost 50%.  This makes sense when viewed in comparison to the very shallow retracement of 23.6% for Wave (2). 
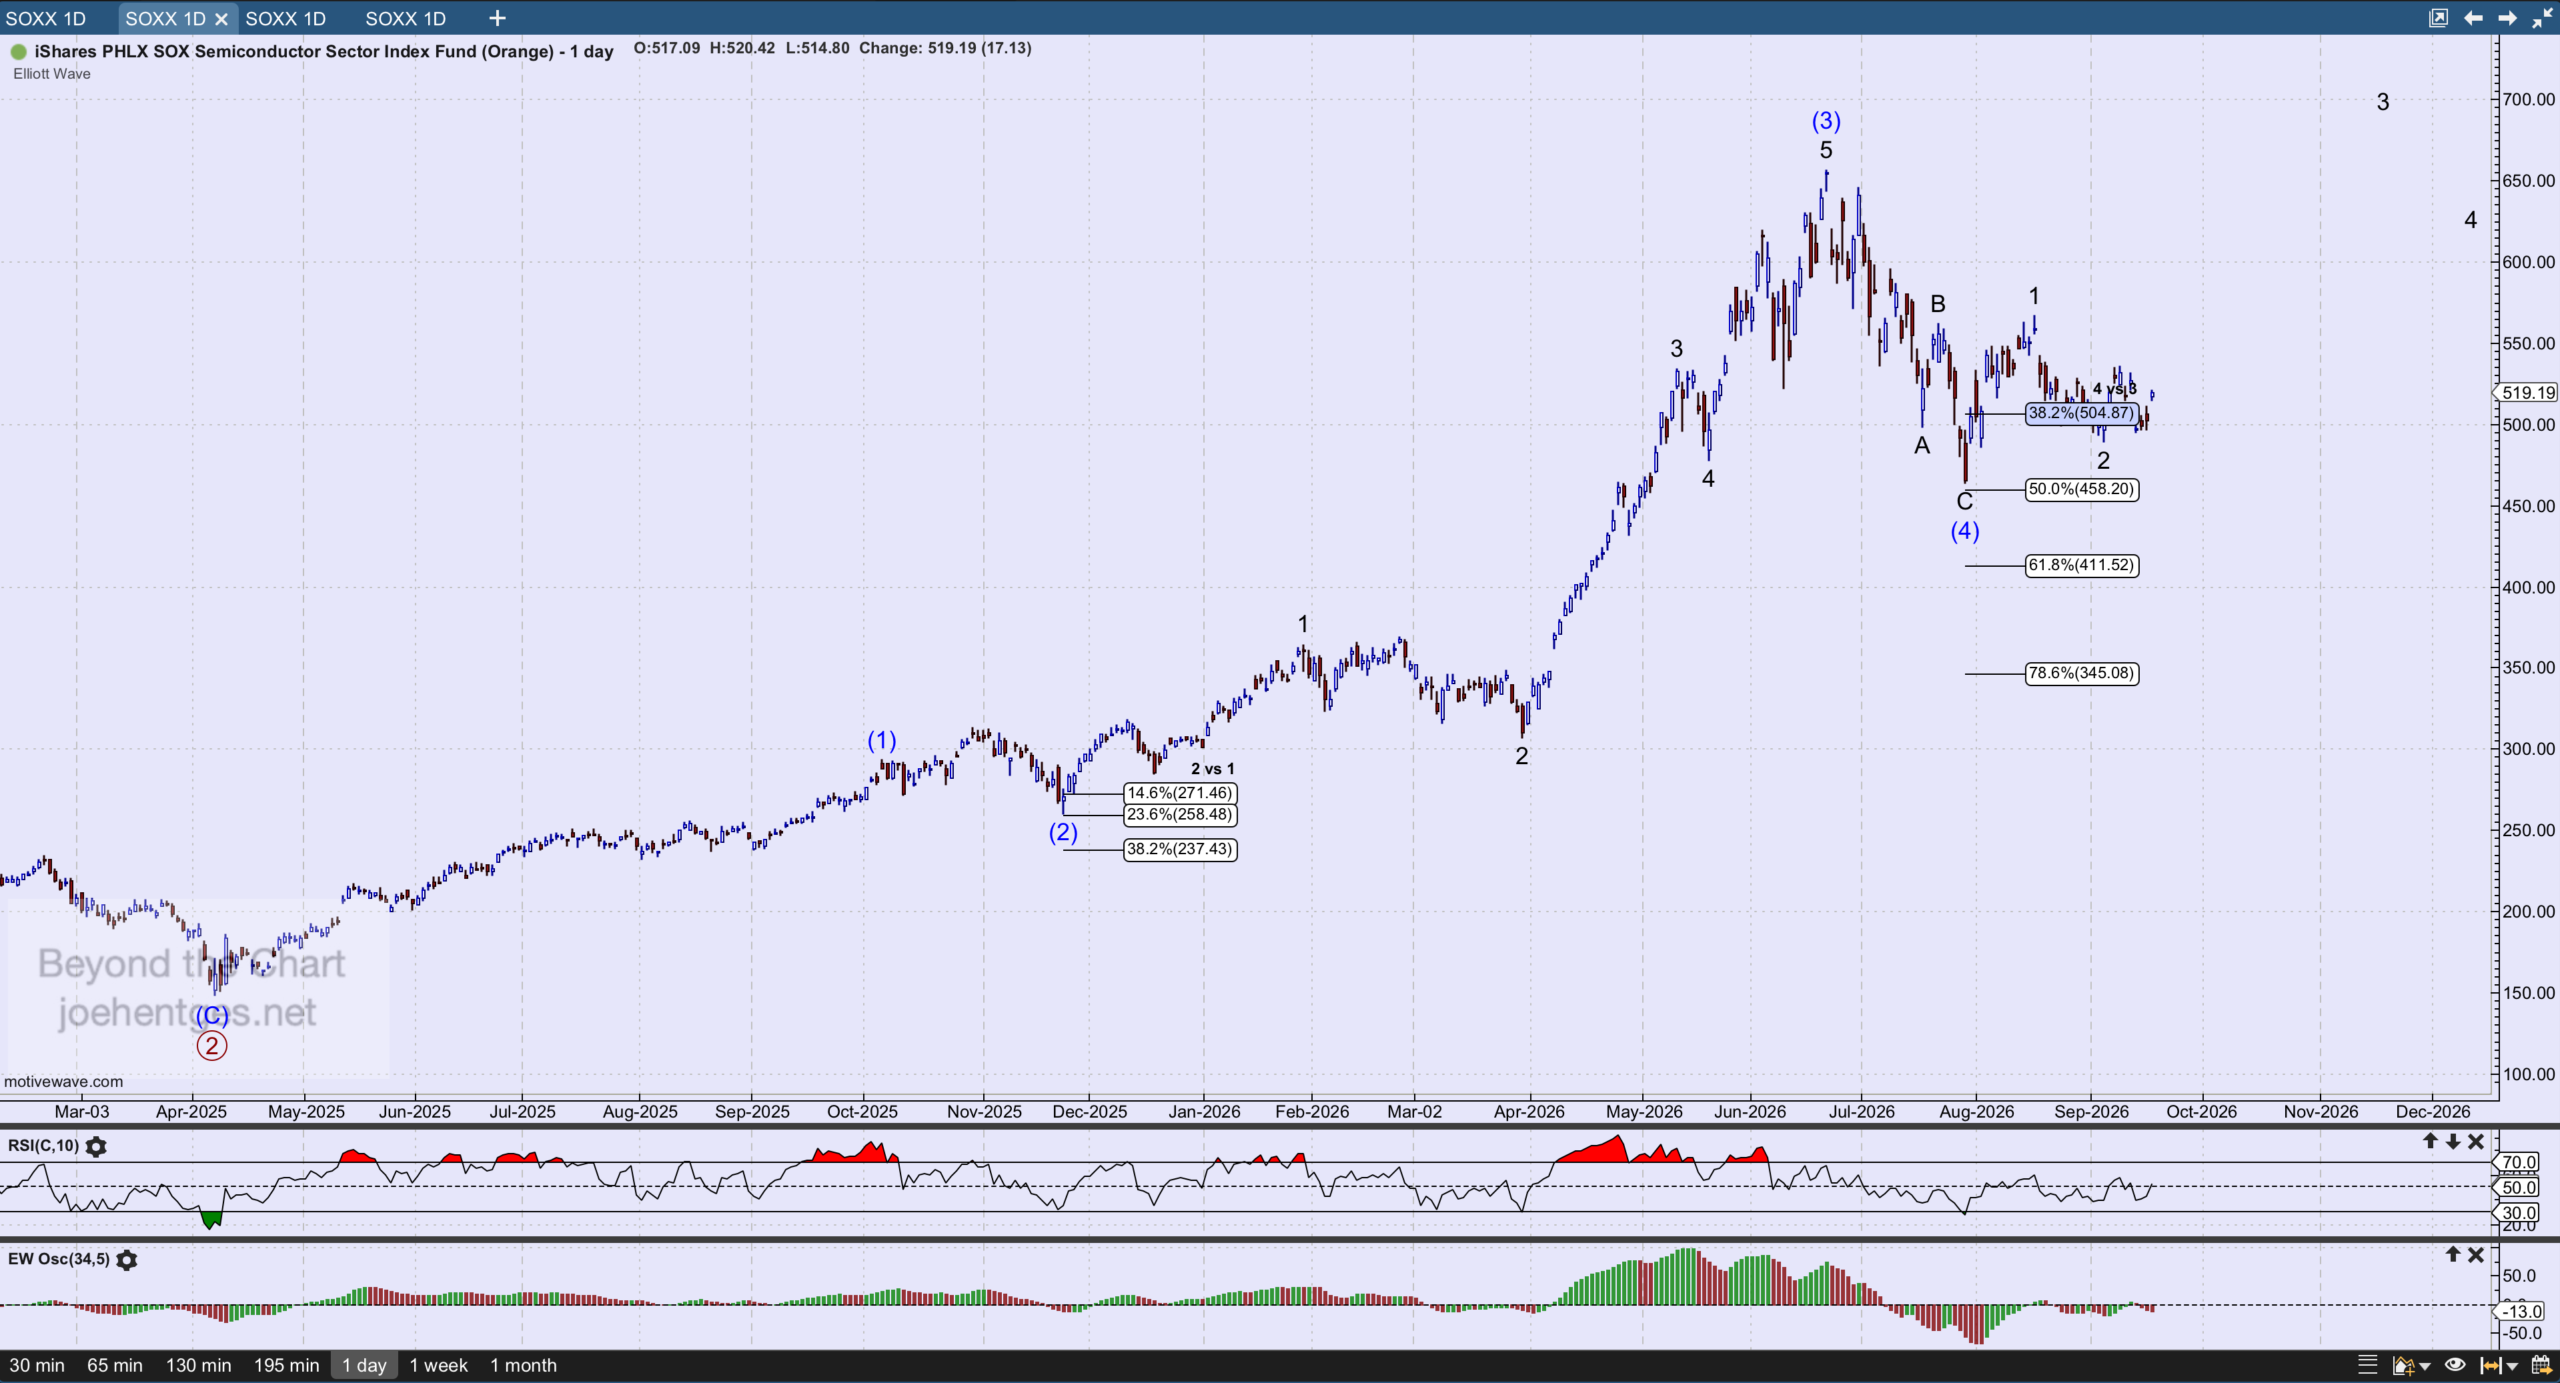
Right now I believe SOXX has completed the first two waves of Wave (5).  Wave 1 broke above the minor peak of Wave B and did so in what looks like a five wave Leading Diagonal Wave 1. Wave 2 made a deep retracement of Wave 1 and if indeed this is complete, prices should push above the August 17 high of 566.02 fairly quickly.  

This image below was taken about mid-day on Thursday September 17.  Where I’ve placed Minor 3 and 4 in the chart are not predictions of timing.
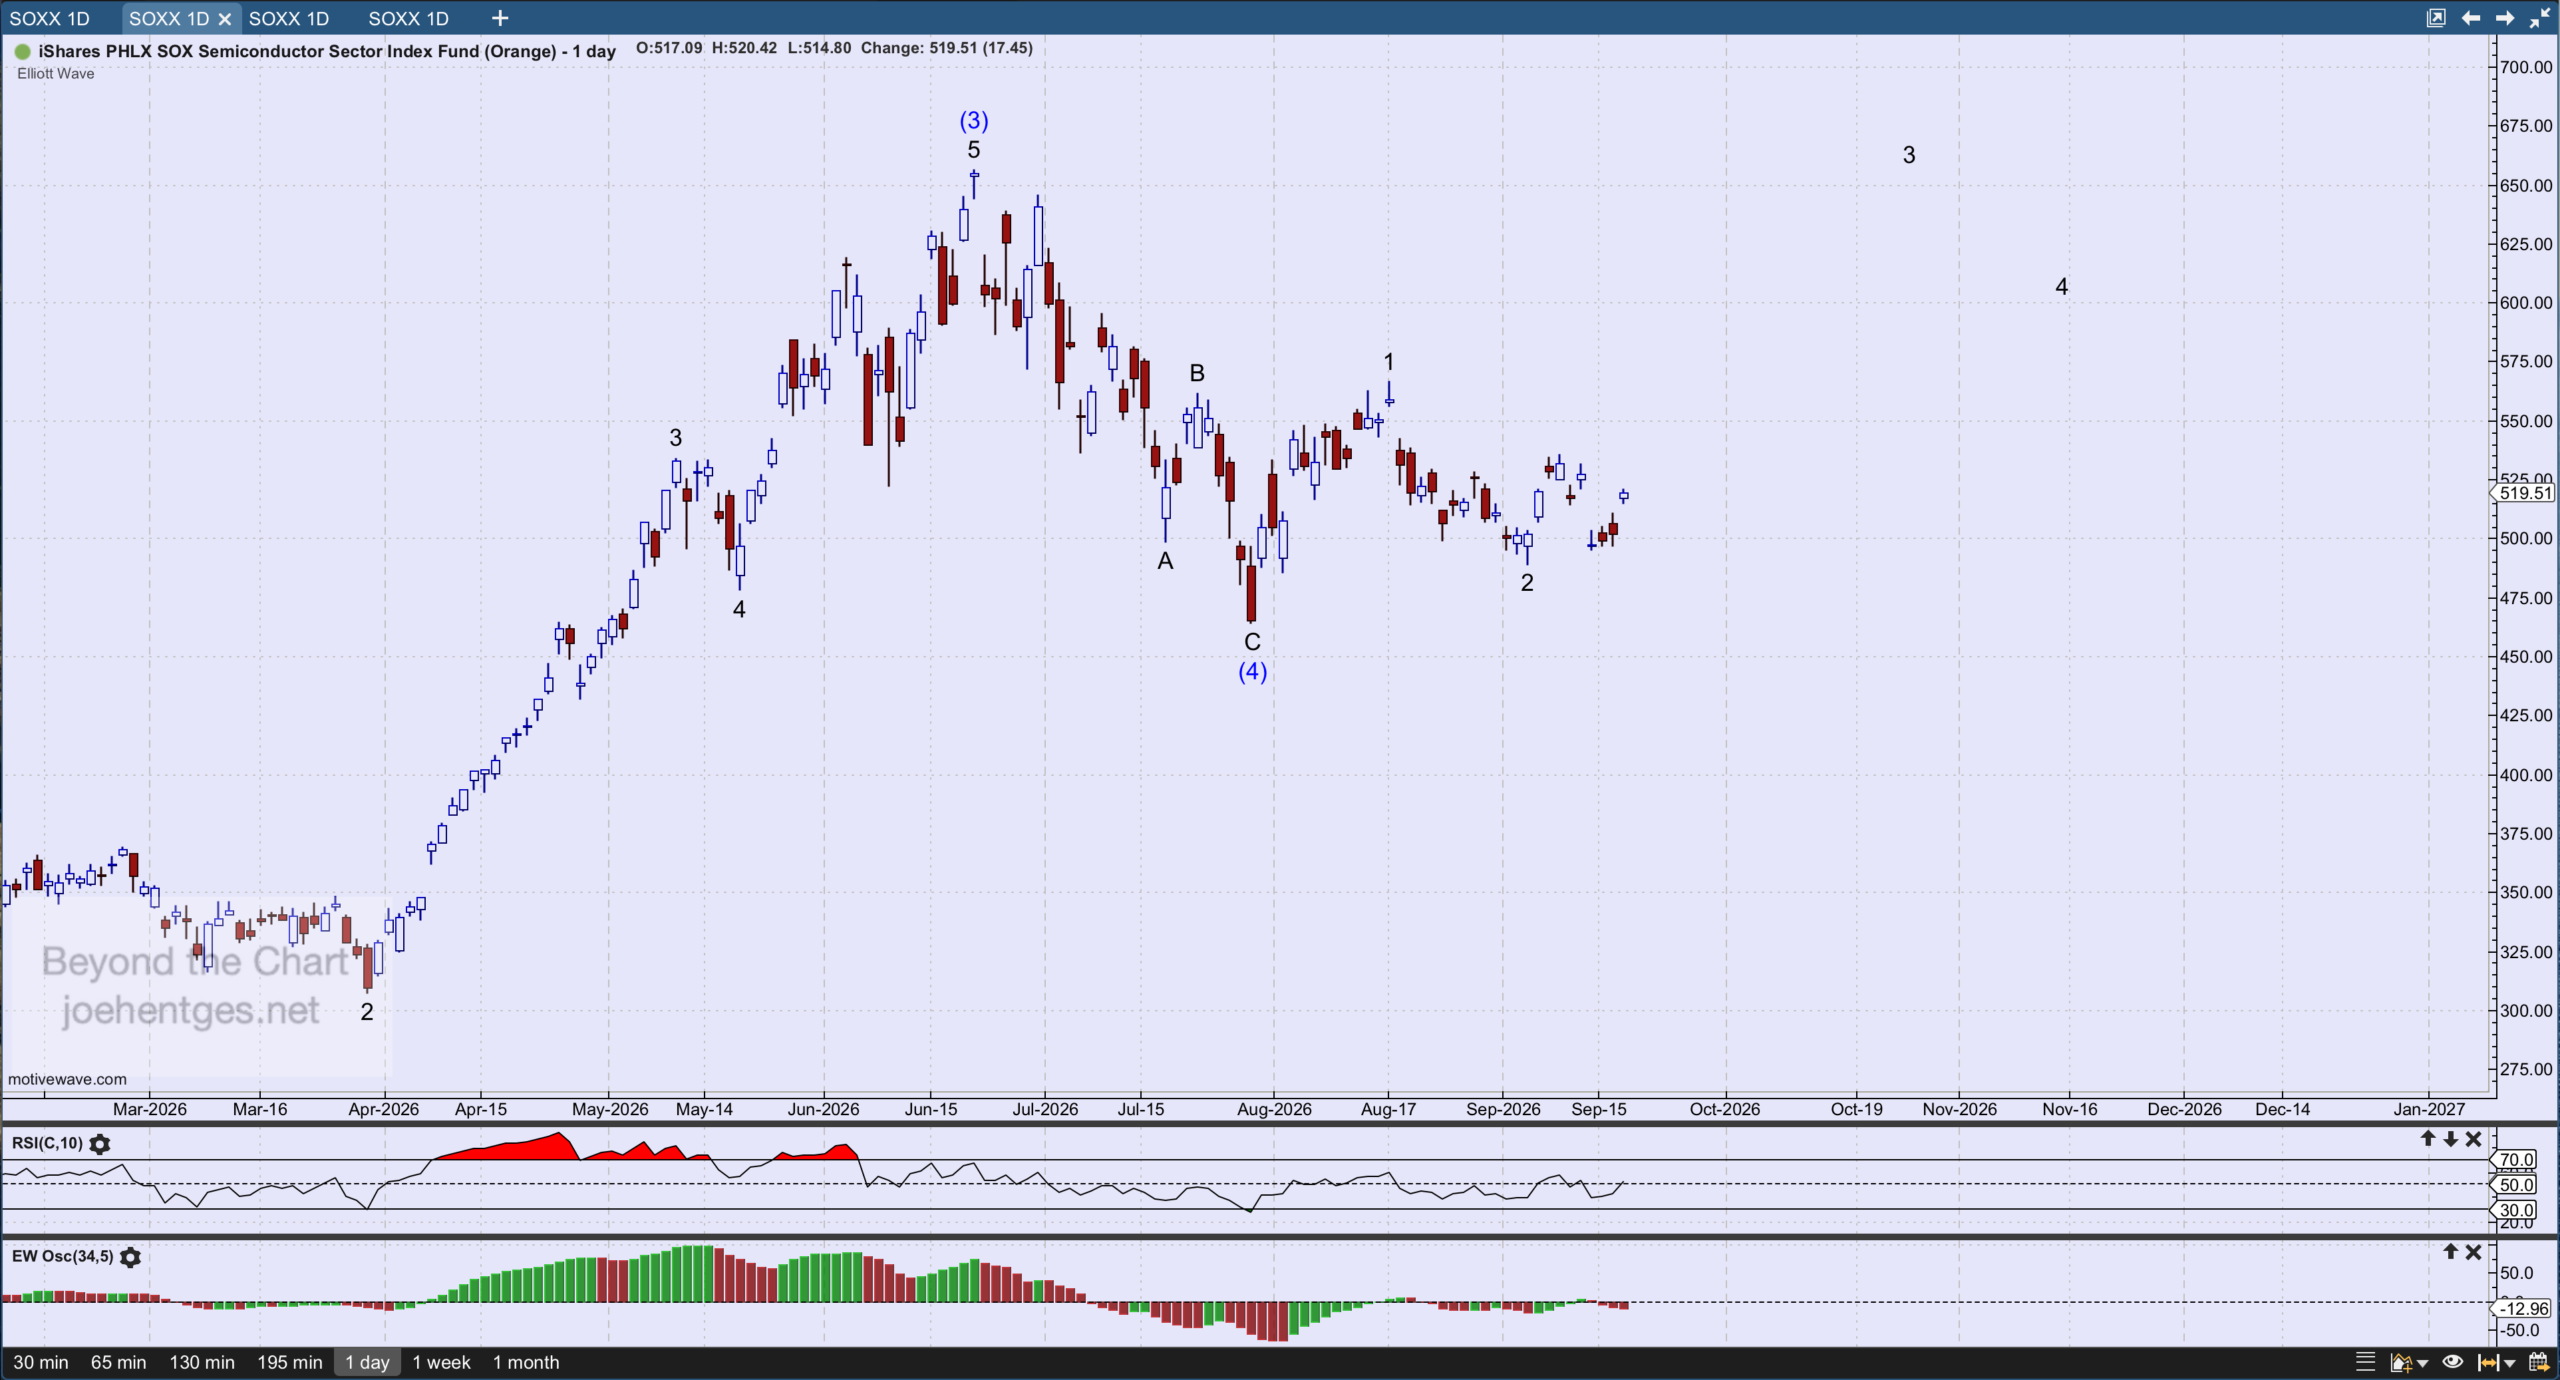
So in conclusion, semiconductors as measured by SOXX show there is much more to come.  The Elliott Wave patterns are laid out, let’s see how the price action unfolds.

Dell’s Monster Quarter — Fuel for Wave 3, or a Bull Trap?

Last week, one earnings report stopped the market in its tracks.

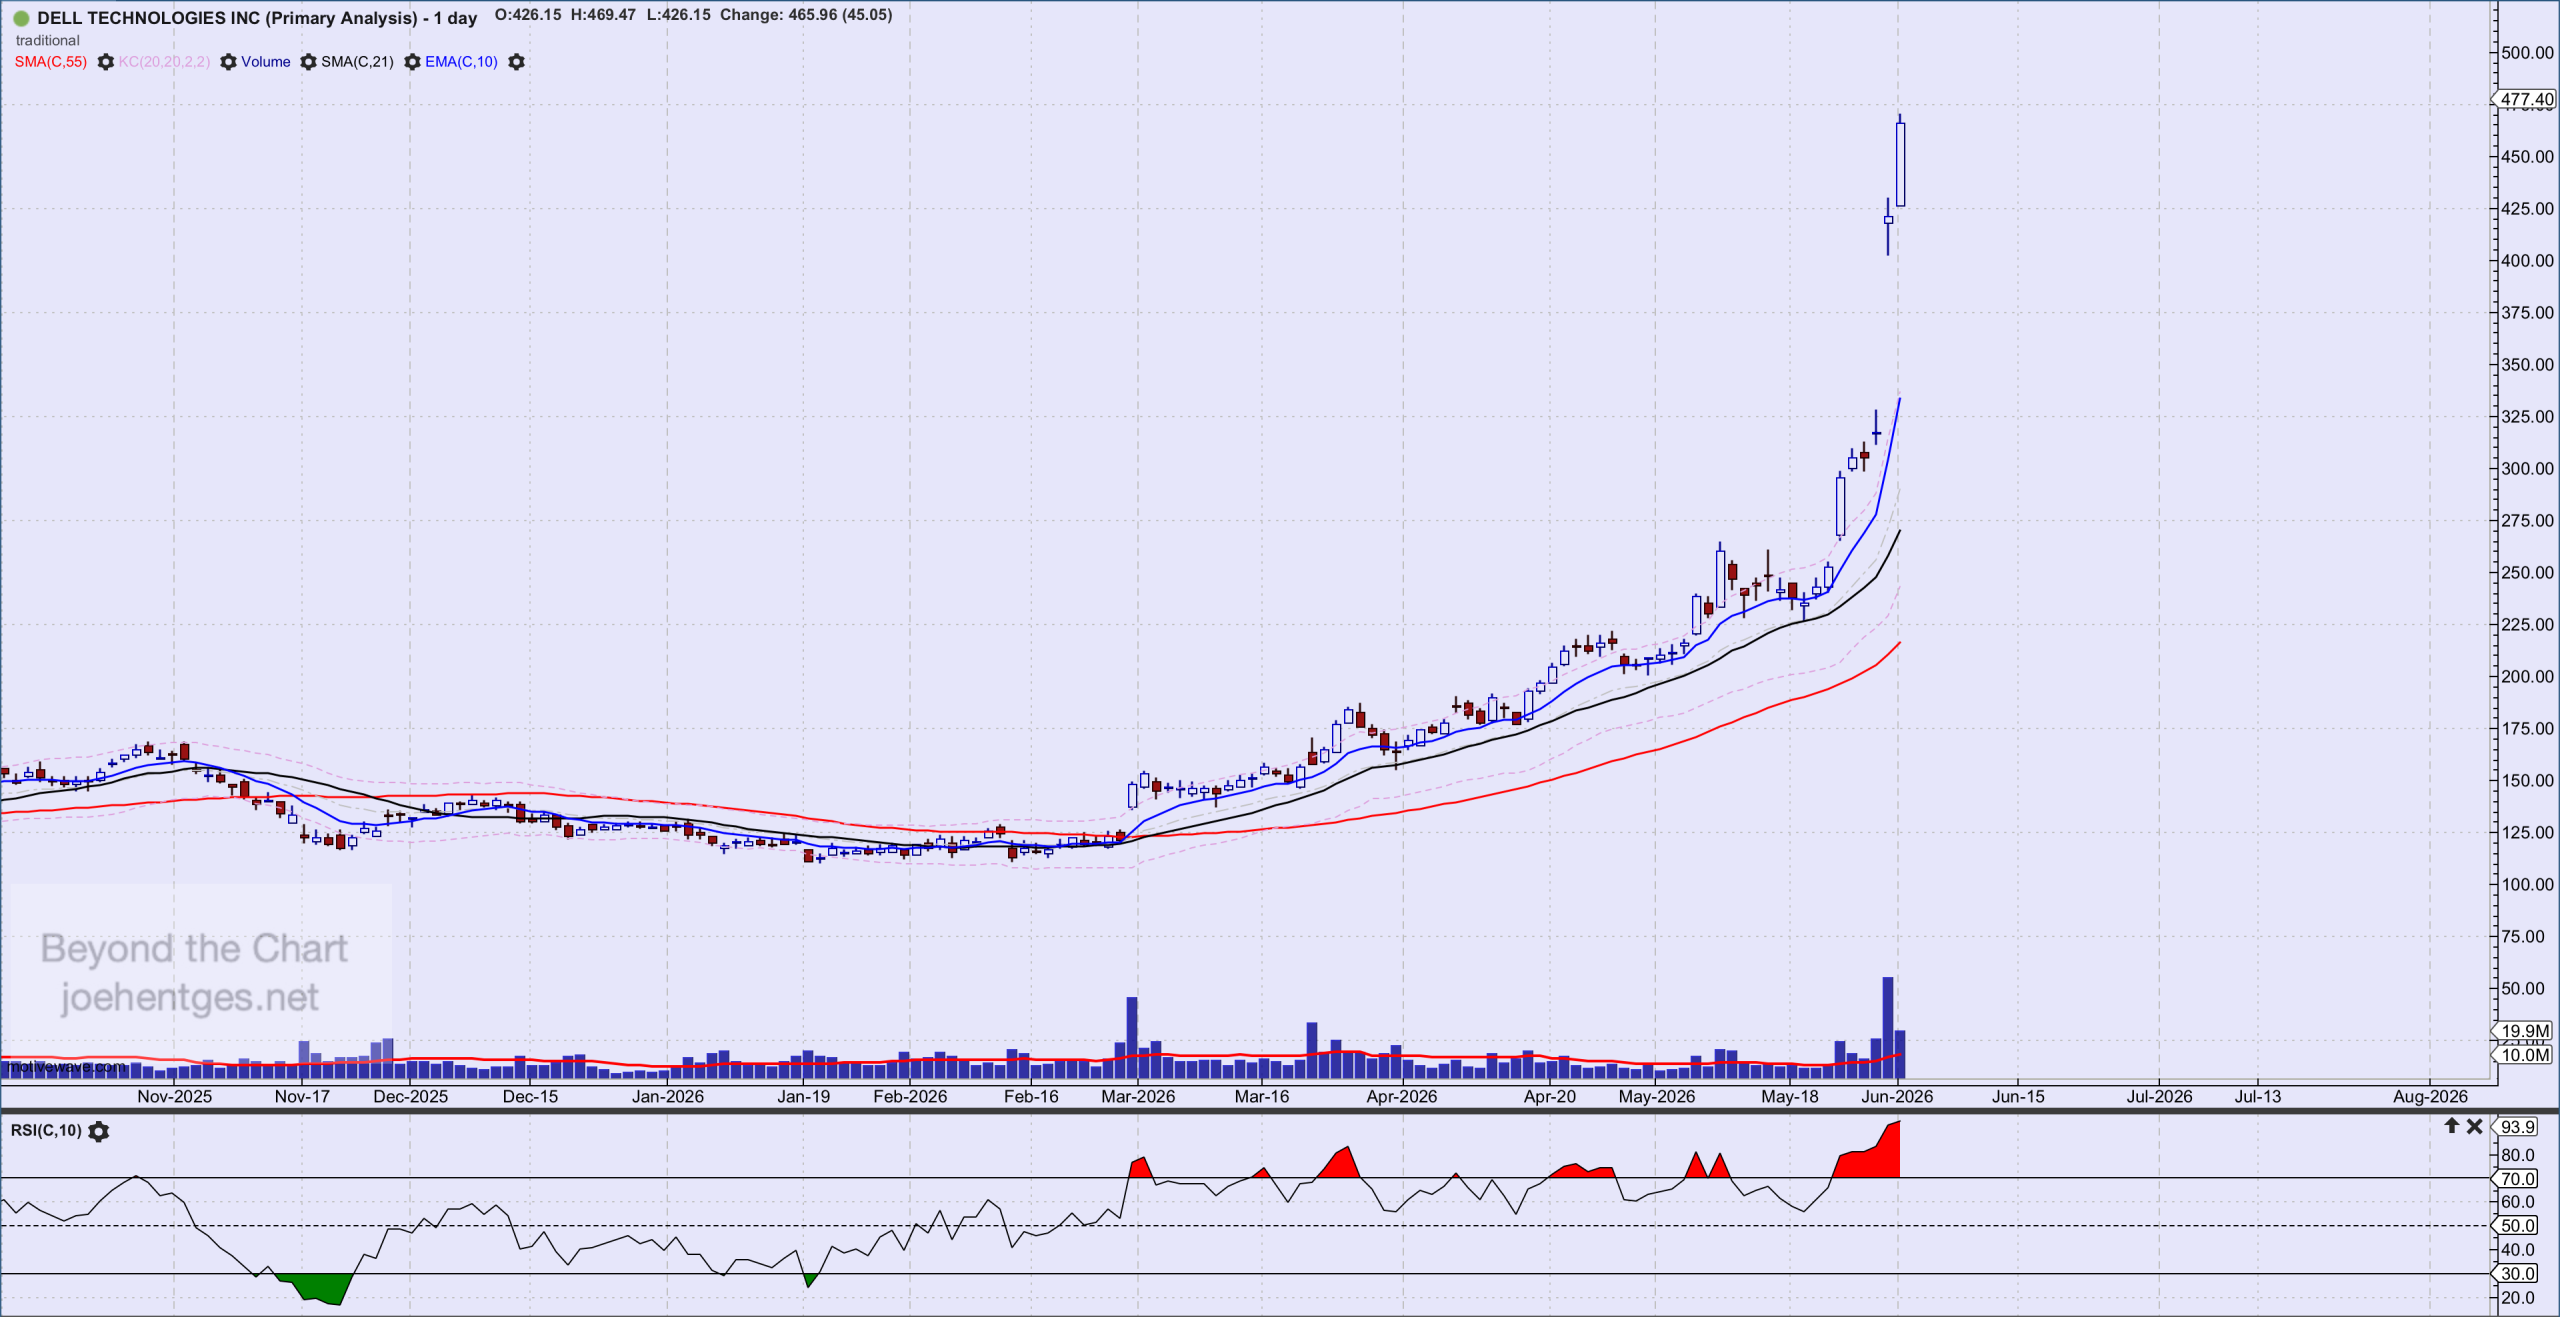
Dell Technologies posted its best single day in company history — up nearly 33% on Friday, May 29 and it continued on Monday June 1, up another 10.7%.

Quarterly revenue soared nearly 88% year over year. AI server revenue alone jumped 757% from a year earlier to $16.1 billion. The stock is now up over 200% in 2026.

Wall Street was caught flat-footed. Again.

So where does this fit in the bigger picture?

Data thru June 1


The Elliott Wave Context

In my April post I described a potential Wile E. Coyote moment — a market running on momentum ahead of economic reality. At the time, the S&P 500 was about 10% off its low, and I was watching for a rally that could extend into late April or early May.

That rally didn't just extend — it kept going.

The S&P 500 just posted its ninth consecutive weekly gain, closing May at record highs above 7,580. The Dow crossed 51,000 for the first time ever. These aren't the numbers of a bear market bounce.

From an Elliott Wave perspective, this has the look and feel of a Wave 3 — usually the most powerful and extended move in a 5-wave impulse. Wave 3s are characterized by accelerating momentum, and fundamental news that confirms what the chart was already showing. Dell's earnings report is exactly that kind of confirmation.

What's especially notable is the breadth of the move. It's no longer just Nvidia. Micron, Qualcomm, ServiceNow, Datadog, HP — the whole AI ecosystem caught a bid last week. Broadening participation is a Wave 3 signature.

The Decade Cycle Alignment

This also fits neatly with the Decade Cycle work I've done.

We are in Year 6 of the 2021–2030 decade. Historically, nine of the last ten decades saw their high occur in Years 6–10. The middle years — 4 through 6 — were positive in all ten decades studied. We are right on schedule.

The Roaring Twenties analog I wrote about last year is also worth revisiting here. In the 1920s, the big mid-decade thrust came in 1925 — Year 5 of that cycle — and launched the market into its famous blowoff into 1929. We could be entering a similar acceleration phase right now, with AI playing the role electricity and the automobile played a century ago.

The Dell quarter isn't an anomaly. It's a data point that says the infrastructure buildout is real, it's large, and it's accelerating.

What to Watch

That said, I'm not abandoning caution.

Nine straight up weeks creates conditions for a pause or short-term pullback — even in the strongest Wave 3 advances. Wave 3 doesn't go straight up forever. There will be corrections along the way, and they can feel alarming even when the larger trend is intact. 

Key levels I'm watching on the S&P 500:

  • 7,517 — May 14 high
  • 7,338 — first key support level, break of this level means first meaningful correction underway.

Consumer sentiment also remains a wildcard. The University of Michigan's May reading was revised down to 44.8 — lowest reading ever recorded, that doesn't match the market's exuberance. That divergence is something to monitor. Supply shocks from tariffs and the Middle East haven't fully fed through to prices yet. The Wile E. Coyote risk hasn't disappeared — it's just been deferred.

Bottom line:

Dell's quarter looks like Wave 3 fuel — the kind of fundamental confirmation that shows up when a major advance is underway, not when it's ending.

The Decade Cycle, the Elliott Wave structure, and now the earnings data are all pointing in the same direction.

The high for this decade is still ahead of us.

But so is the volatility.

Are Stocks in a Wile E. Coyote Moment?

The market has staged an impressive rebound since the March 30 low. The S&P 500 is now up roughly 10% from that close—no small move in a short period of time.

For several weeks, I’ve been watching for a rally that could carry into late April or early May. It appears that move is now underway.

This morning, I read John Authers’s column, “Why stocks are breaking free of oil crisis tyranny.” It covers a wide range of important macro forces, but one idea stood out.

Near the end, he references Peter Orszag,CEO of Lazard who described the current environment as a potential “Wile E. Coyote moment.”

Supply shocks take a very long time to feed through into prices. That was true for Covid. It’s true with tariffs. It will be true with the Middle East.

In other words: markets may be running ahead of reality—like Wile E. Coyote sprinting off the cliff, not yet realizing there’s no ground beneath him.

That analogy grabbed my attention.

Right now, stocks appear to be levitating on momentum, optimism around renewed negotiations, and a market that wantsto go higher. But if Orszag is right, the real economic impact of recent shocks hasn’t fully surfaced yet.

So what does that mean?

I’m not calling for a crash here.

But I am expecting more corrective price action.

The 2022 correction lasted roughly 10 months. This current corrective phase—starting from the October 29 high—is only about five months old.

Based on my Elliott Wave work and prior cycle behavior, it’s likely we still have more work to do—both in time and price.

Bottom line:

The rally is real. The momentum is strong.

But the story may not be finished.

And if this is a Wile E. Coyote moment…

the market just hasn’t looked down yet.

Echo of the Roaring Twenties in Today’s Market Boom


The idea that the 2020s stock market could echo the 1920s stock market is a provocative one—and it’s not without basis.

Background

Post-Crisis Boom

  • 1920s: Economic surge after WWI and the 1918 flu pandemic. The 1920s stock market surge didn't begin until the Depression of 1920-21 ended and the Federal Reserve lowered interest rates from 1921 until 1924.  There was also a significant tax cut implemented in the mid-1920s both for individuals and corporations.
  • 2020s: Rapid rebound following COVID-19 lockdowns, stimulus-fueled recovery. The Federal Reserve cut rates to essentially zero during the Covid Crash of February - March 2020.  They also expanded their balance sheet significantly in order to inject liquidity into the economy.  After raising rates to fight the rise of inflation, the Fed cut rates three times in late 2024, with possibly more on the way in 2nd half of 2025 and beyond.

Technological Revolution

  • 1920s: Mass adoption of radio, household electricity, automobiles, airplanes.
  • 2020s: AI, robotics, electric vehicles, biotech, and quantum computing.

Retail Investor Surge

  • 1920s: Increased public stock participation, often speculative on shoestring margins.
  • 2020s: Meme stocks, commission-free trading, Reddit/Robinhood frenzy.

Loose Monetary Policy

  • Both eras: Easy credit and low interest rates fueling asset bubbles.

Boom in Corporate Profits & Innovation

  • Tech-led productivity and earnings boosts in both eras.


Stock Market

How does the price action in the stock market compare? 

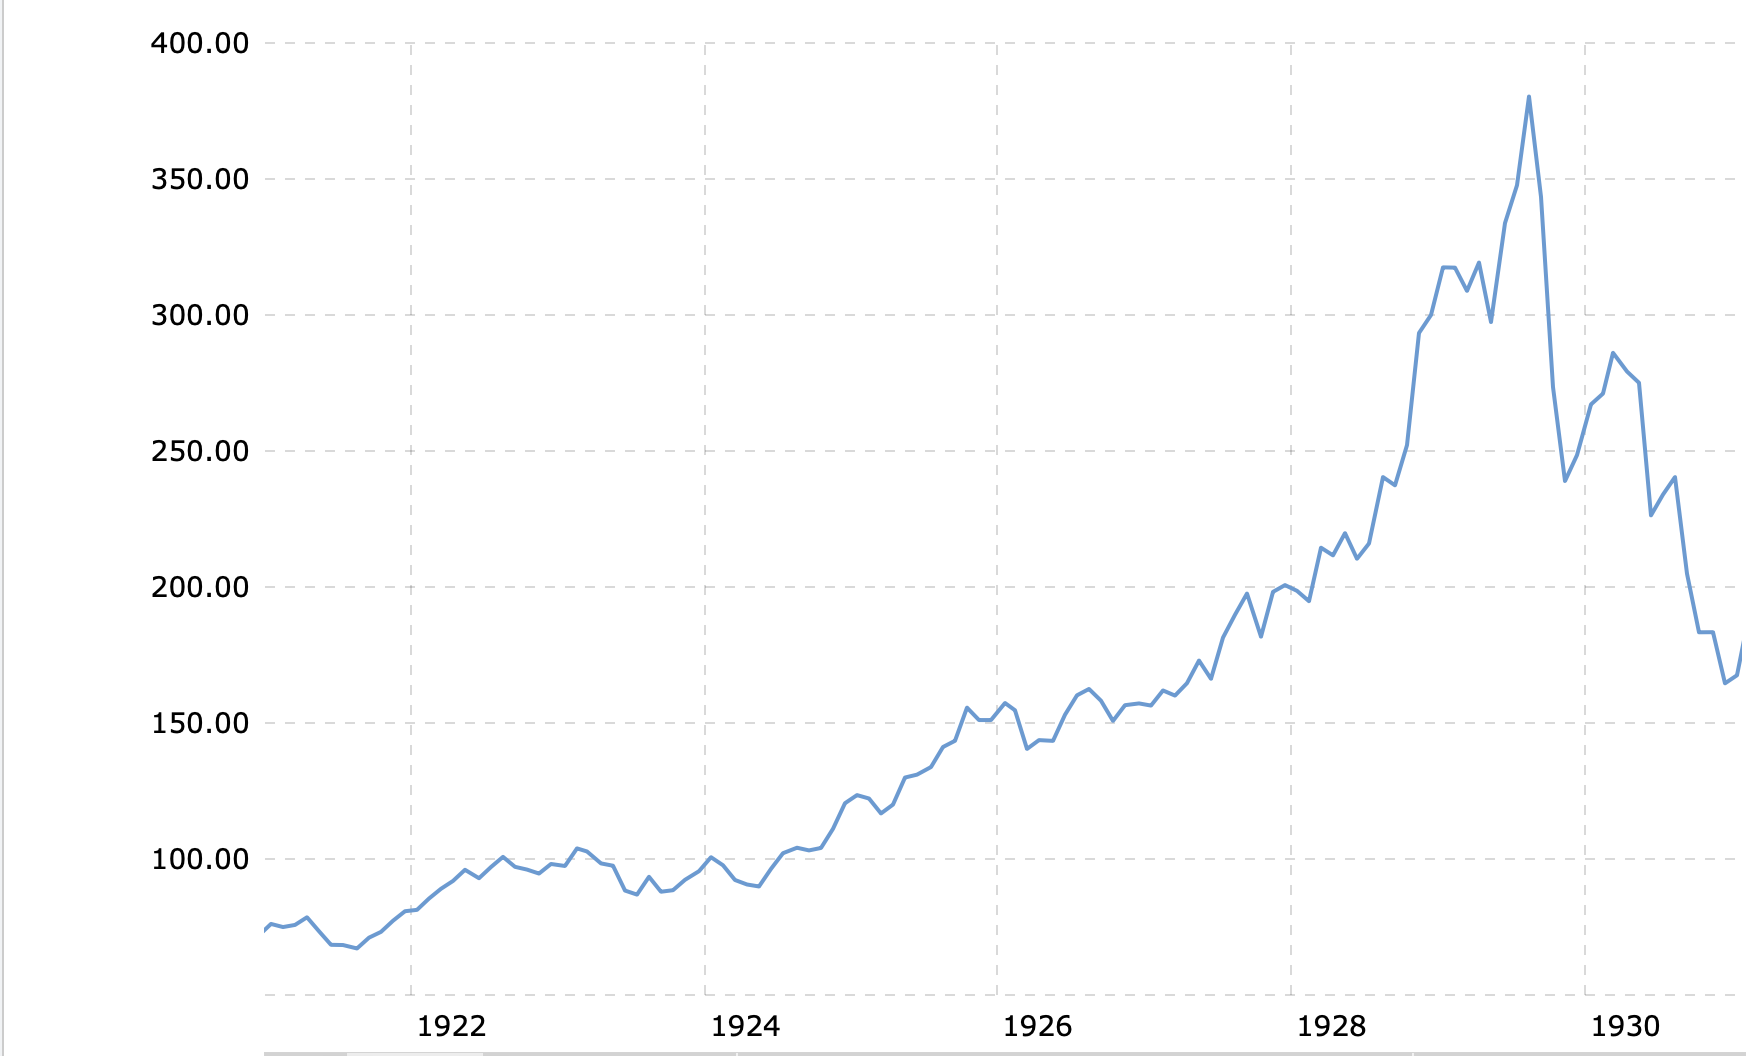
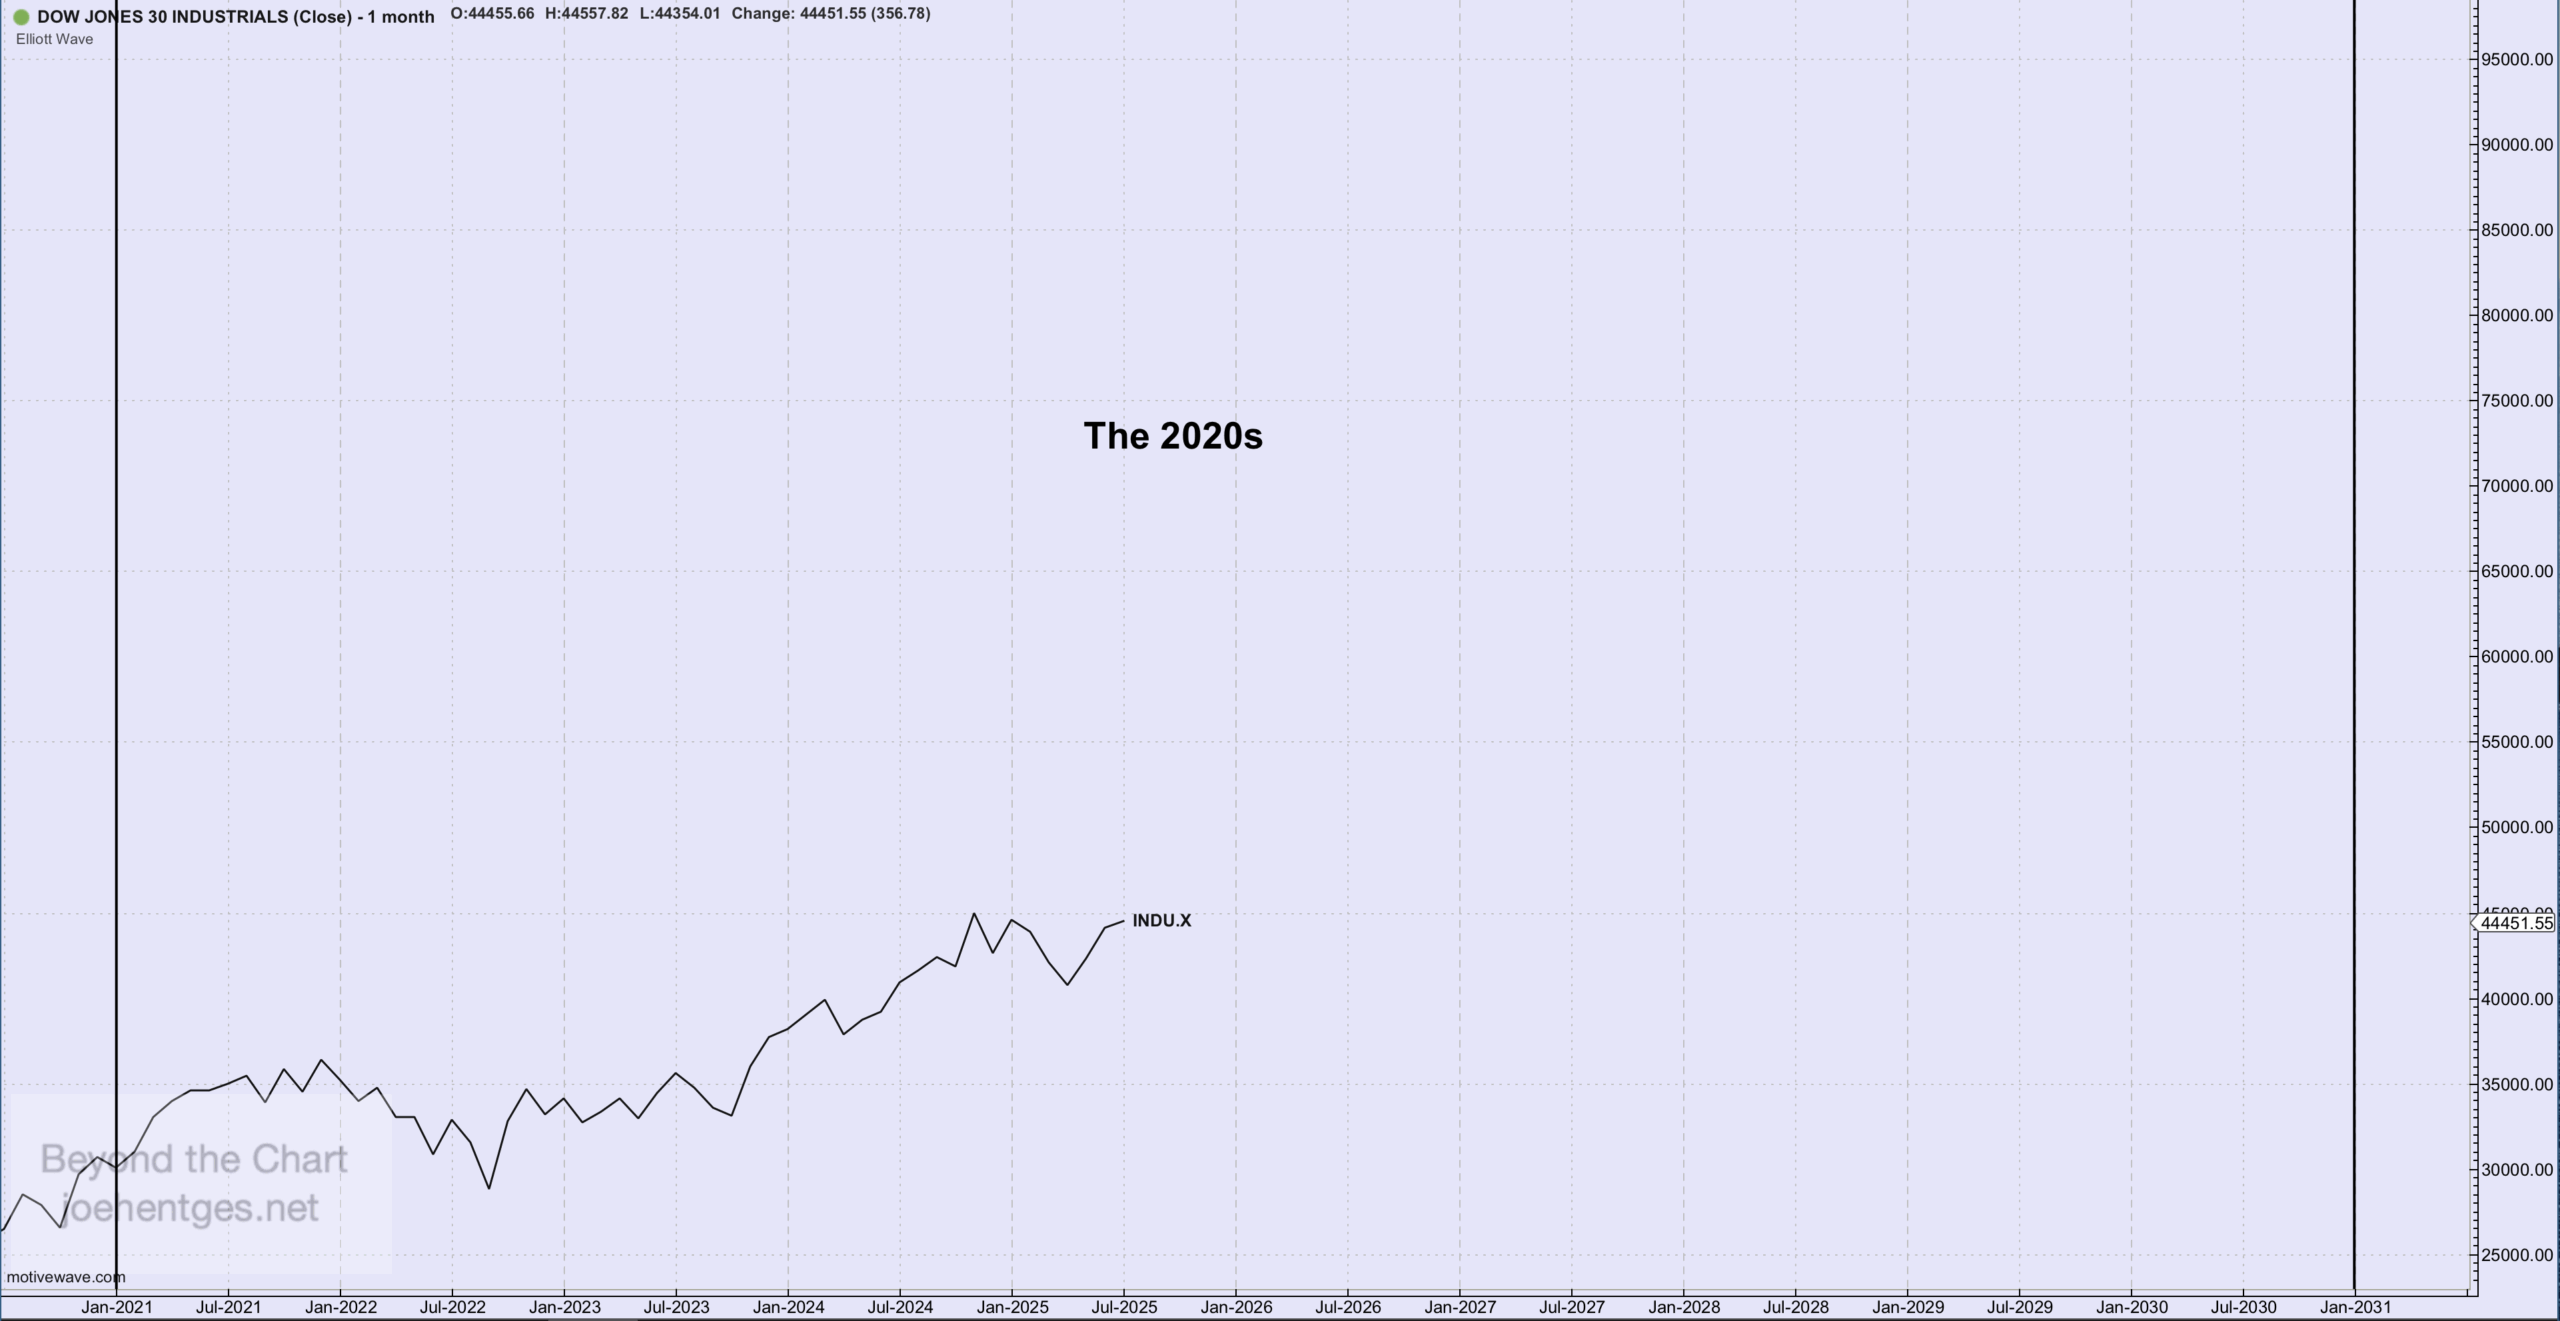
In the first chart below I show the close only Dow Jones Industrial Average for 1921 thru 1930.  In the second chart I show the results we have so far  for 2021 thru 2030.  Both charts are on arithmetic scale.  In the chart of the 2020s I stretched the scale to get it in sync with the degree of scale range that occurred in the 1920s.  I also moved the chart over to the right to align the timeline as close as possible.

In the 1920s the low for the decade occurred in 1921 with a strong upward push in second half of 1924 and throughout most of 1925. So far in the 2020s the low occurred in 2022 with a strong upward move starting in late 2023 lasting throughout all of 2024. So after the correction in early 2025, will the market mirror 1925 and push strong higher into 2026? 

It will indeed be very interesting to see what kind of an echo of the 1920s stock market we get in the 2020s.

Monthly Closes

Data thru July 1

1 2 3

Powered by WishList Member - Membership Software