

Semiconductor stocks had one heck of an explosive move from the end of March into mid-June. The VanEck Semiconductor ETF (SMH) went from a close of 362.53 on March 30 to a closing high of 668.91 on June 22. A whopping 84.5% in 57 trading days or about 2 ½ months.
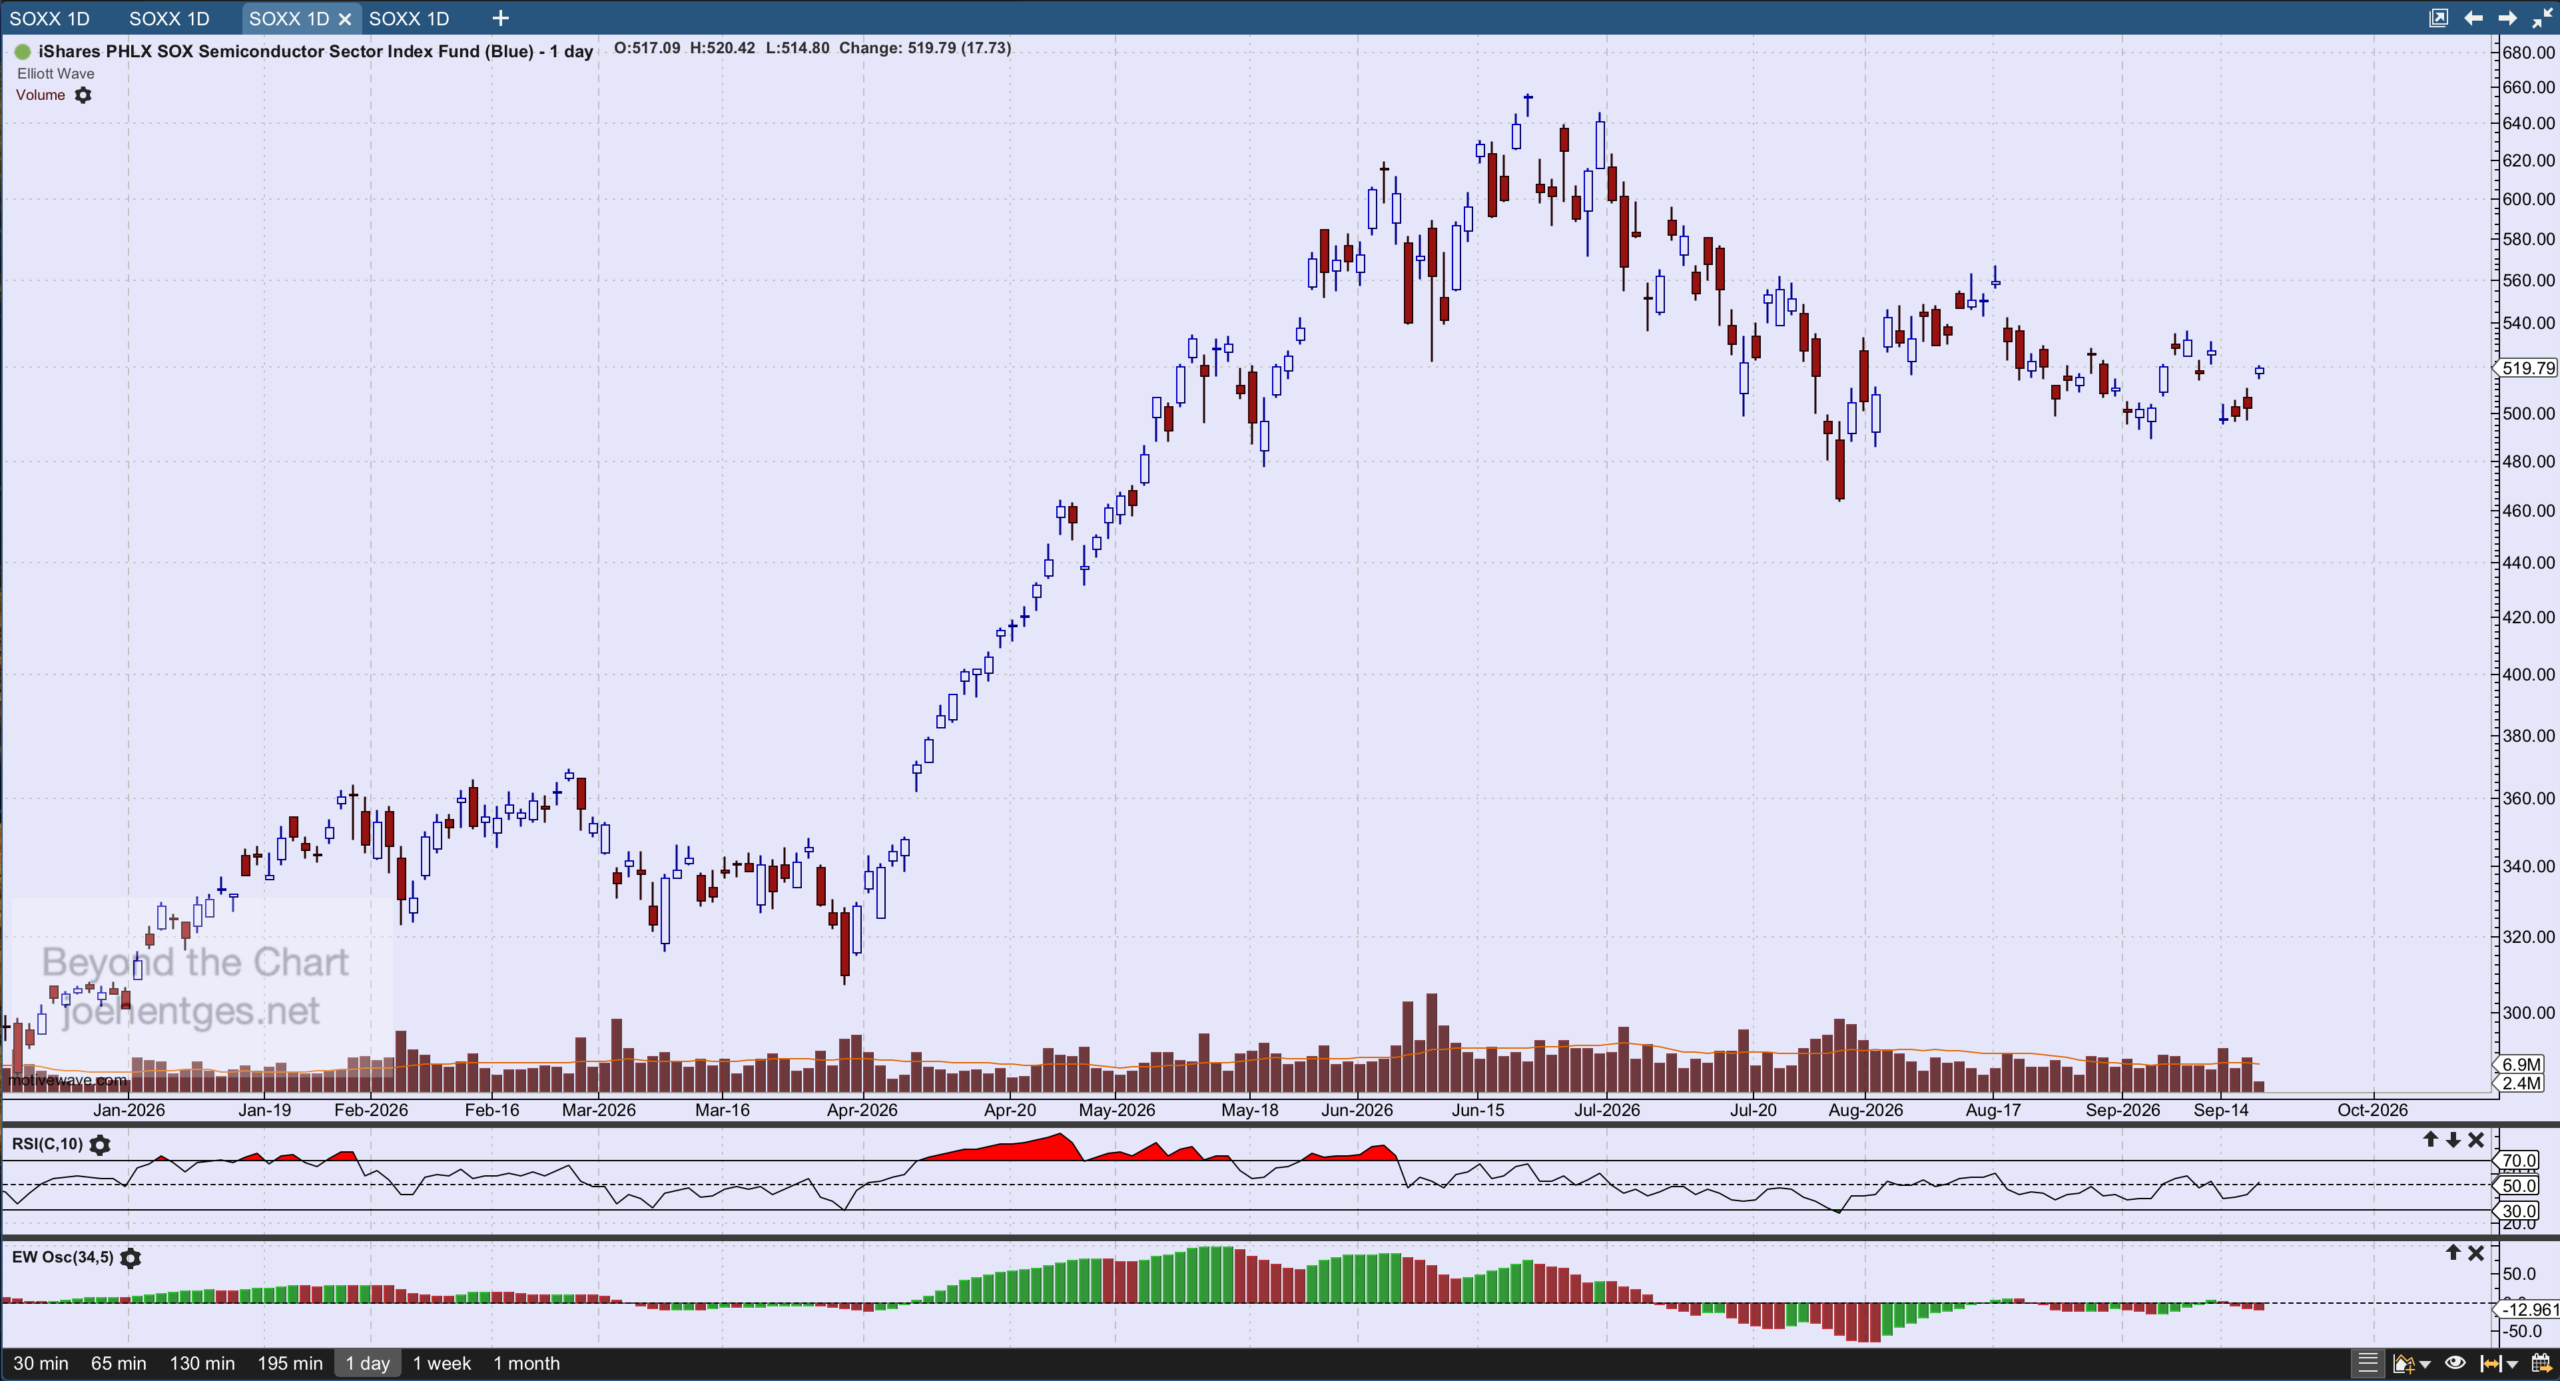
The iShares Semiconductor ETF(SOXX) did even better. It went from 309.79 to 655.01 in the same exact timeframe…up 111.4%. For purposes of this post I am focusing on SOXX. The chart above shows the explosive April – June move. With the closing low on July 29 of 465.00, the SOXX gave back 55% of the entire move up from March 30th.
Let’s take a look at the longer term timeframe to get a better perspective on where we are in the overall cycle.
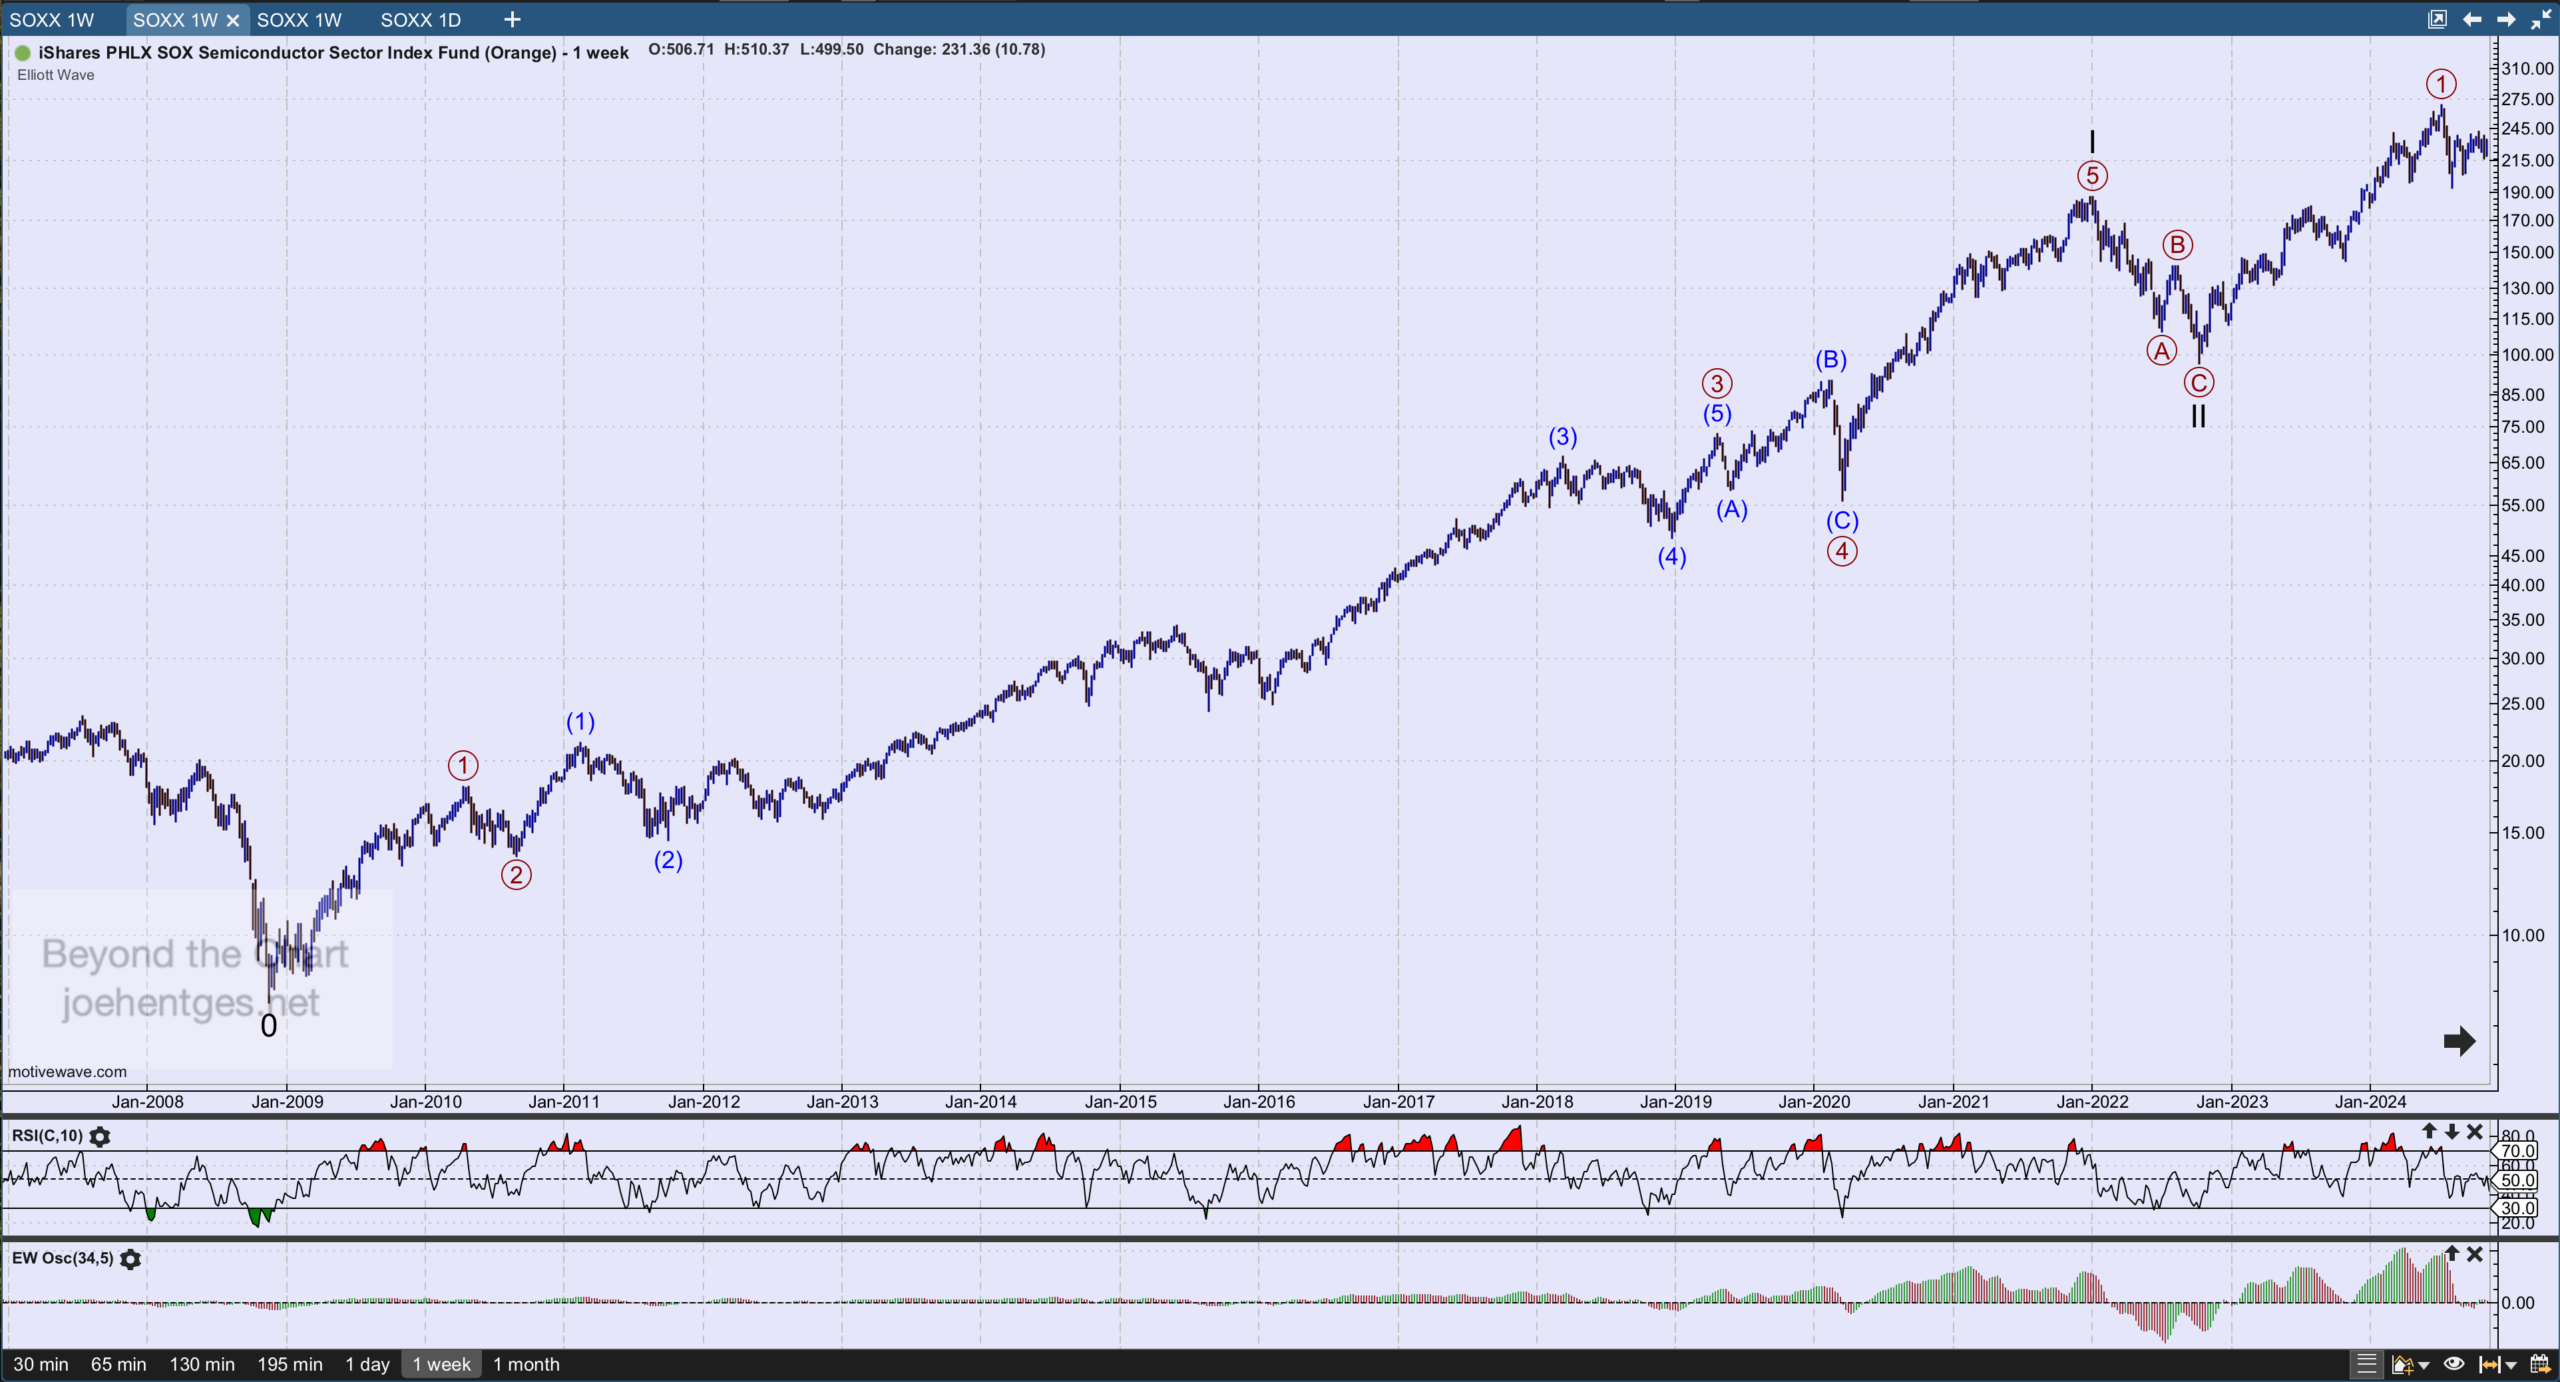
The latest major move for the semiconductors began at the low of 7.63 the week of November 16, 2008. Notice that this was 3 months before the stock market bottomed in March 2009.
The chart above focuses on what I believe are the first two major waves, Cycle Wave I and Cycle Wave II. Clearly there was an extended 3rd wave in Cycle I, therefore creating what most likely is an extended wave for Cycle Wave I.
When you look at Cycle Wave II, it seems to be a relatively short wave for a wave two. This is distorted due to the semi-log scale needed for the long-term picture. When the scale changes to linear you can clearly see that Cycle Wave II retraced 50% of the entire move of Cycle Wave I. This is shown below.
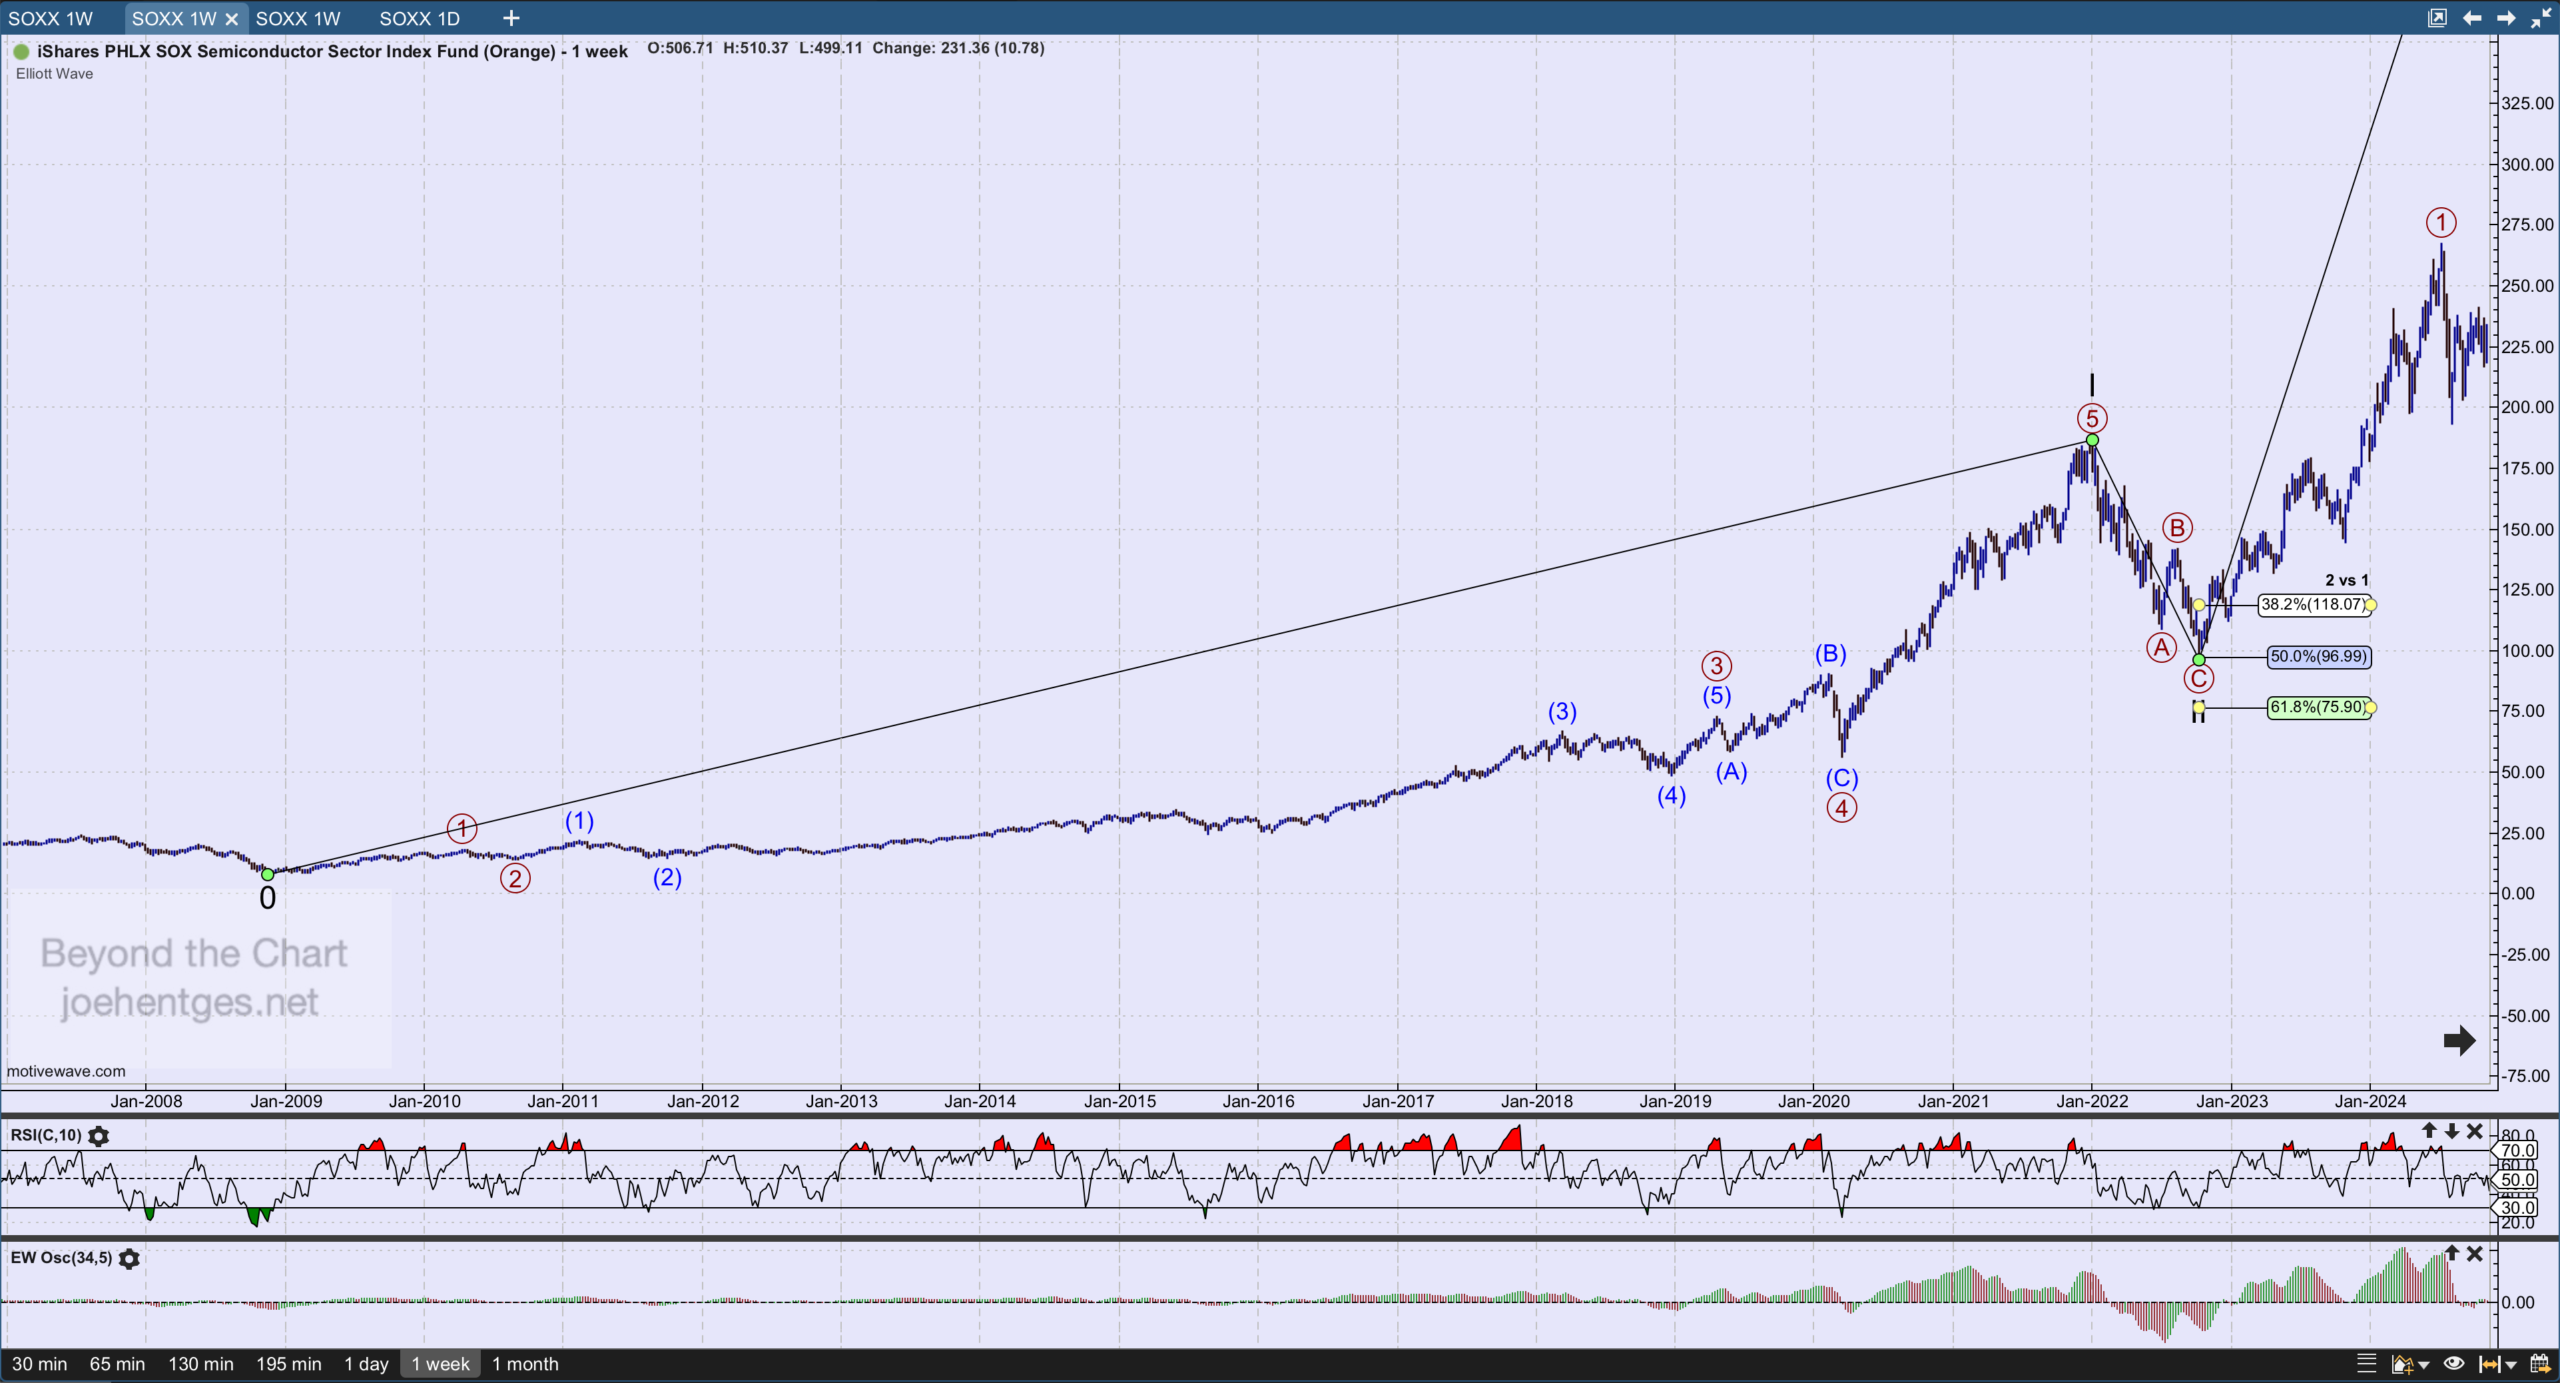
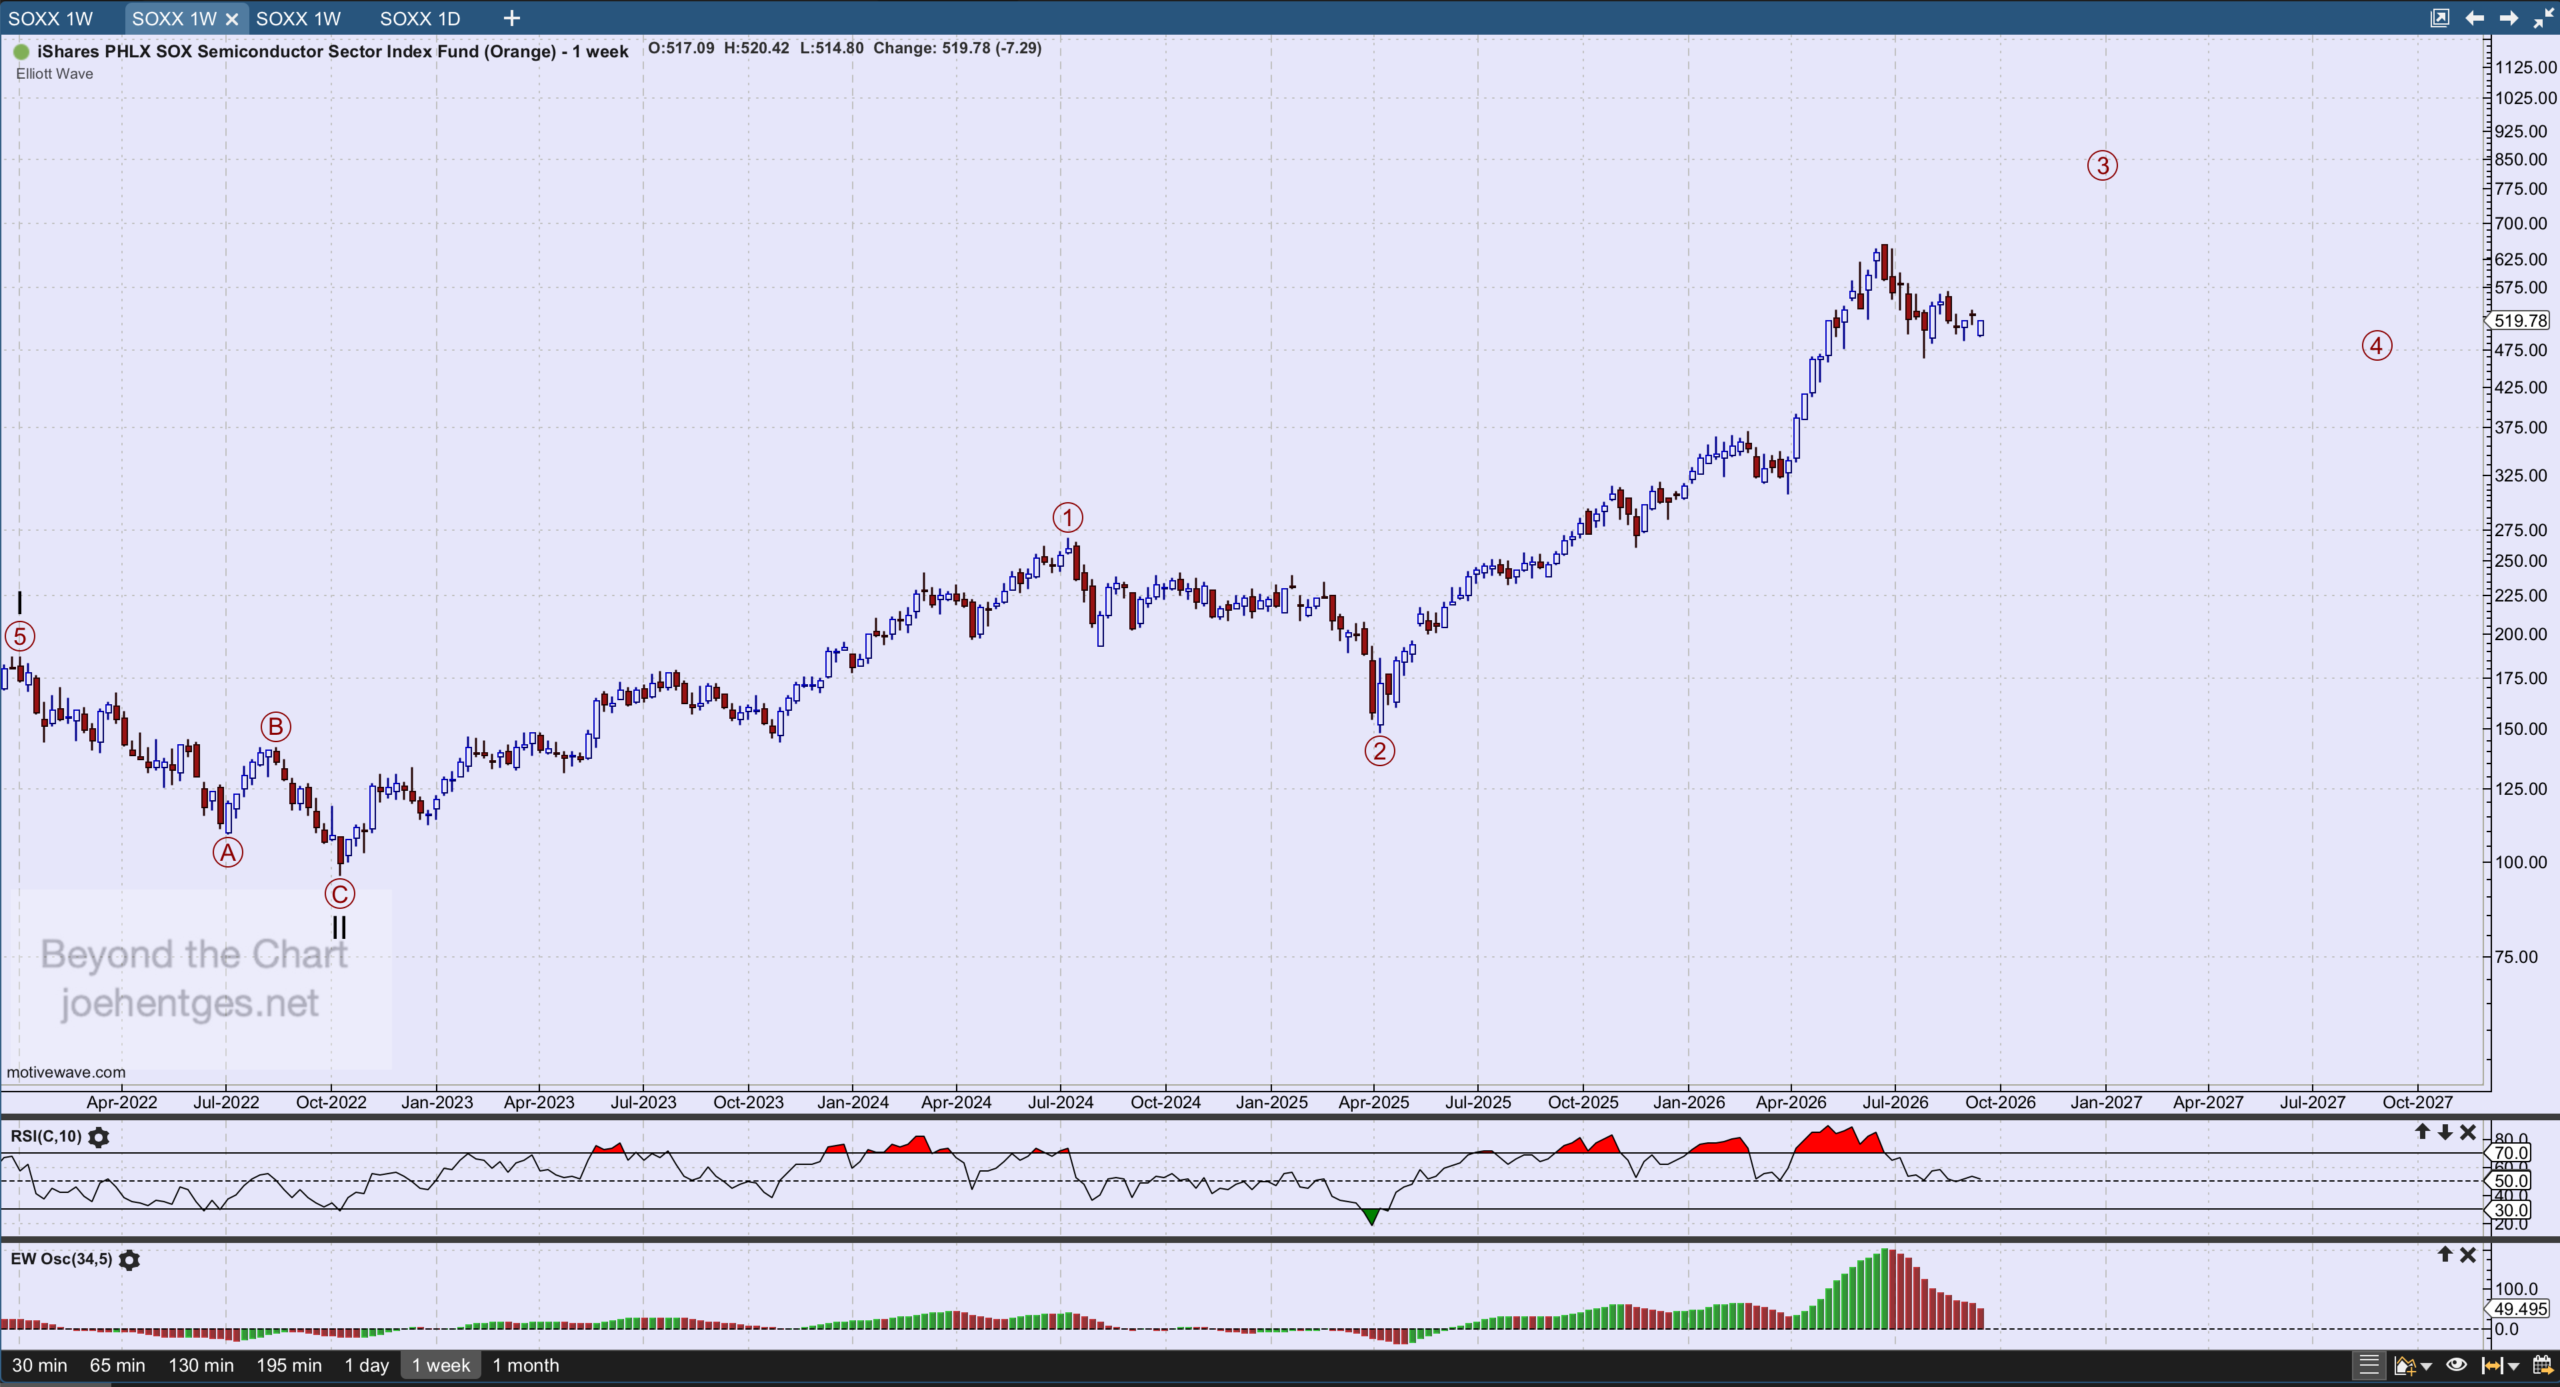
So now let’s focus on Cycle Wave III. This began with the low of 95.94 the week of October 9, 2022. We are currently in Primary Wave 3 (circled) and it doesn’t look complete. Based on Fibonacci relationships my target for Primary Wave 3 is 778. But first let’s zoom-in to see how the waves are unfolding.
The chart below shows Intermediate Waves (1), (2) and (3). Wave (3) shows the strong move from March 30 to May 11 as Minor 3 within Wave (3). This fits perfectly, in that the 3rd wave within a 3rd wave is typically the strongest wave. Minor wave 5 is an ending diagonal with Wave (3) peaking on June 22.
This chart also shows the percentage retracements of Wave (2) and Wave (4). Wave (4) looks complete and was a deep retracement of Wave (3), almost 50%. This makes sense when viewed in comparison to the very shallow retracement of 23.6% for Wave (2).
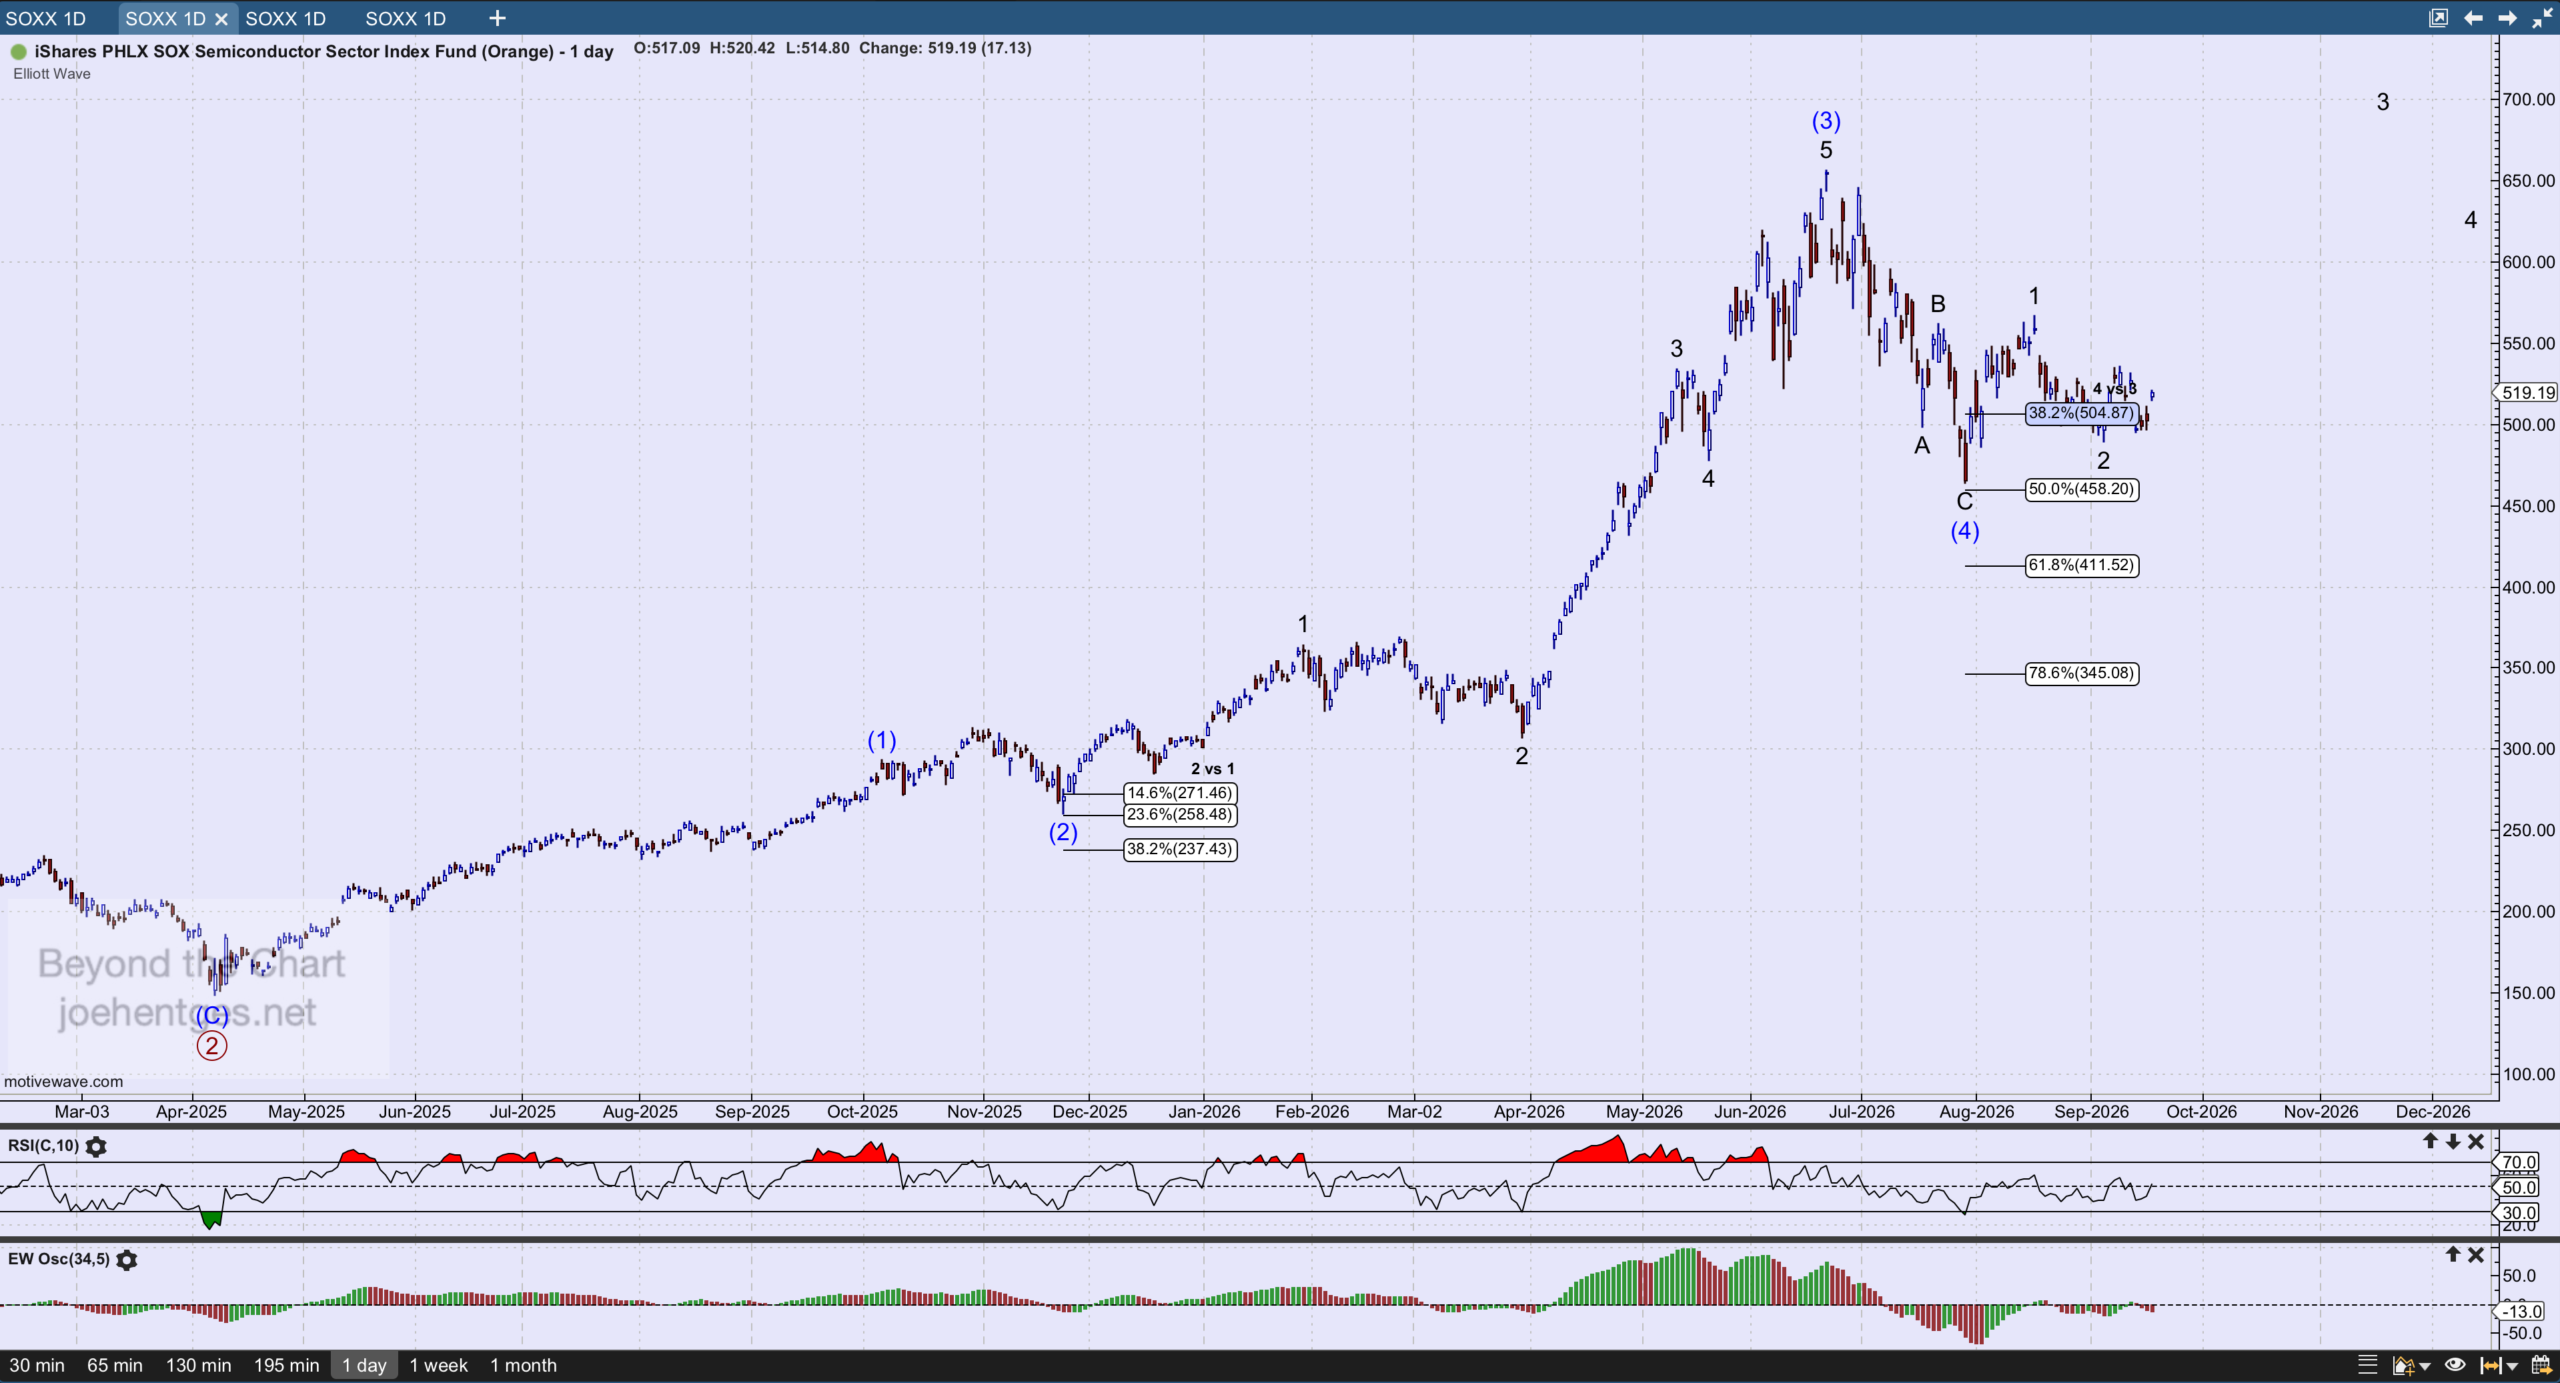
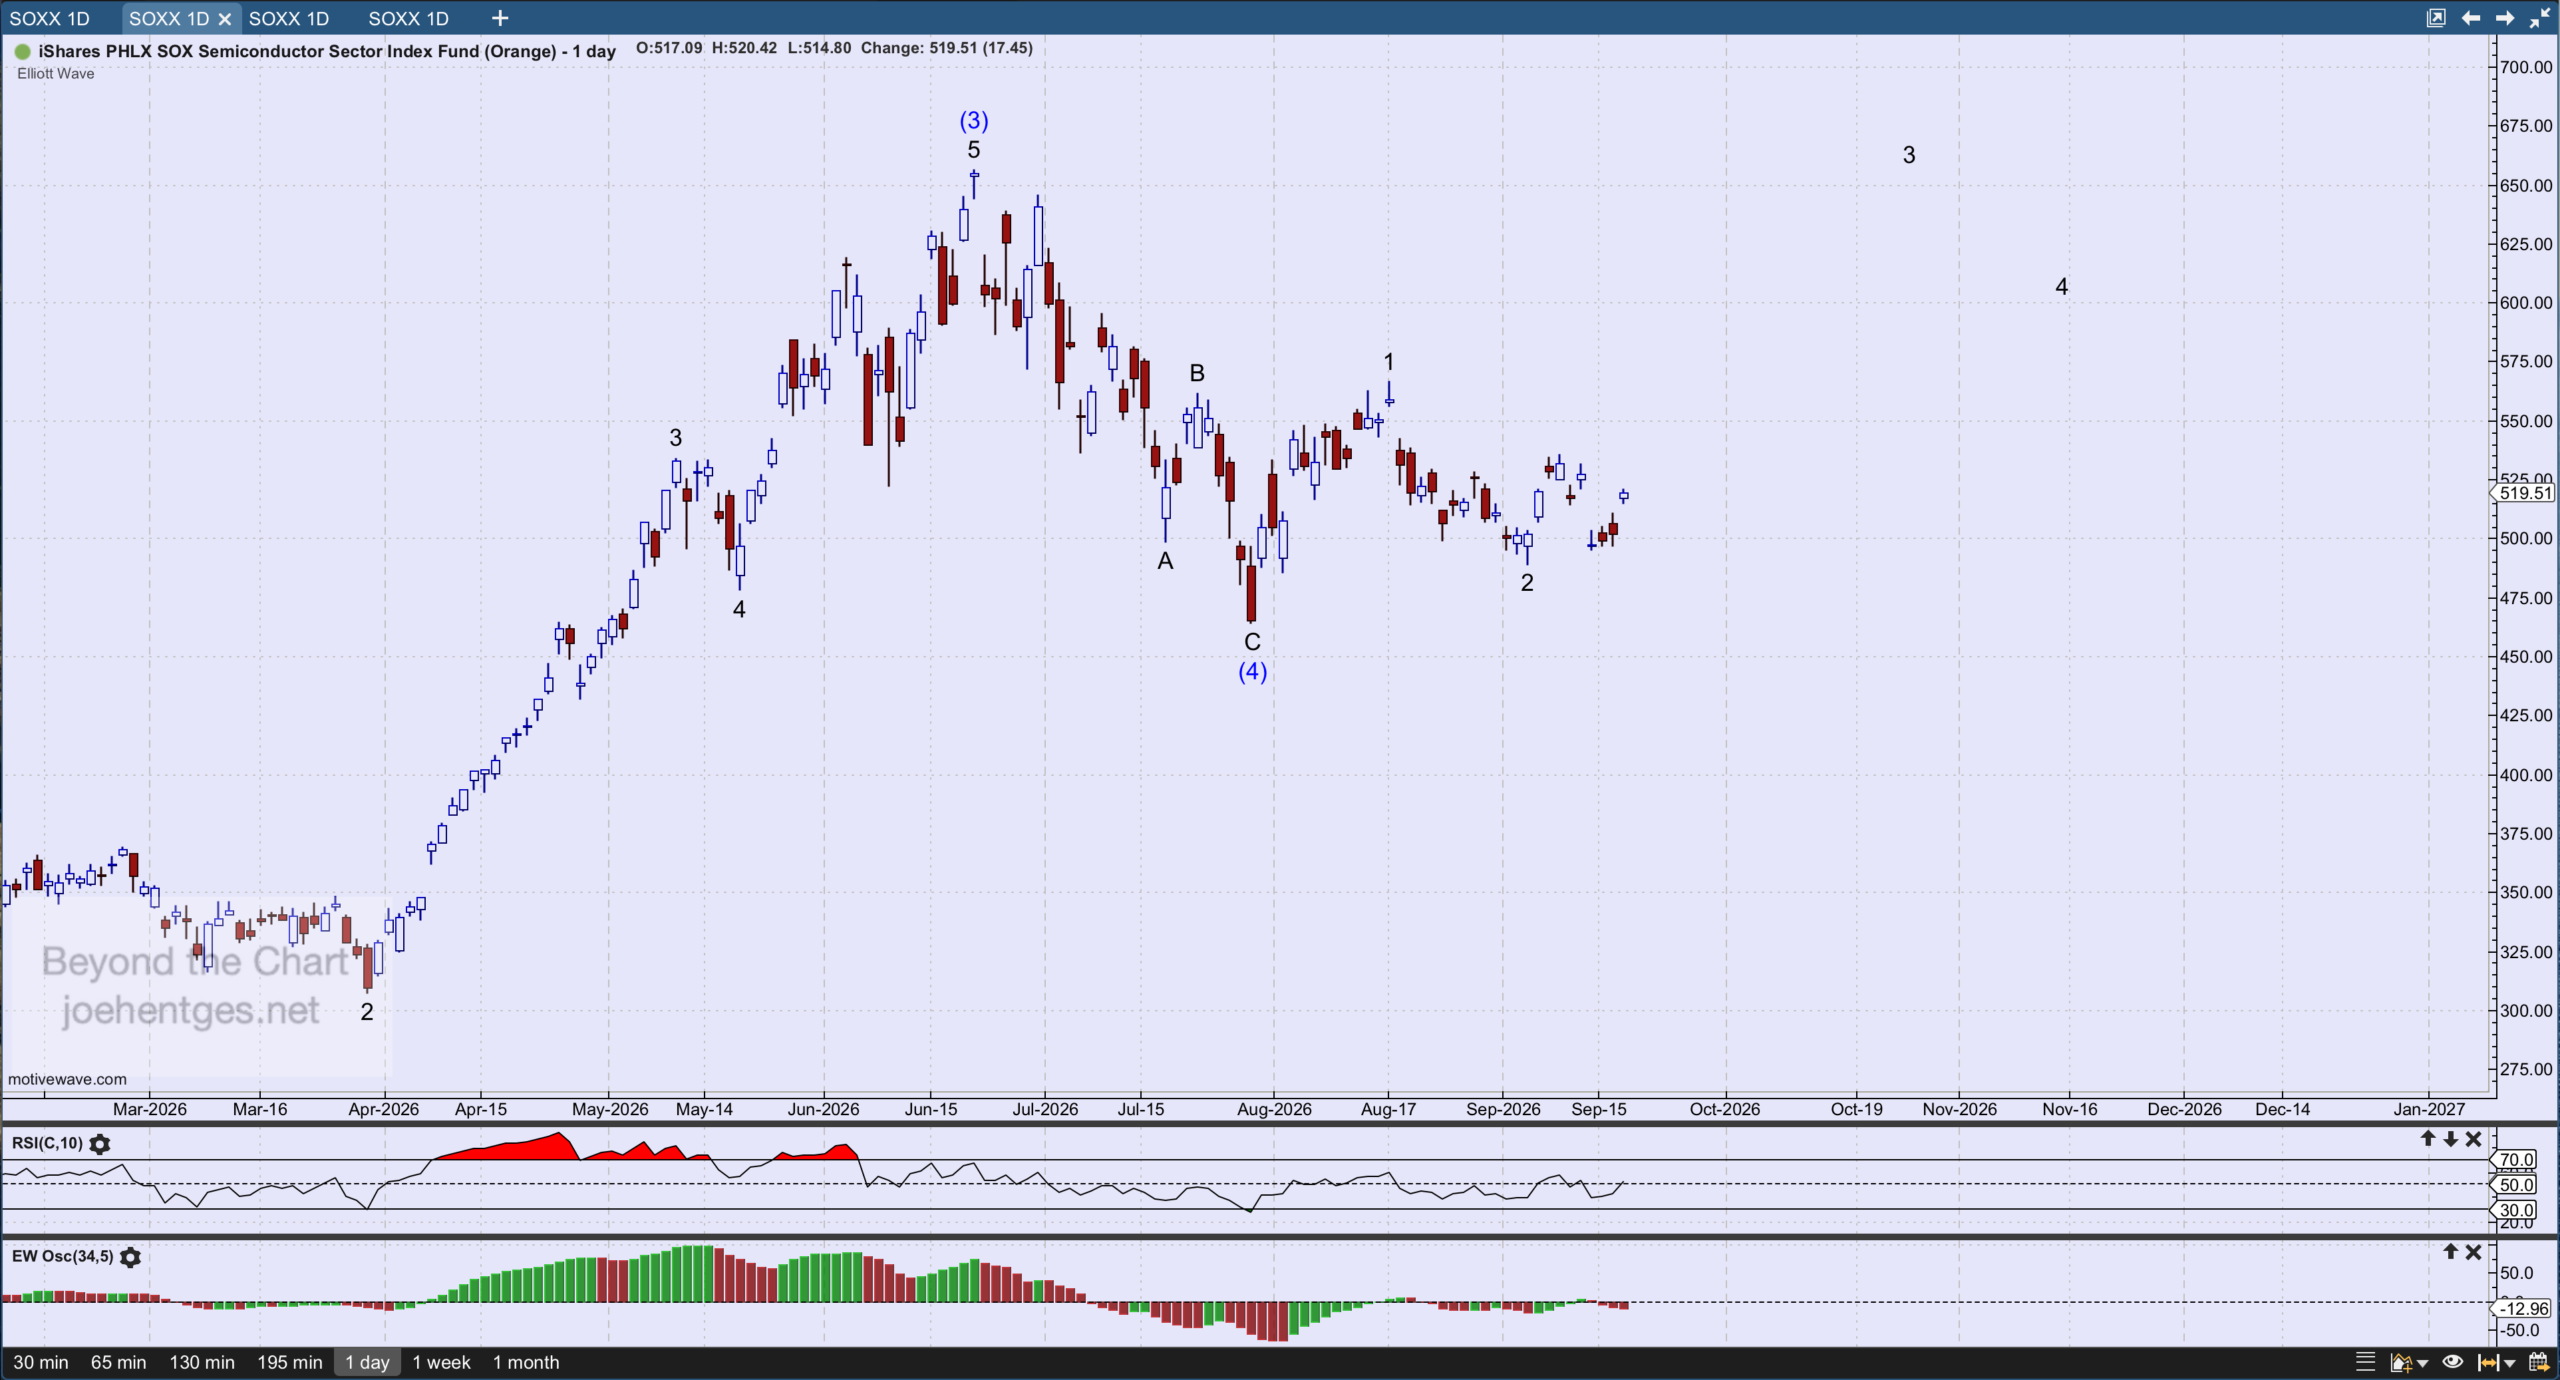
Right now I believe SOXX has completed the first two waves of Wave (5). Wave 1 broke above the minor peak of Wave B and did so in what looks like a five wave Leading Diagonal Wave 1. Wave 2 made a deep retracement of Wave 1 and if indeed this is complete, prices should push above the August 17 high of 566.02 fairly quickly.
This image below was taken about mid-day on Thursday September 17. Where I’ve placed Minor 3 and 4 in the chart are not predictions of timing.
So in conclusion, semiconductors as measured by SOXX show there is much more to come. The Elliott Wave patterns are laid out, let’s see how the price action unfolds.
