

Super Cycle Tops
Note: This is an update to a post created about 4 years ago.
Look at the two charts below.
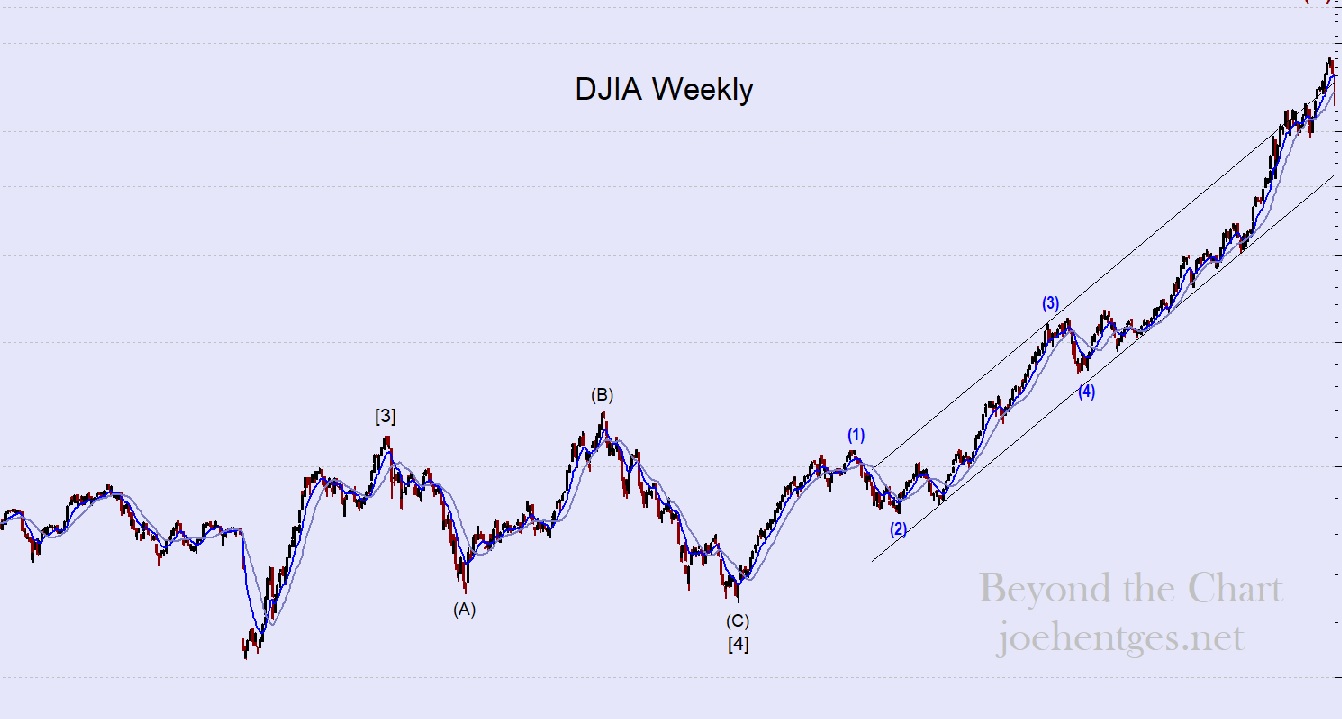
Primary Wave 3 peak in 1916 – Primary Wave, Cycle Wave and Super Cycle Wave peak in 1929
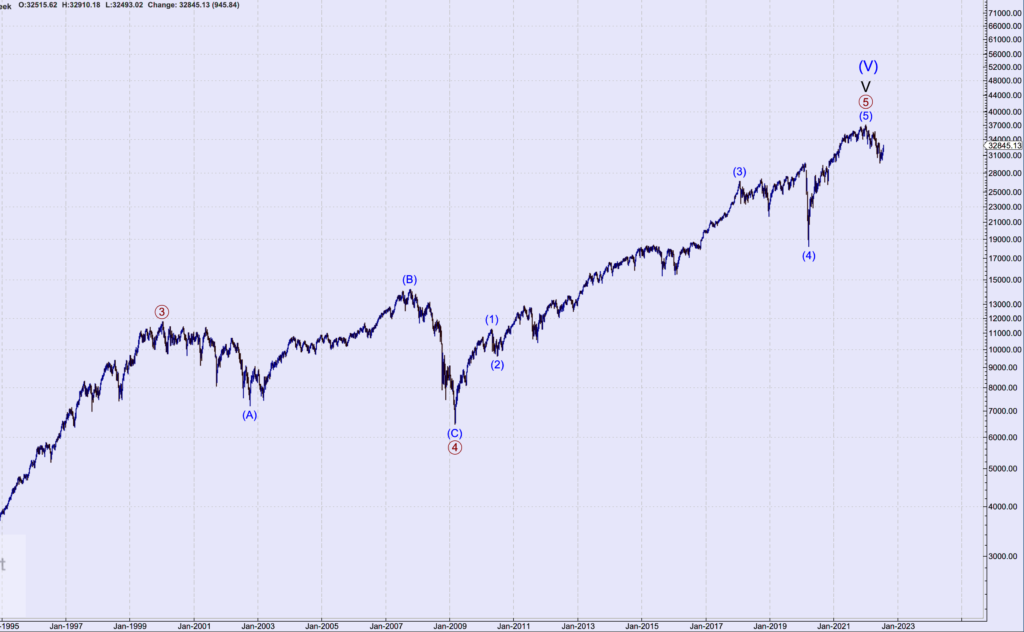
Primary Wave 3 peak in 2000 – Primary, Cycle and Super Cycle peak in January 2022
Look at both charts. Look at the price action between (B) and (C) in Primary Wave [4] on both charts.
The first chart shows the price move in the Depression of 1920-21 in which the DJIA lost 46.6% of its value.
The second chart shows the Great Recession of 2007-09 in which the DJIA lost 53.8% of its value.
The Depression of 1920-21 lasted 18 months and experienced tremendous deflation. In fact it was the largest drop in wholesale prices since the Revolutionary War… -36.8%. Unemployment hit 19%. The Depression of 1920-21 set the stage for the huge stock market rally of the 1920s that ended in the Crash of 1929. That was followed by the Great Depression that lasted 10 years.
The Great Recession of 2007-09 lasted 18 months and experienced no deflation (as reported). Although house prices dropped dramatically due to that sector being at the heart of the crisis. Unemployment hit 10% (as reported) and the world financial markets came perilously close to collapse.
Following the end of the Expanded Flat Primary Wave 4 correction in both time periods, a huge run in the stock markets of the United States and around the world occurred.
The DJIA peaked in 1929 at 6 times the value of the lowest close during the Depression of 1920-21. It was a tremendous 8 year run.
This time the DJIA peaked in January 2022 at about 5.6 times the lowest closing pricing of the Great Recession. Nearly identical to the multiple of 1929. Its run took nearly 13 years.
The shape of the pattern of prices from 1916 to 1921 and those of 2000 to 2009 are nearly identical. The length of time for the bull runs had a Fibonacci relationship, 8 to 13.
This peak in the stock market is the end of an 89.5 year Super Cycle Wave from July 1932. (89…another Fibonacci number). And now the Super Cycle correction…
