I use the Gold ETF (GLD) as a proxy for the price action in gold. We are experiencing a strong bout of inflation right now, running at 40 year highs. It seems to be out of control. It is affecting everything…except gold.
Gold really hasn’t reacted to the inflation news. GLD reached a high of 194.45 on August 6, 2020 which was tested again on March 8, 2022 hitting an intra-day high of 193.30 but that was it. GLD closed at 175.98 on April 27, 2022.
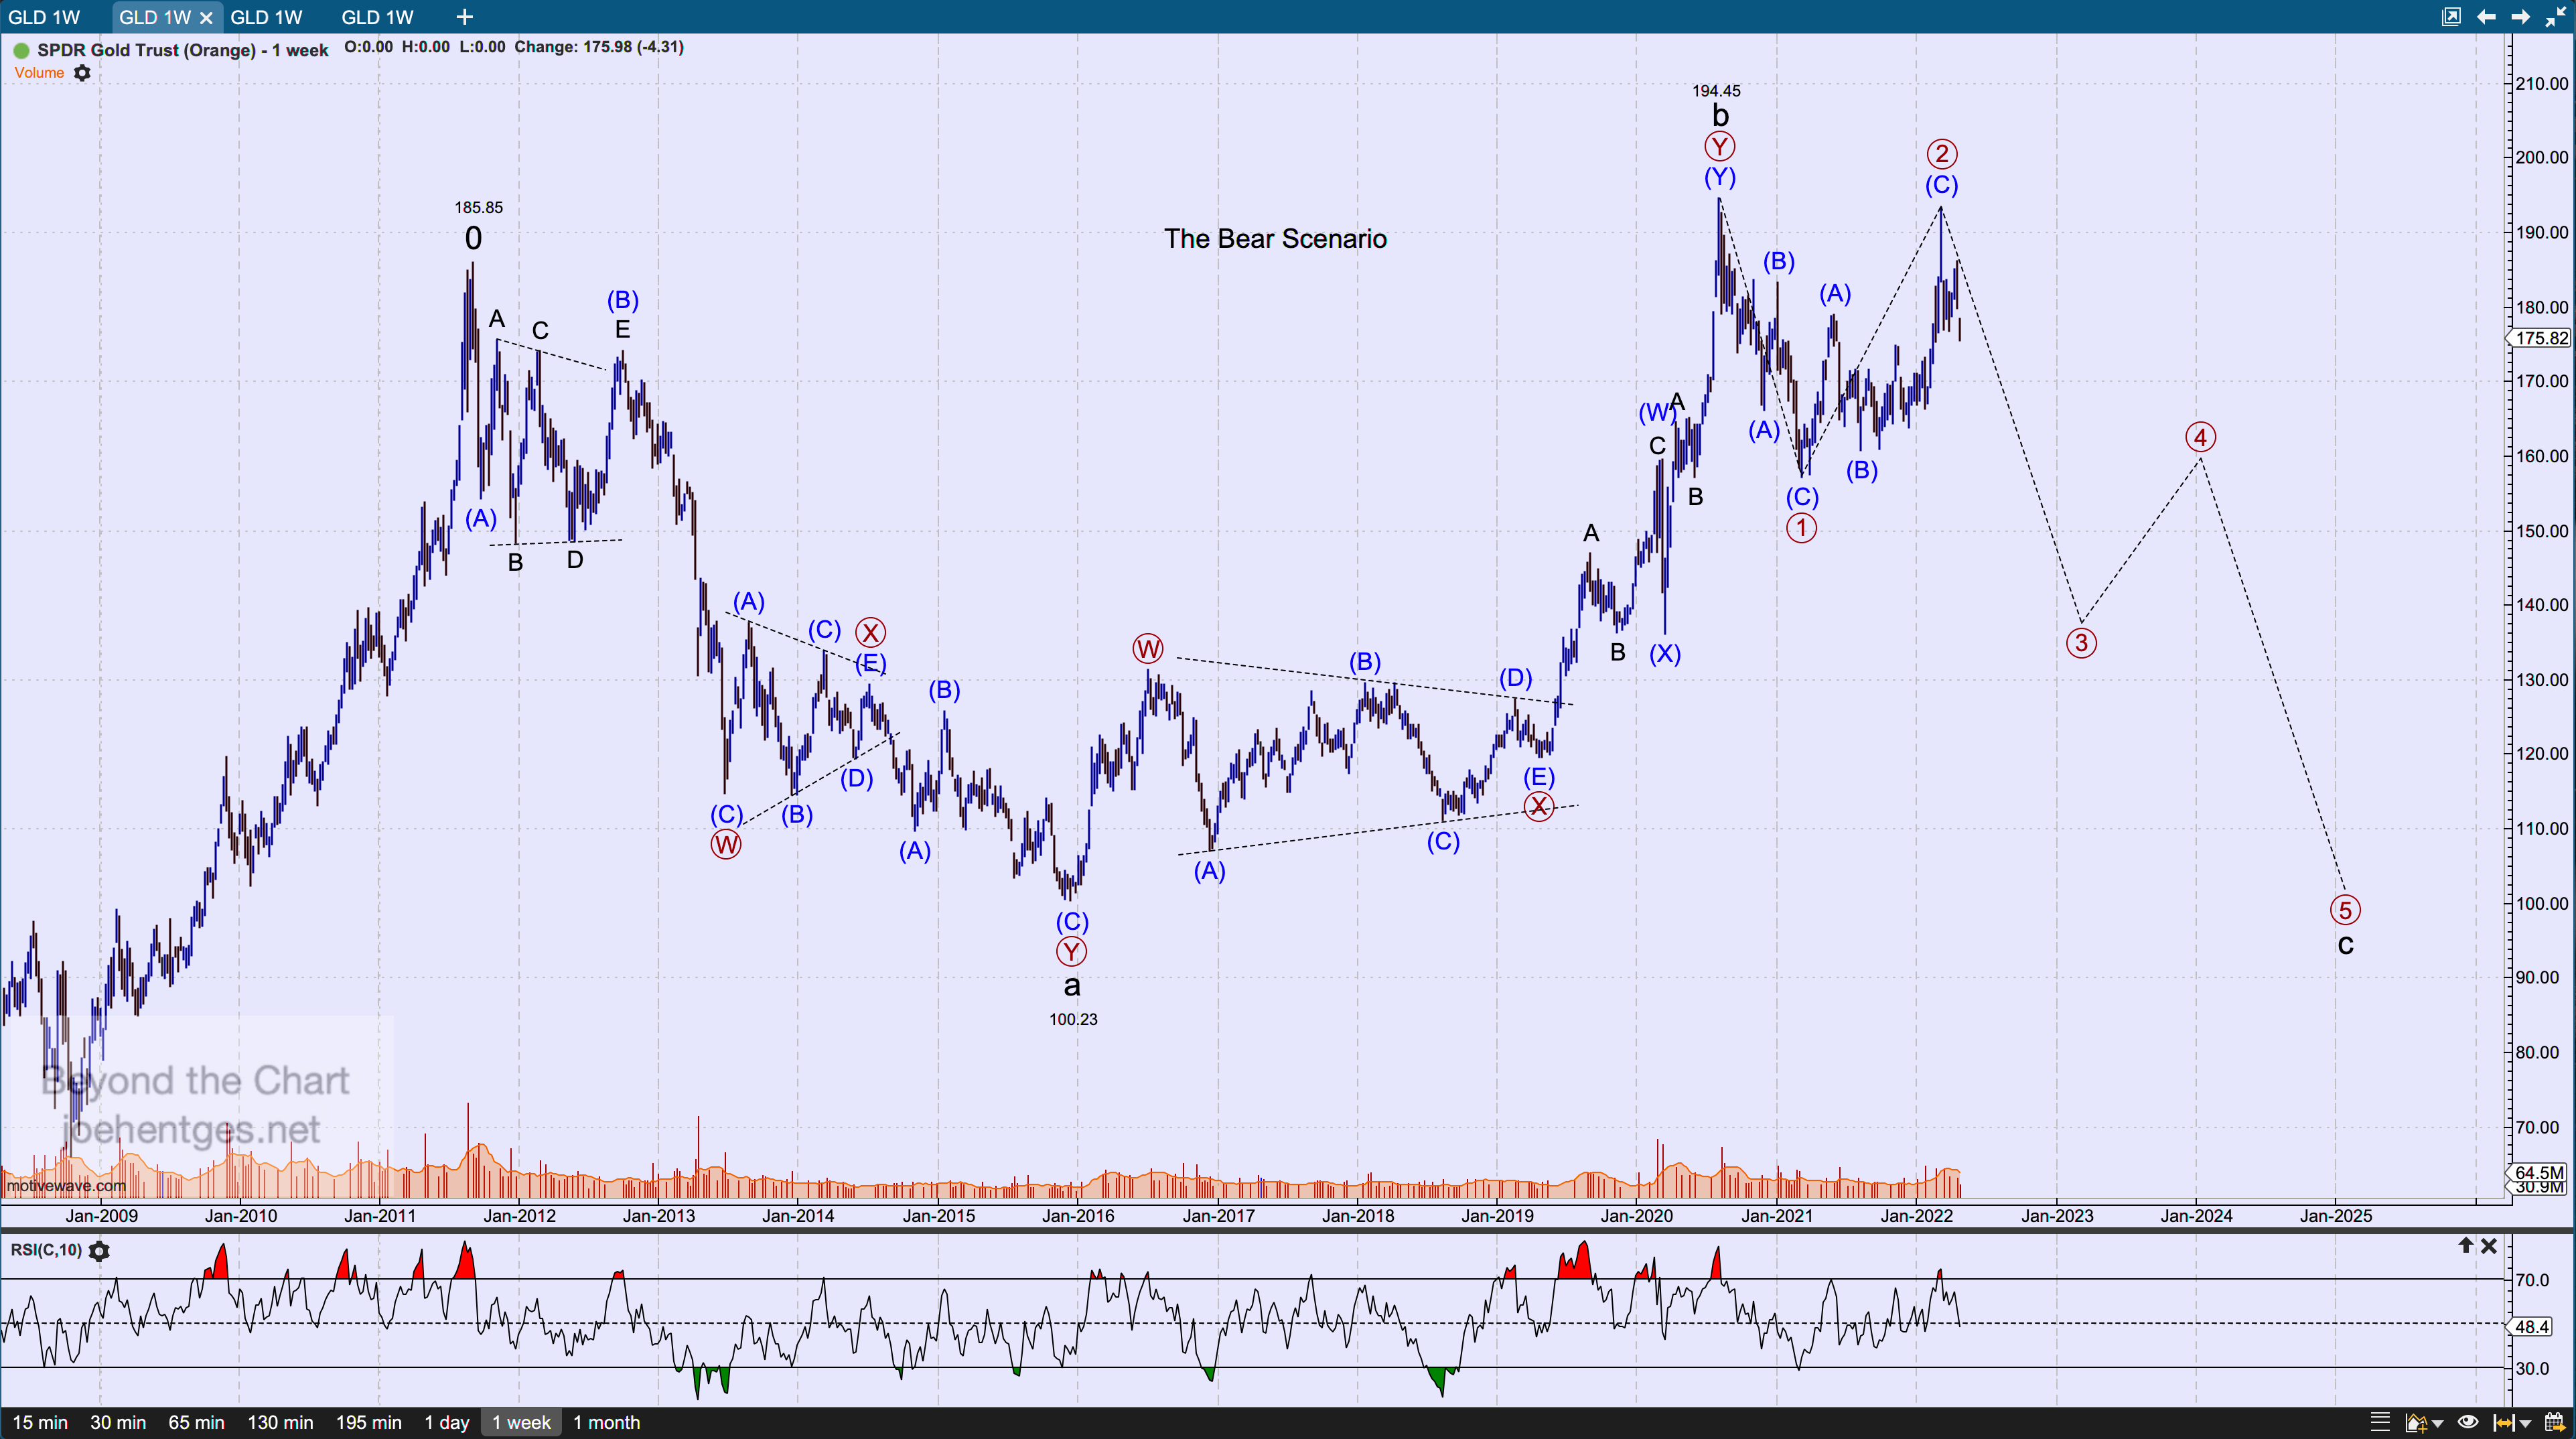
So after trying to support the bullish view for a long time, I am now moving to the bear camp. The chart below is a long-term weekly chart of GLD. This chart shows the September 2011 high of 185.5 followed by a double three W-X-Y corrective pattern that concluded "Cycle Wave a" at 100.23 in December 2015.
This was followed by another W-X-Y "Cycle Wave b" that punched to a slightly higher high as part of a large Elliott Wave “Flat" pattern. And we are now in Primary Wave 3 (circled) of "Cycle Wave c". Based on the price action of the last 2 years "Cycle Wave c" is carving out an ending diagonal pattern much lower.
Where does this pattern fail? If GLD pushes above 194.45 then I would have to re-visit the bullish scenario.
Data thru April 27
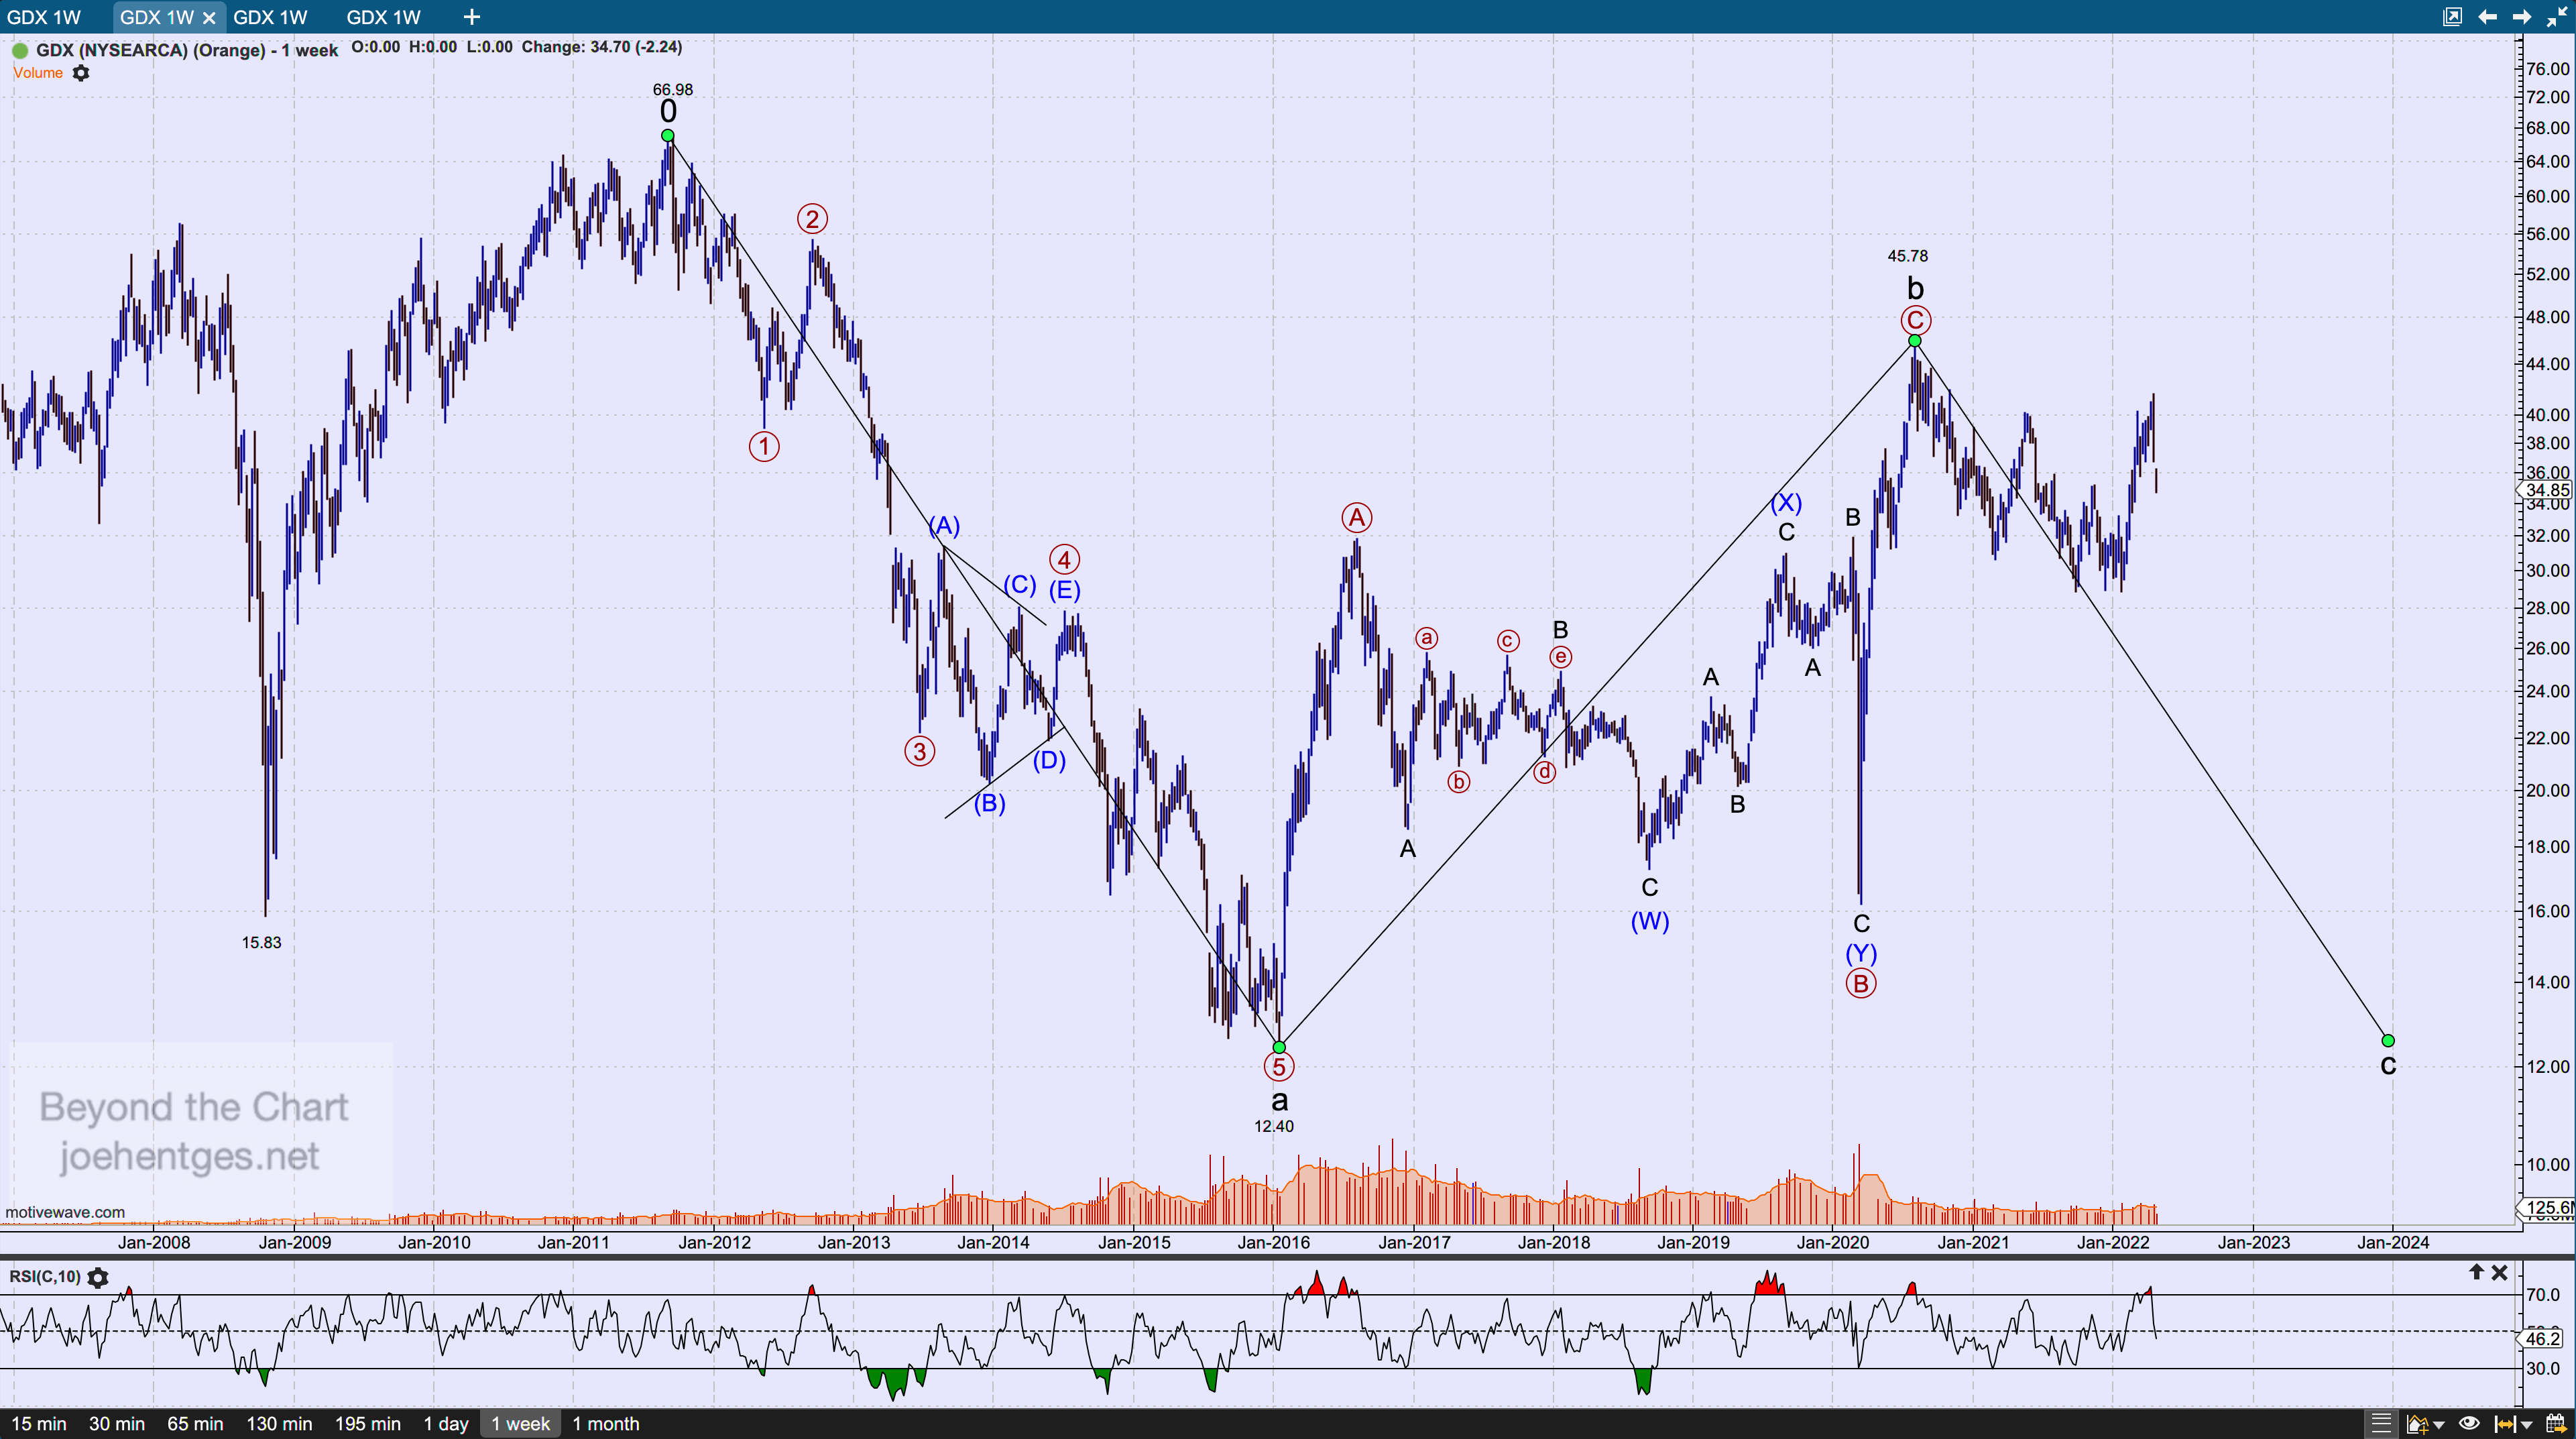
The gold miners are not in sync with gold and in fact have been a lot weaker, not confirming higher moves. The first chart below is the Gold Miners ETF (GDX) weekly chart. GDX and GLD were in sync at the high in September 2011 but GDX sold off in a 5 wave "Cycle Wave a" move to a low below that of the 2008 collapse. The 5 wave move is significant in that it indicates the first leg of a corrective move down.
GDX then moved to a high of 45.78 in "Cycle Wave b" that did not even come close to confirming GLD’s push to a new high in 2020. So now GDX is in "Cycle Wave c” subdividing lower.
Data thru April 27
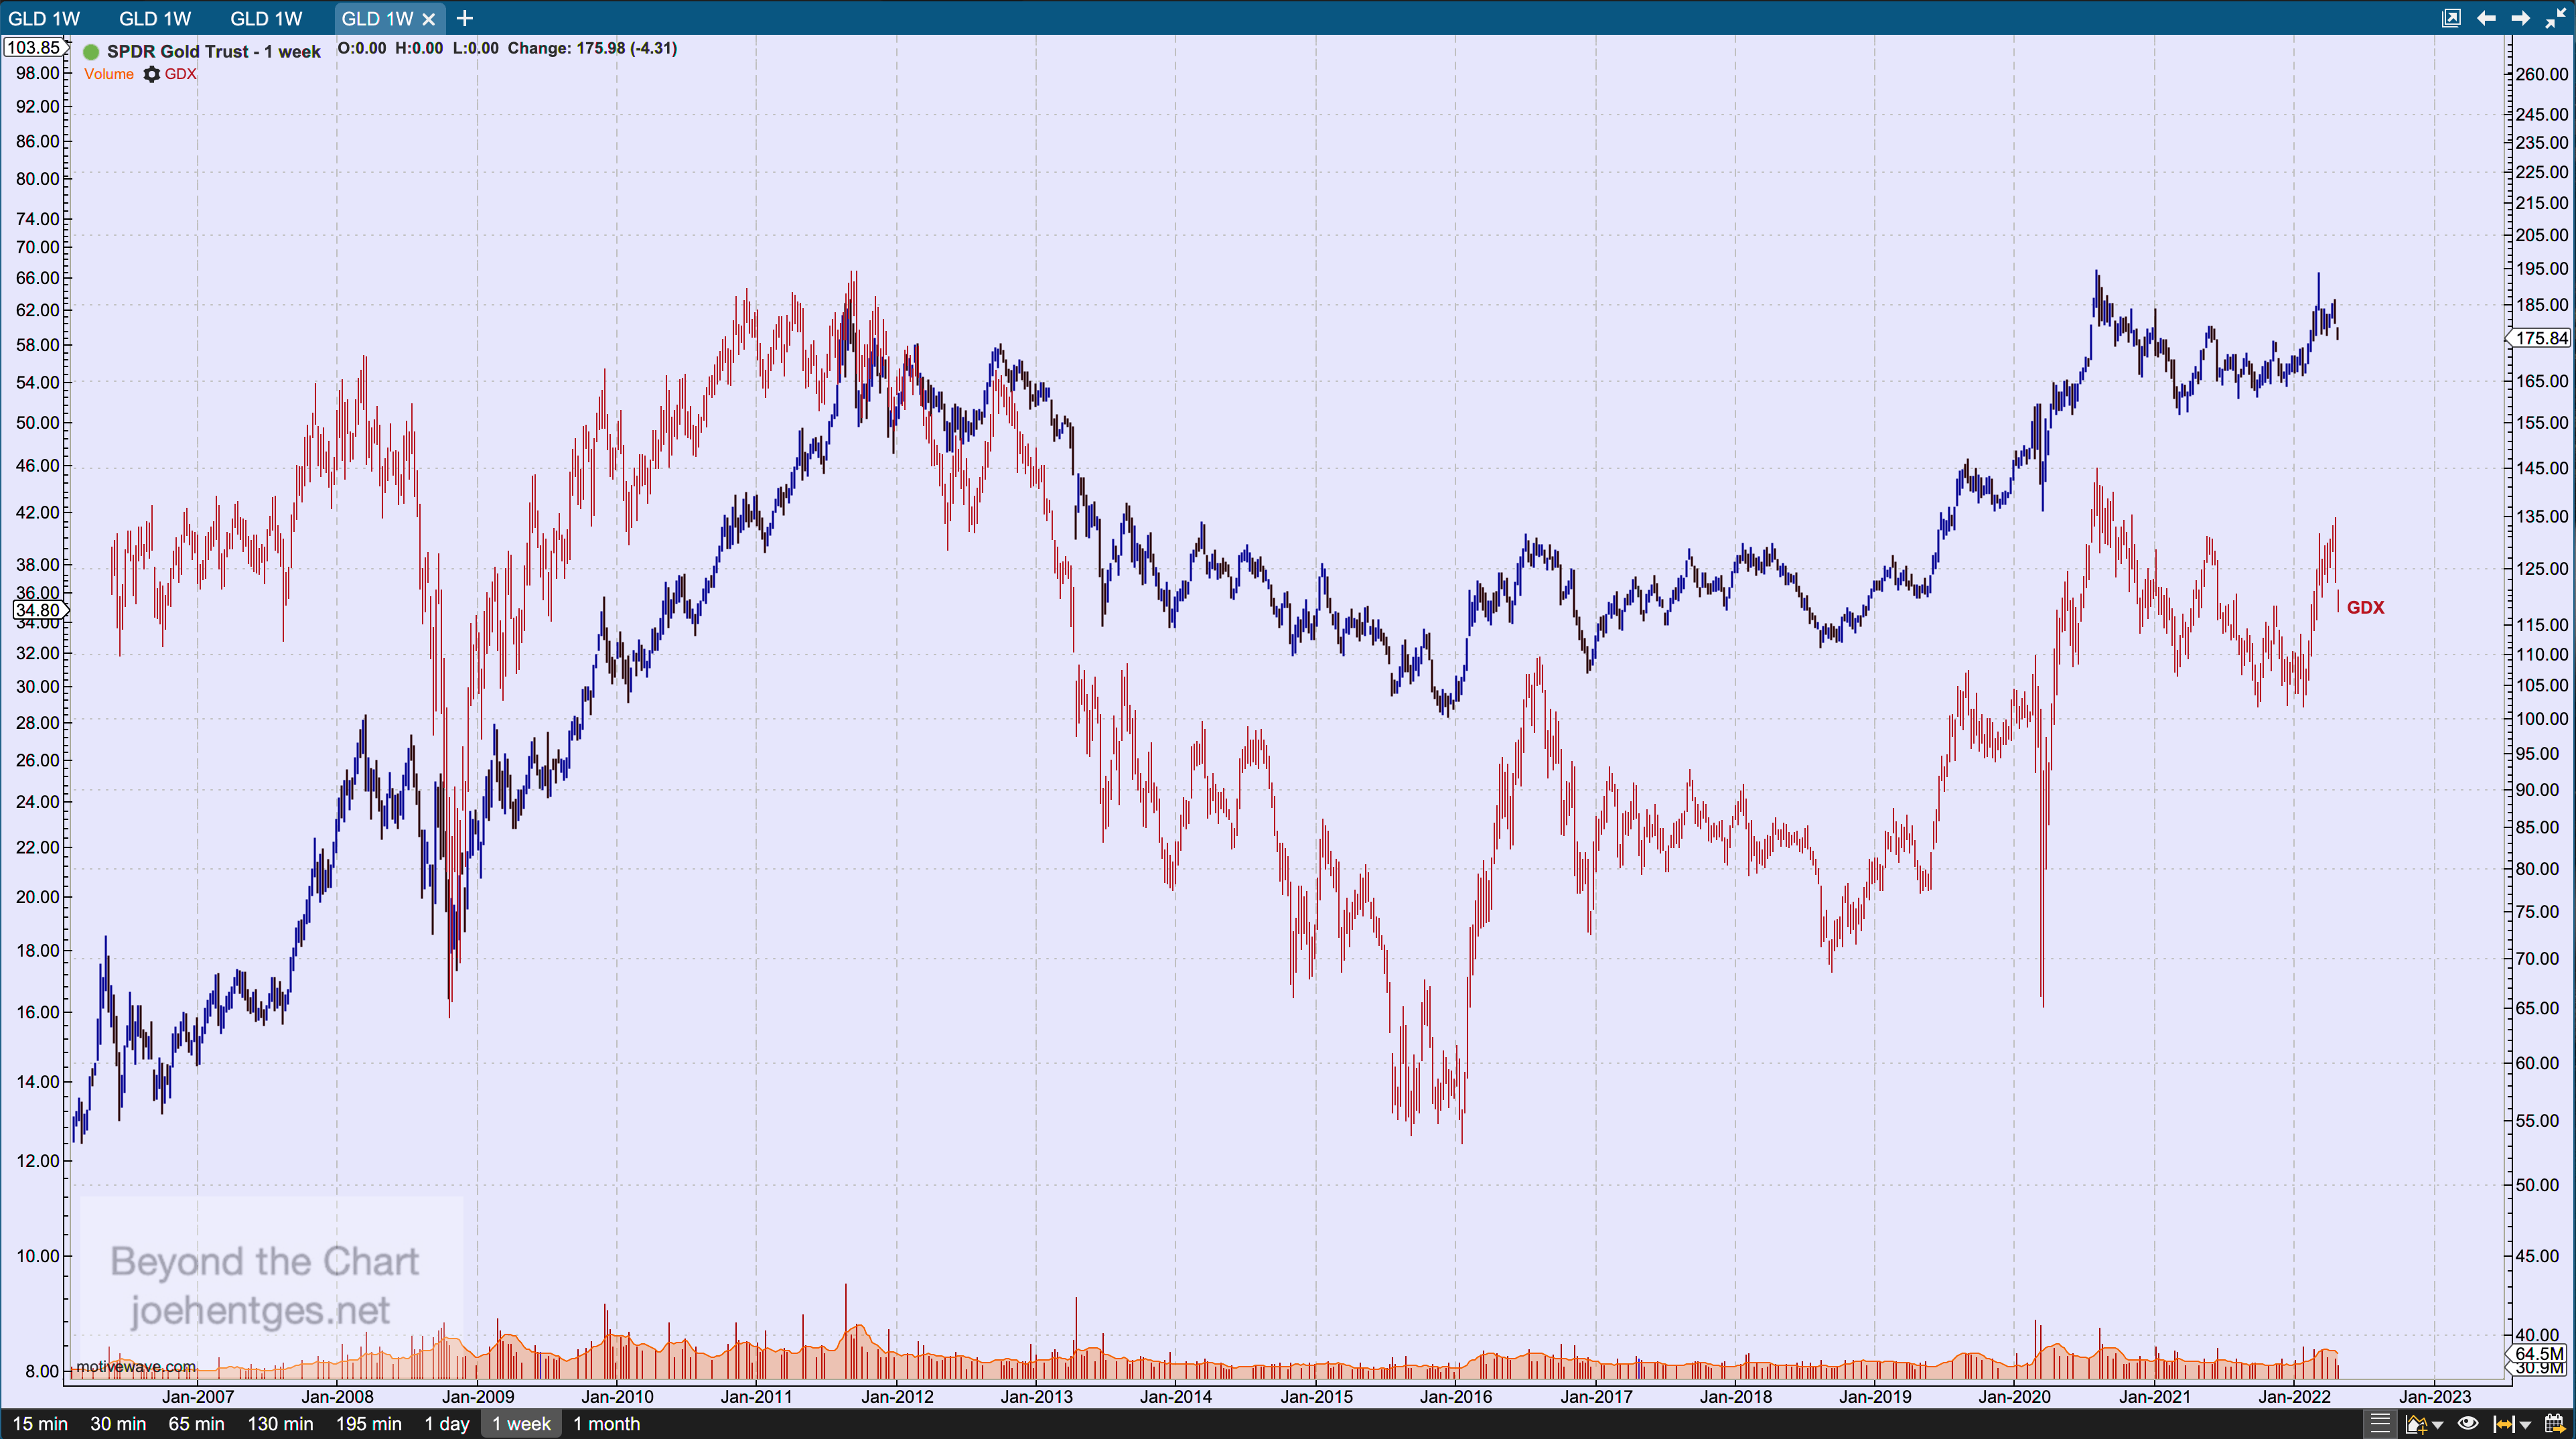
For comparison purposes the next chart shows GDX overlayed on top of GLD. GLD in blue with its scale on the right.
Data thru April 27
Not to be left out are junior gold miners. The Junior Gold Minors ETF (GDXJ) is shown in the next chart. It mirrors the GDX price action but is weaker. The 2020 high was only 37% of the December 2010 high. More recently the 2022 high did not even exceed the May 2021 high. GDXJ is now moving lower in "Cycle wave c".
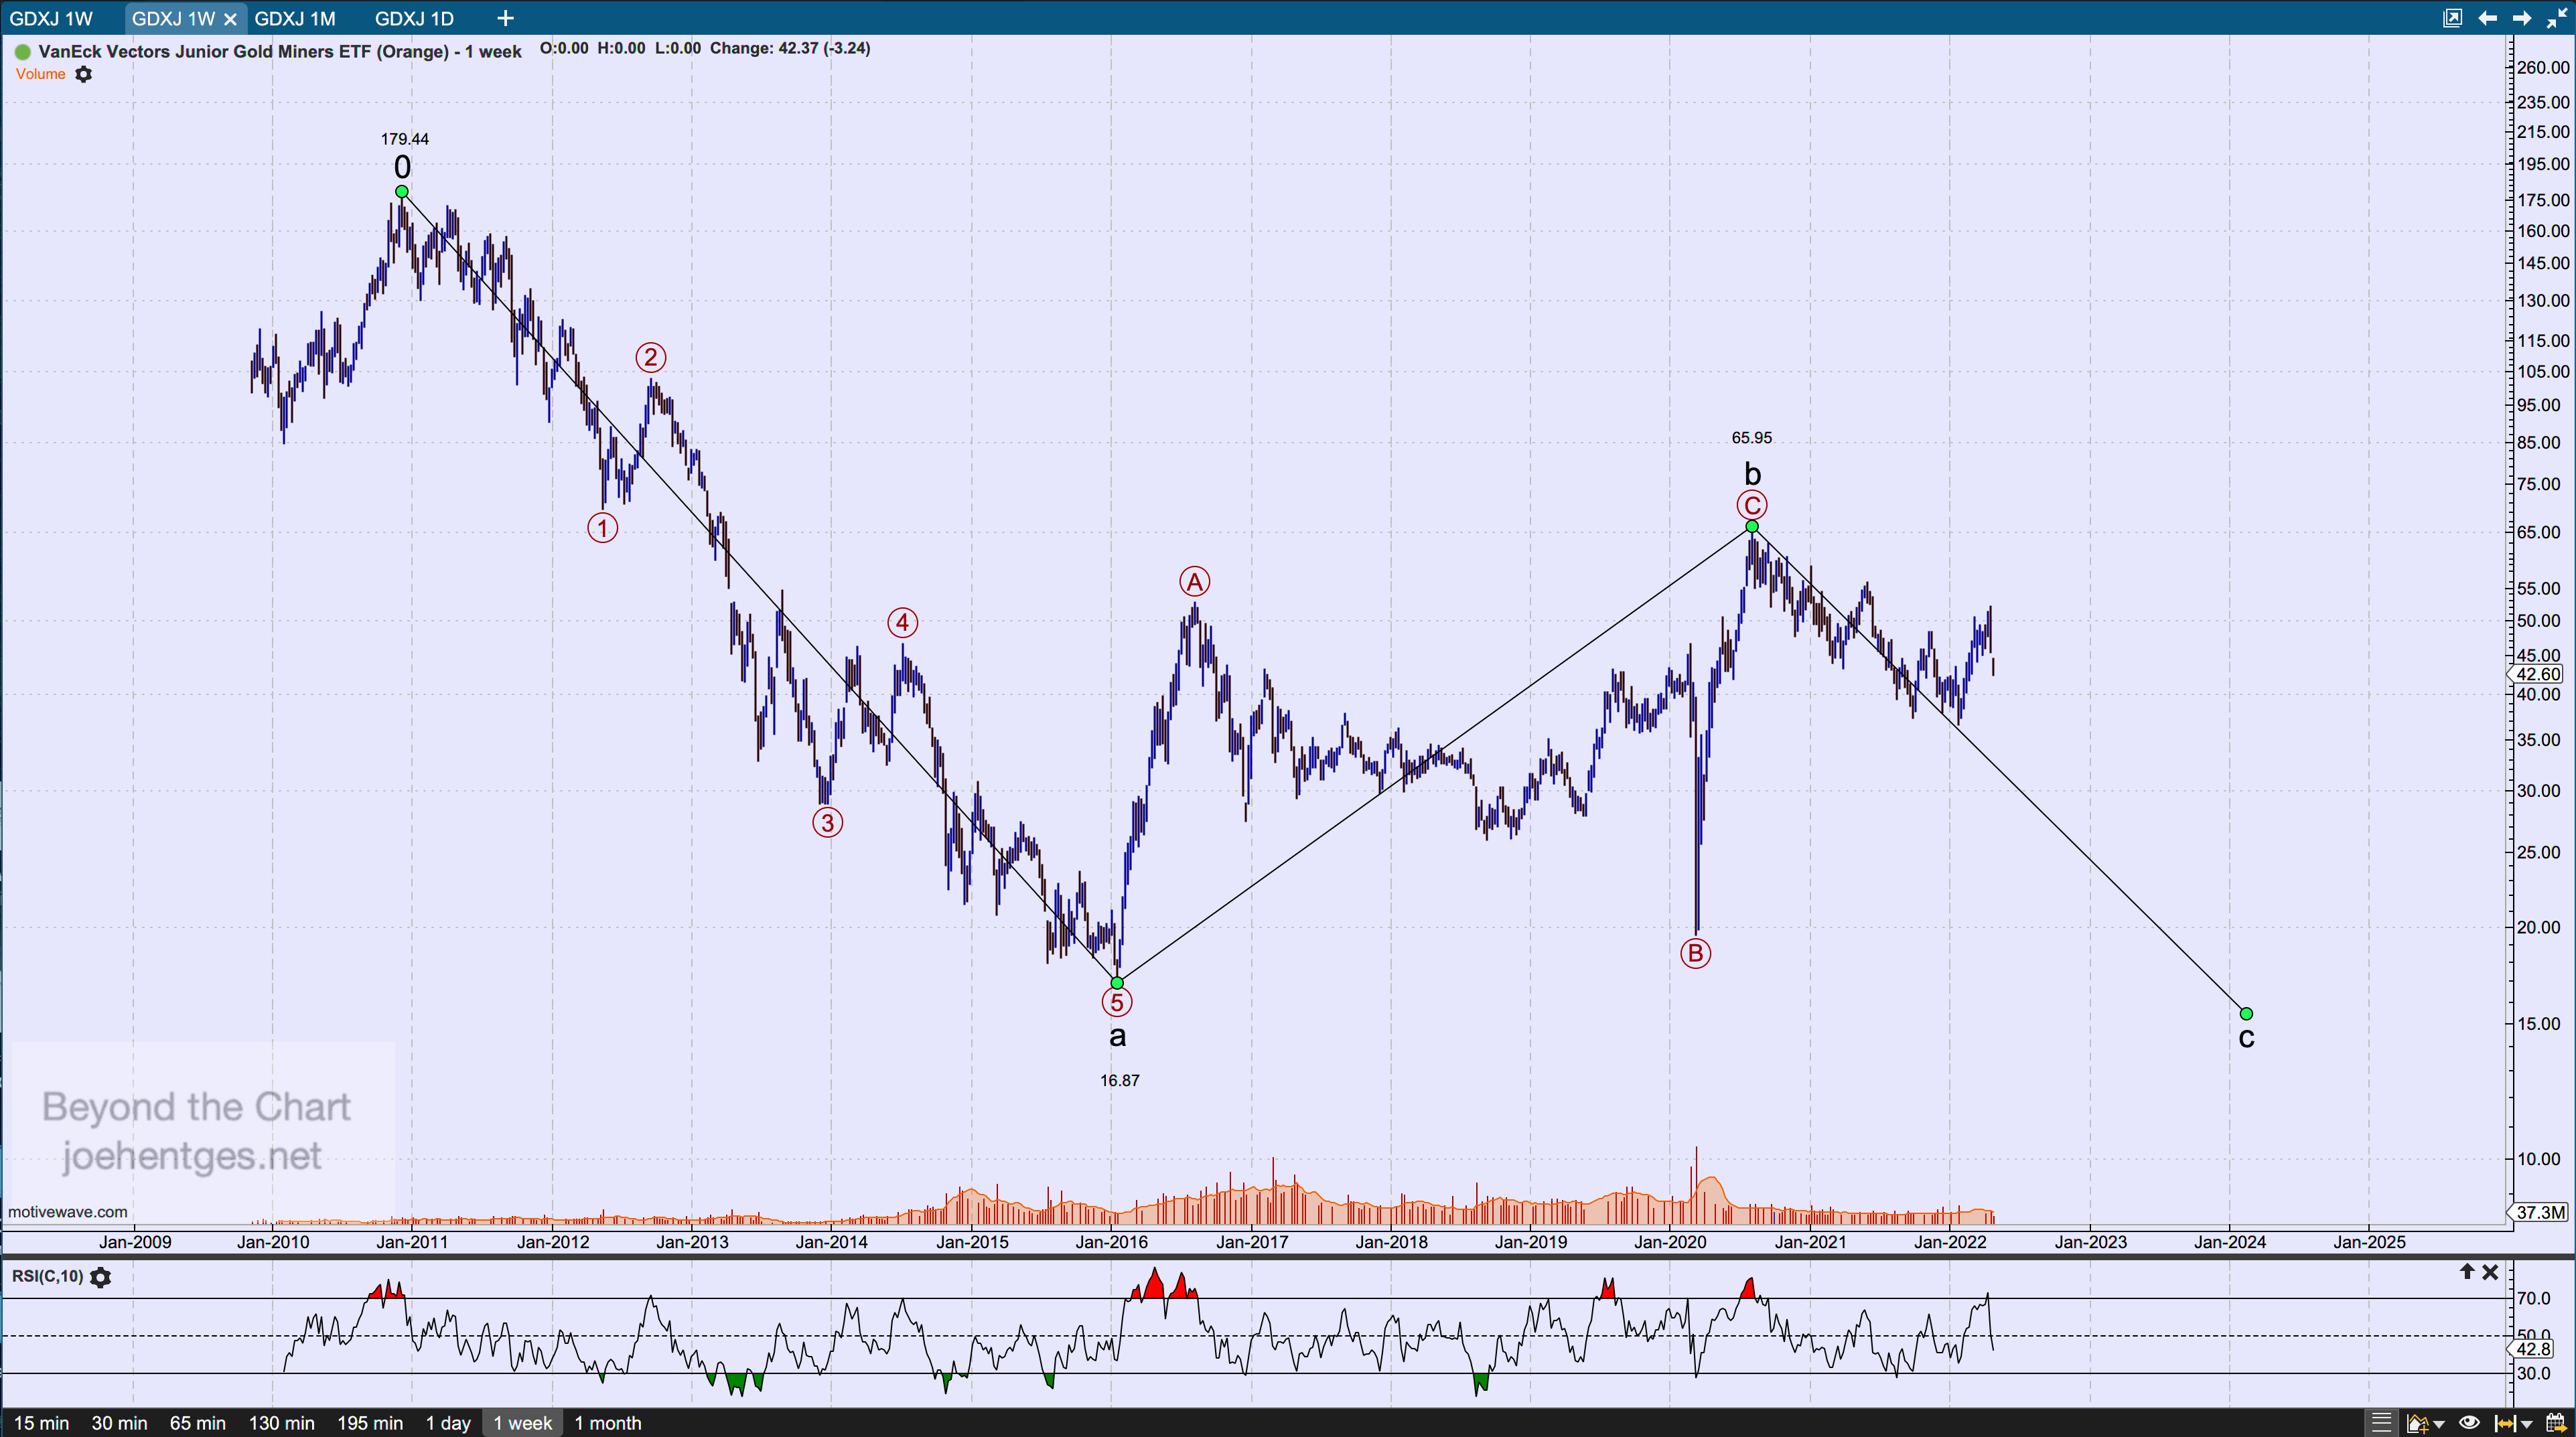
Data thru April 27

