 People will use the phrase, ‘but it’s different this time’ for why things that have happened in the past won’t happen again. We’re smarter now. We have better technology now. And on and on. But when it comes to human beings, human nature, emotions, habits don’t really change all that much.
2008 Wake-Up Call
So when I think about the phrase ‘it’s different this time’, I think about how something that has happened in the past, could happen again…just in a different way. 2008 was a wake-up call. All the experts talked about how you need to diversify your investments to protect yourself. Except when all things go down together, like they did in 2008, it didn’t matter. It was different that time.
1987 Crash
The markets have crashed in a big way before, can they do it again? Absolutely. On August 25, 2007 the DJIA closed at 2722.41. Thirty-eight trading days later it closed at 1738.74, down 36%. On the last day of that move the DJIA dropped 22.6% on October 19, Black Monday.
They still call it the Crash of 1987. But, the market came back because that was the stage of the bull market that it was in. When you look at a long-term chart, it barely shows ups as a blip on the chart. it was different that time.
1929 Crash
1929 was the end of a final wave up of a cycle that started in the 1840’s. The top occurred on September 3, 1929 closing at 381.17. Fifty-six trading days later it was down 47.9%, closing at 198.69 on November 13, 1929. That was the end of the first wave down, Wave A. But the final bottom didn’t occur until July 8, 1932 at 41.22.
So here we are 76 days and -14.4% (low close on 8/25) from the peak close on May 19. Where do we go from here? All anyone knows for sure is that it will be different this time. In today’s video (below) I review where I believe we are from a wave count perspective.
In addition to all the detailed information provided in the Weekend Market Analysis video, I review the weekly charts of AAPL, NFLX and CVX.
Continue reading
 The market ended mixed today with the DJIA, SPX and NYA all up slightly but the Nasdaq and RUT were down. In tonight’s Weekday Market Wrap video I look at all the indicators and key ETFs.
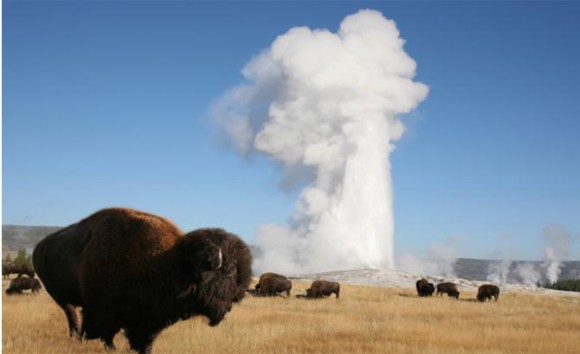
 I feel like I’m at Yellowstone National Park as the geyser blows sky-high with the DJIA up 390 points today. A little bit of pressure release from a 3 day weekend with no major negative developments.
 People will use the phrase, ‘but it’s different this time’ for why things that have happened in the past won’t happen again. We’re smarter now. We have better technology now. And on and on. But when it comes to human beings, human nature, emotions, habits don’t really change all that much.