Tag Archives for " Shanghai Composite "
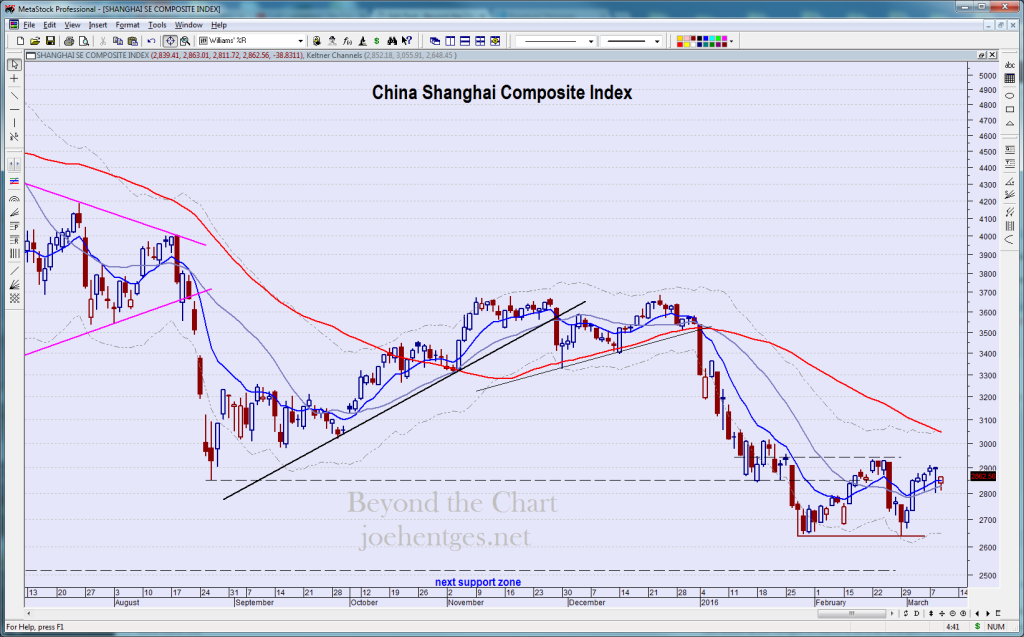
Daily Chart thru Mar. 9
The latest economic news out of China is about imports and exports. The February merchandise trade surplus was $32.6 billion versus an estimate of $48.7 billion.
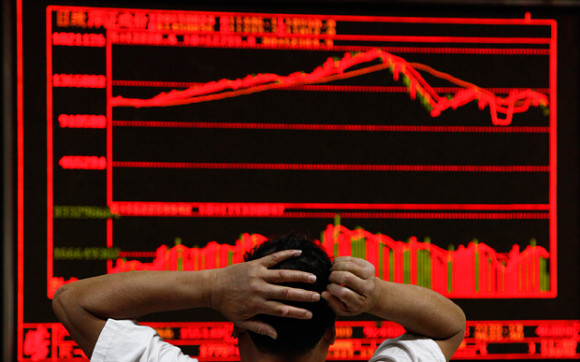
Lots of Red
Exports tumbled 25.4% from a year ago while imports shrank 13.8%. On a seasonally adjusted basis, exports shrank 19.9% in February after falling 15.9% in January. The following image comes from an article that further discusses the numbers. Continue reading
 The video attached below is a very condensed version of what I provide to my Insider Members in their Weekend Market Analysis.
Year of the Monkey
We won’t get any clues from China this week as the markets are closed for Chinese New Year or Spring Festival as it is also called. The Chinese New Year begins Monday, February 8 and it’s the Year of the Monkey…the Fire Monkey to be exact. I didn’t see any China economic reports due out either, until February 14.
The Shanghai Composite Index compressed further in pre-holiday trading. It still looks like consolidation in a downtrend. In the chart below I show the next support level, which is still another 10% down. Continue reading
Attached below is the very condensed version of what I provide to the Insider Members in their Weekend Market Analysis.
Selling continues in the global markets and in the video below I review last week’s market action by reviewing the NYSE Composite Index (NYA) and the Russell 2000 (RUT). Continue reading
China closed its exchanges twice last week when the drops hit 7%. The Shanghai Composite Index (SSEC) is down 15% in 9 trading days this year alone. It is down 41.8% from its June 12, 2015 high…7 months!
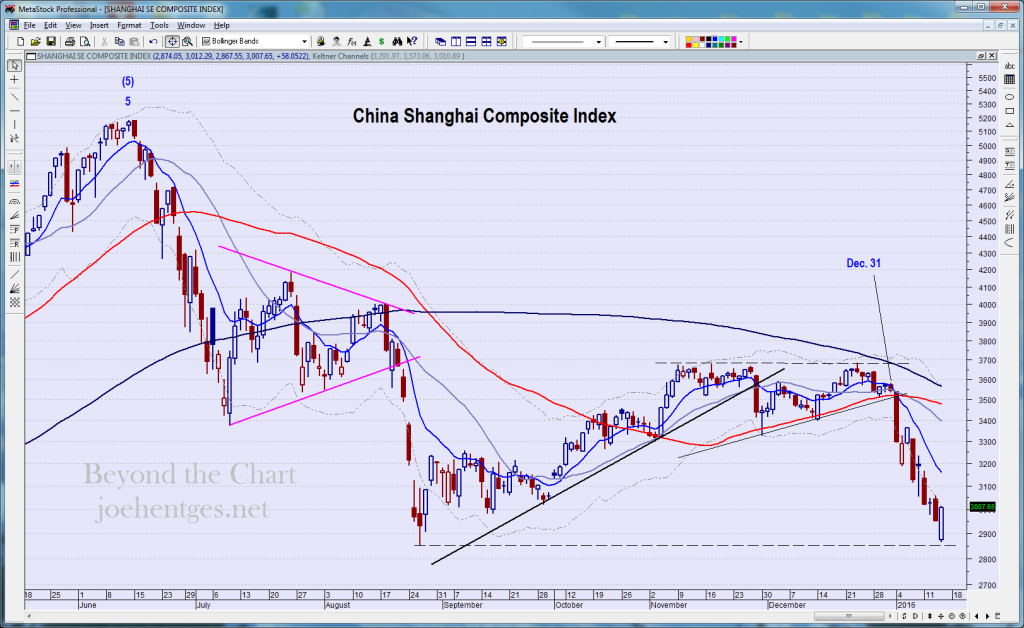
Yes it did bounce today. But one day does not a bottom make. Look at the bounces on January 5th and 6th. Look at the bounces in the decline during June to July.
Intra-day today the SSEC approached the August lows but did not break through it. Do I think it will hold? I doubt it. The China Large Cap ETF (FXI) did not hold its August lows. The China breakdown continues. See the chart below. Continue reading
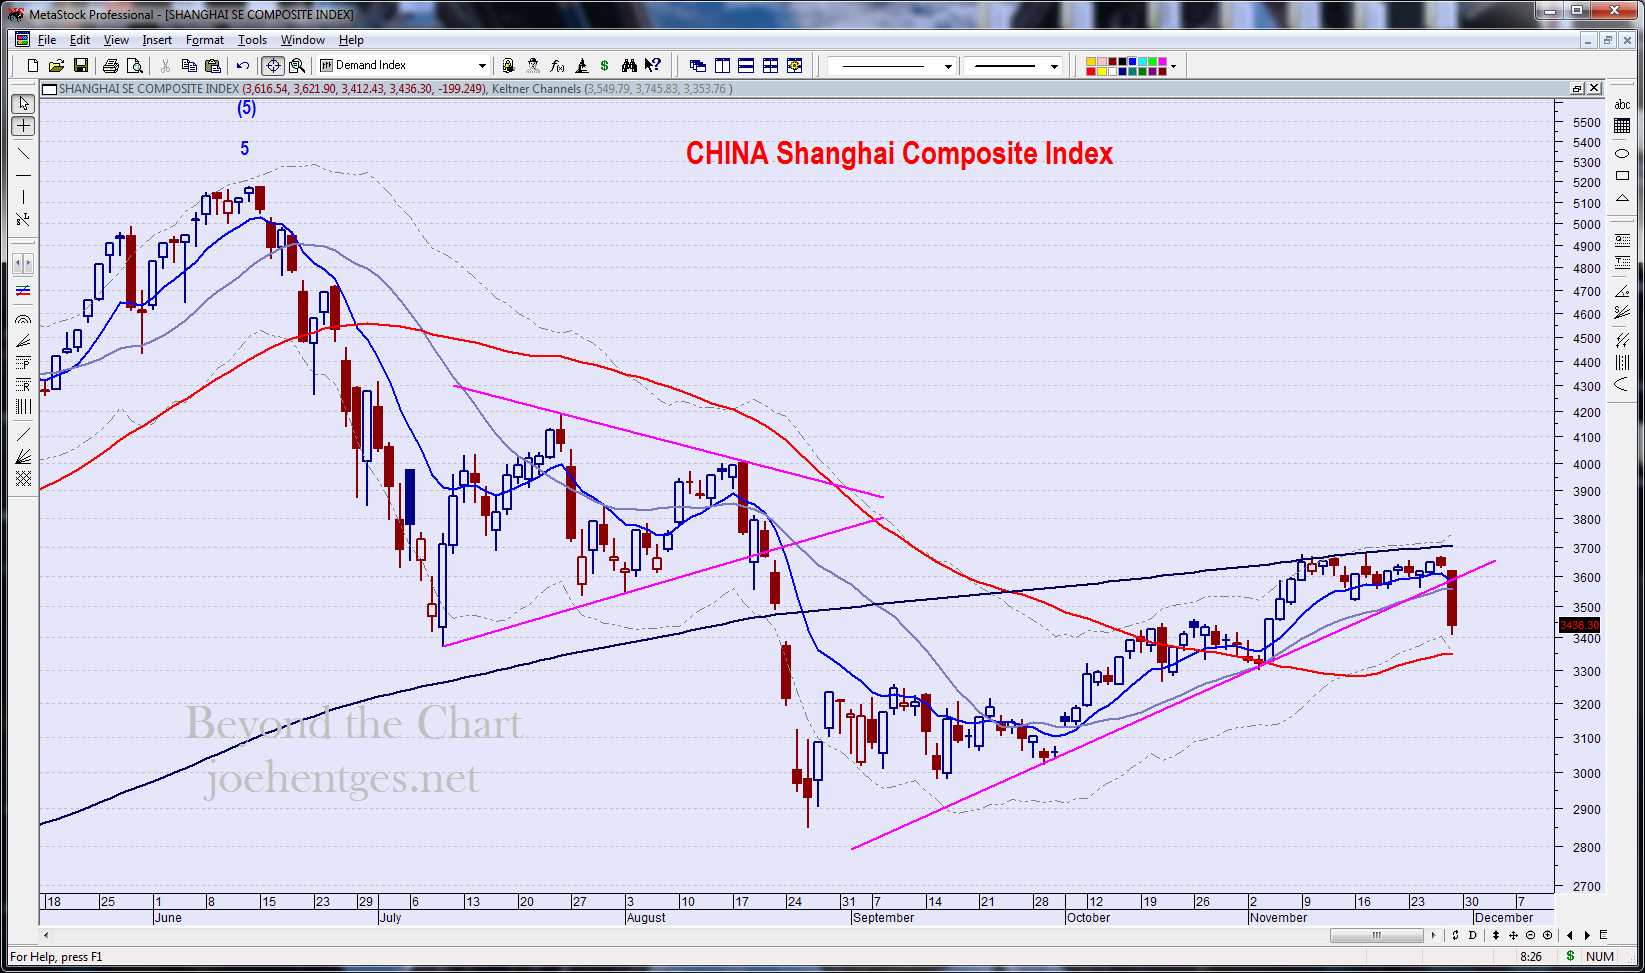 The Shanghai Composite Index (SSEC) dropped over 5% today as a another leg down appears to be starting. China is cracking down on some brokerages and this was given as the cause for the break but the press always looks for some kind of justification.
The SSEC has been in rally mode since the low on August 26th. It now appears to have broken that uptrend. Today’s move is the largest down day since August 25th. Next potential support in the 3265 – 3302 range.
Powered by WishList Member - Membership Software


 The video attached below is a very condensed version of what I provide to my Insider Members in their Weekend Market Analysis.

