 Caterpillar(CAT) cut its first quarter revenue and earnings guidance but held to the full year guidance. I should add, at least for now. I look at CAT in the brief video below.
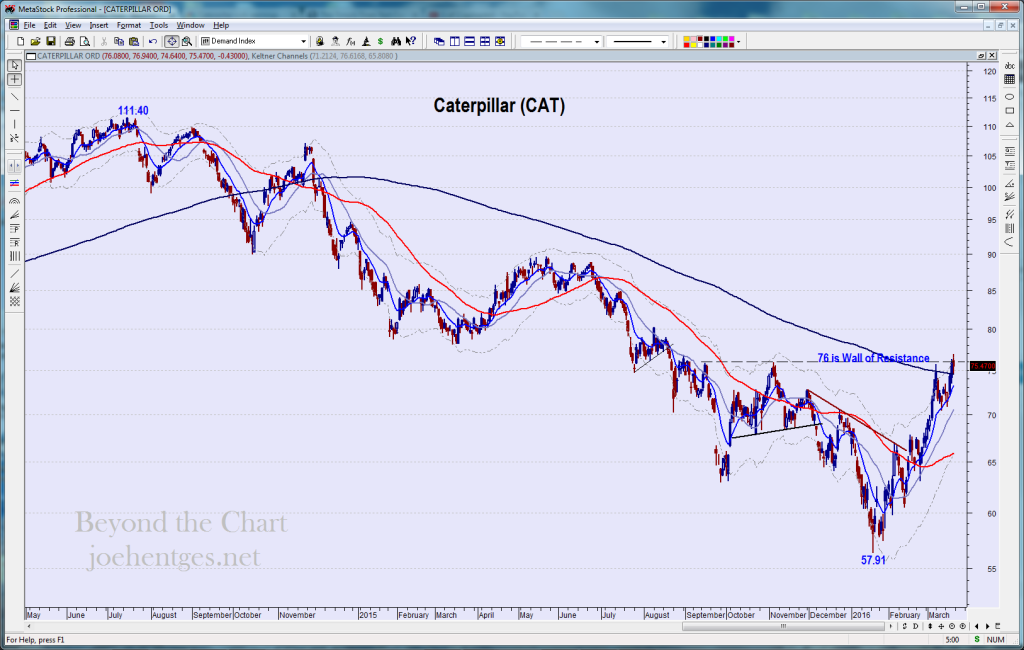
As you can see in the chart below, CAT dropped from a closing high of 111.40 in July 2014 to a closing low of 57.91 in January this year. That’s nearly a 50% drop.
It has had a nice sharp recovery since then, retracing nearly 38% of the move down. But it now seems to be hitting a wall of resistance at 76. When you look at the sales numbers they released, it makes me think there is much more downside.
This article on Zerohedge.com talks about their numbers which included a 21% drop in global sales in February after a 15% drop in January. And the February drop was the biggest one month drop in 5 years.
In today’s free video I look at the S&P 500 (SPX), the Russell 2000 (RUT), a key indicator, 3 key ETFs, CAT and the Energy ETF (XLE).
How well do you understand the trading business?

