
This week was a big down week for Under Armour (UAA) dropping $8.43 (29%) to close at $20.70. On January 31st, UAA reported disappointing earnings and forward guidance did not help.
By the way UAA is the ticker symbol for the Class A stock and replaced the original common ticker. UA is for the Class C stock.
Back on June 1, 2016 I posted a video in which I analyzed UAA’s stock. In this video I talked about how I believed that UAA had undergone an extended wave 5 in its push to the top in September 2015, and would now have a significant correction. Here is the weekly chart from that video.
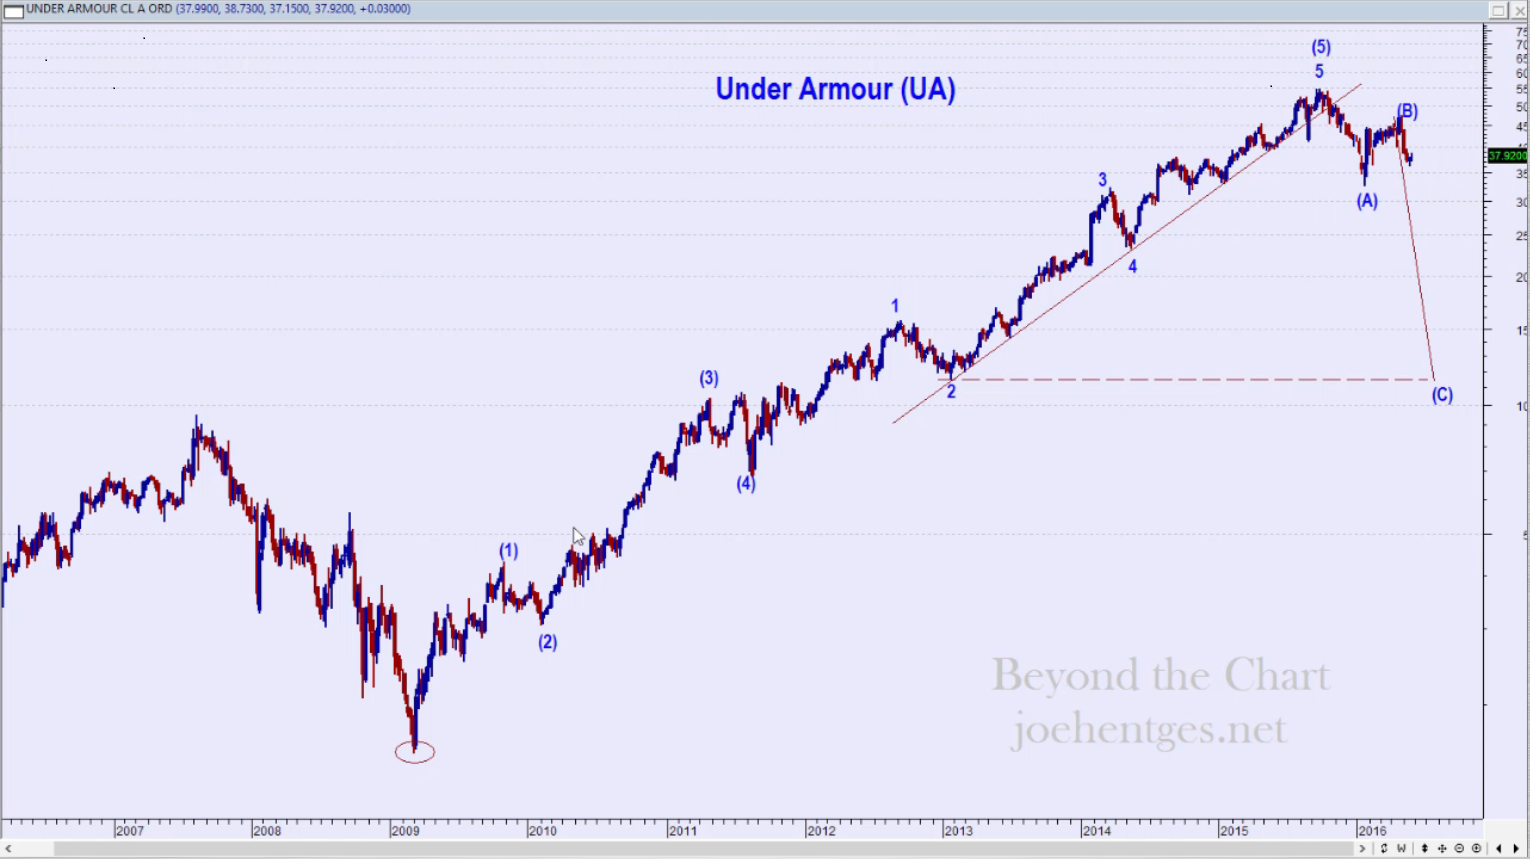
UAA had closed the prior week at $37.92. I felt that based on my analysis it would initially drop to around $11.50. After that we should get a significant rally followed by another drop that I am expecting to take it down to around $7. Here is the current chart of UAA.
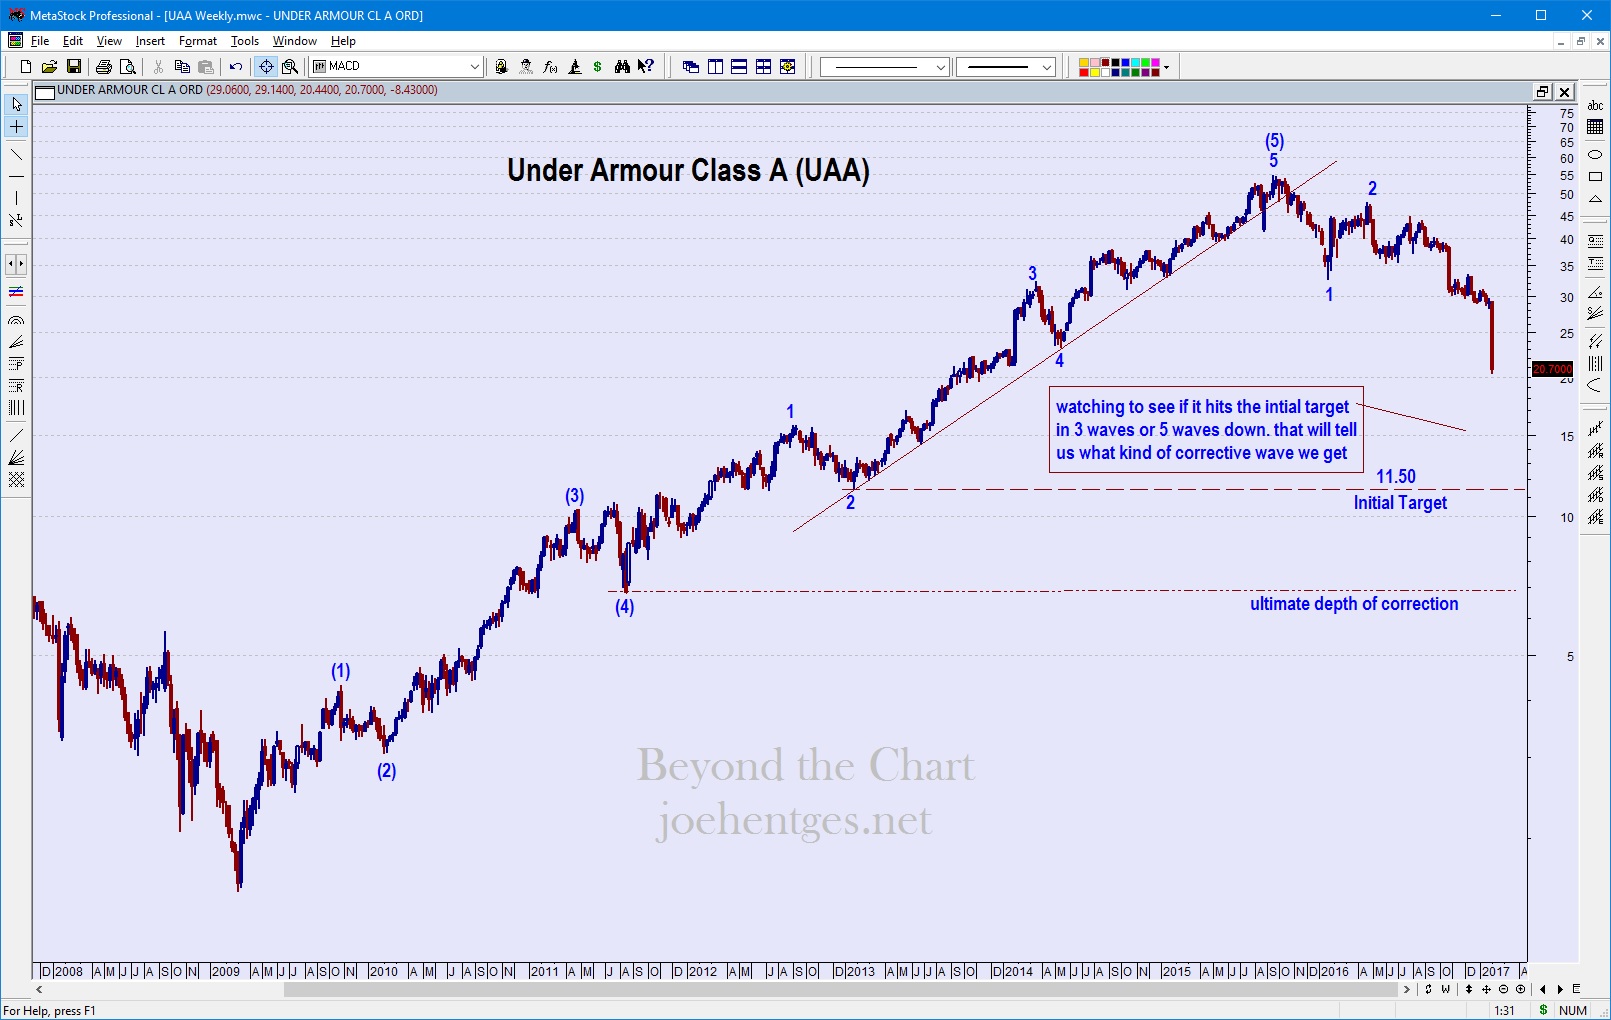
Now how UAA gets to $11.50 dictates what kind of rally we get. Are these kind of drops unrealistic? No. I just published a post about Netflix (NFLX) where I talked about the 84% decline it underwent from 2011-2012.
So stay tuned as we watch the wave structure of this move. I make no effort to analyze the fundamentals of their business. There are plenty of folks that do that. These projections are made based on price and Elliott Wave structure. The chart tells me all I need to know.
“Show me the charts…and I’ll tell you the news.”
– Bernard Baruch
Today’s brief video looks at the Nasdaq, Semiconductors ETF (SMH), Nividia (NVDA), Amazon (AMZN) and Facebook (FB).