
Category Archives for "Market Analysis"


Global Economy – Off a Cliff?
I last wrote about the Baltic Dry Index three years ago. At that time the stock market was in the midst of its second leg down in Intermediate Wave (4) of Primary 5. The Baltic Dry Index (BDI) hit an all-time low close of 290 the week of February 7, 2016 telling us the global economy was on its knees.
For perspective, until 2015 the BDI never traded below the 1986 low of 556. The all-time high was 11,612 the week of June 1, 2008. See the chart below.
The BDI hit a 4 year high the week of July 29, 2018 at 1756 and then proceeded to break down. And just recently it closed at 610 the week of February 3, 2019. This is the lowest weekly reading in 3 1/2 years. So what is this telling us?
This is telling us that the global economy hit the breaks hard in the 2nd half of 2018. The BDI struggled for 2 1/2 years to get back on its feet after the February 2016 bottom. And for longer term perspective, last week’s reading of 634 was lower than the 2008 low of 663.
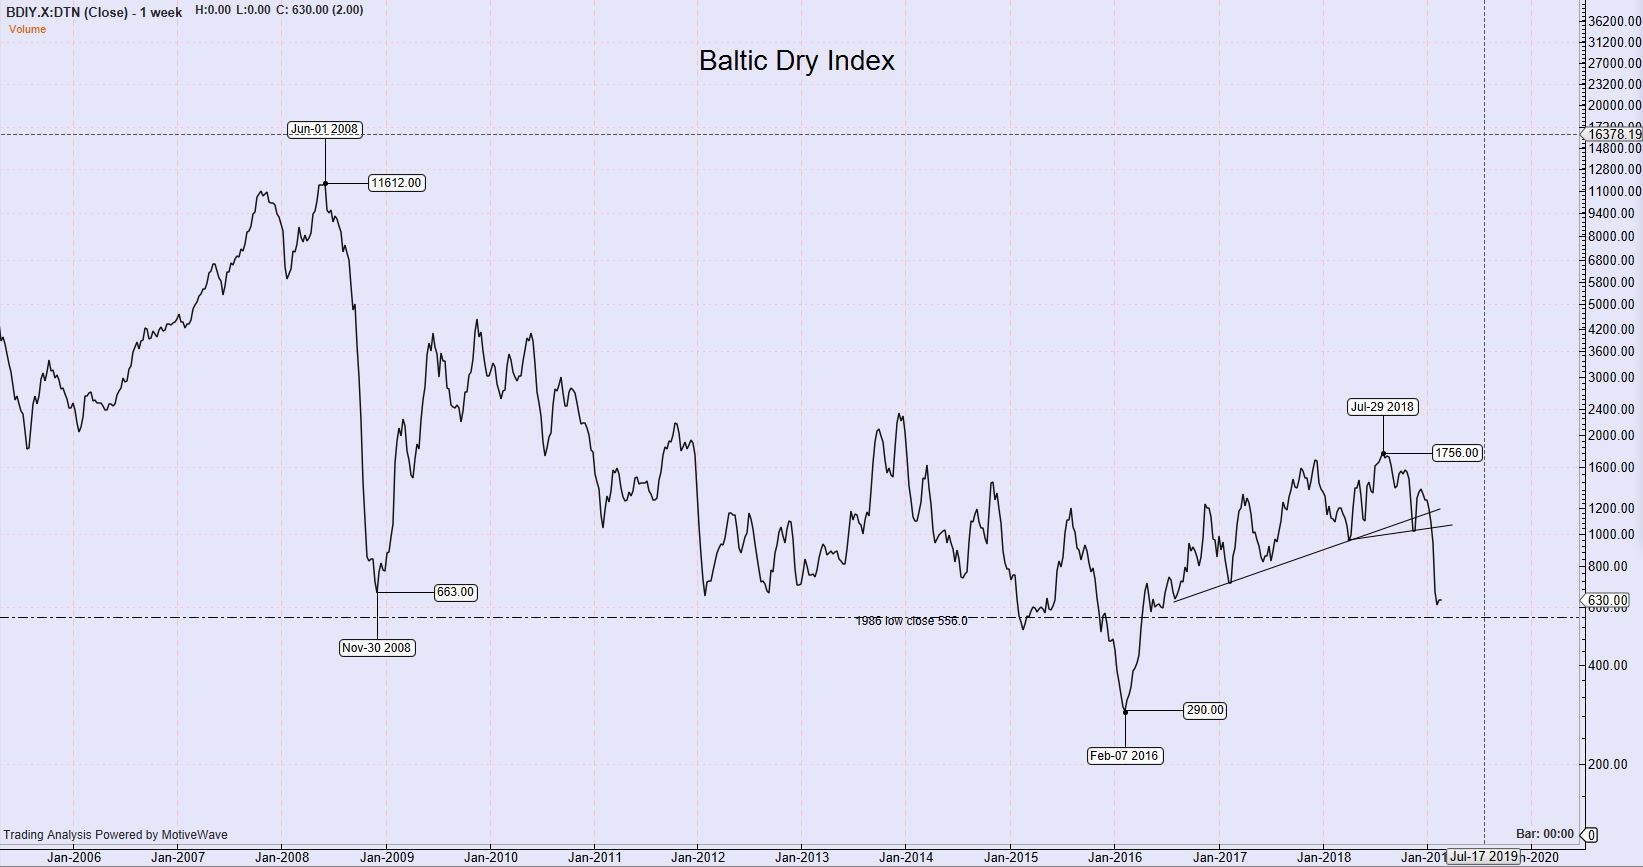
Baltic Dry Index – Weekly
So when you have UBS come out, like it did this morning, and cut Caterpillar from a buy, straight to a sell, we shouldn’t be surprised. They cited the global slowdown affecting many of CAT’s markets as the reason.
How low will the Baltic Dry Index go? Who knows for sure. No one thought in 2008 that it would drop from 11,612 to 663 in 6 months.

Yes, it’s a Bear Market
Many folks ask, when are we in a bear market? What indexes are in a bear market at this time? The commonly referenced measure as to whether we are in a bear market or not, is a 20% decline from the high.
I use closing figures for the calculation. And as for the 20% rule, I guess its better than nothing. In reality a bear market will start to reveal itself by lower highs and lower lows and a general deterioration in overall market sentiment.
So once a 20% decline is achieved then is the bear market considered to start from that point forward? No, the bear market actually began at the high and has been underway since then, but confirmed by the 20% decline.
There are 5 major indexes that I review on a regular basis. They are: Dow Jones Industrial Average (INDU) with 30 stocks, S&P 500 Index (SPX), Nasdaq Composite Index (COMPX) with 3000+ stocks, Russell 2000 Index and the NYSE Composite Index with 1900+ stocks. You will see an interesting correlation between the number of stocks in an index and the bear market.
So who entered the realm of the bear first? In the video below, I review each of those indexes and show who is considered to be in a bear market at this point in time.
So the DJIA and SPX have not hit bear market status yet. They got close but didn’t hit the 20% mark. I believe the broader indexes are leading and that the DJIA and SPX will catch up.
Once you know that we are in a bear market, adjust accordingly if you haven’t already. And remember bear market rallies can be swift and strong. But the rallies usually don’t last.
And once you’ve entered the bear’s realm, some pretty heavy duty selling can still lay ahead. In the 2007 – 2009 decline, the SPX wasn’t considered to be an official bear until July 9, 2008. And that bear didn’t end until March 9, 2009, with a whole lot of angst in between. And it can last a whole lot longer as the 1929 to 1932 bear market can attest.

Crash to Come…
LINK
It has always been clear that a decade of negative real interest rates would cause excess investment in some area or other, which would eventually bring the overinflated stock market crashing down.
Misguided share buybacks are hollowing out companies’ balance sheets and …
The crash to come will focus therefore on the major names of corporate America, which have hollowed out their balance sheets to goose the prices of their management’s stock options.

Position Sizing is Key in Options Trading
There are many aspects to trading that are important. Being able to look at a chart and read the story the chart is telling is important. Having a system or process that you use to determine setups for a trade is important. But probably most important of all is risk management. That is why I named this website, Beyond the Chart. There is more to trading than bars on the chart.
How much of my capital to risk on any one given trade. How to manage that risk with the use of stops? Where do I take my profit? I believe position sizing is one of the most important components of trading. It is especially important if you trade options or futures. Now when I talk about options trading I’m talking about directional trading using outright buys of puts and calls or buying directional spreads.
Quite a while back I read a very interesting book called “Way of the Turtle” by Curtis Faith. Curtis was one of the original Turtles (traders) mentored by Richard Dennis and William Eckhardt. In the book Curtis tells the story of the Turtles and talks a lot about risk management. I found the section on position sizing very interesting and felt that it could be adapted to options trading. Here is what I learned. Continue reading