Category Archives for "Market Analysis"

Bulls, Bears Battle Royale

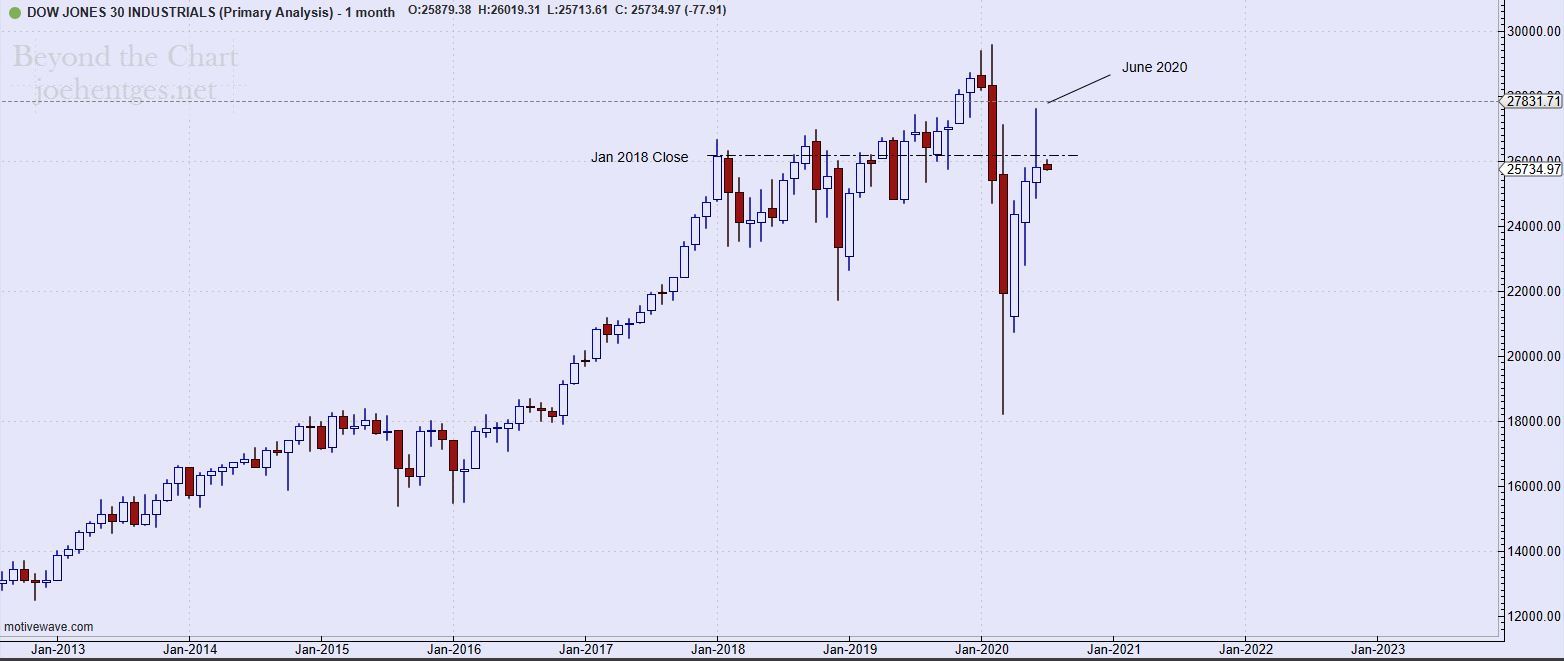
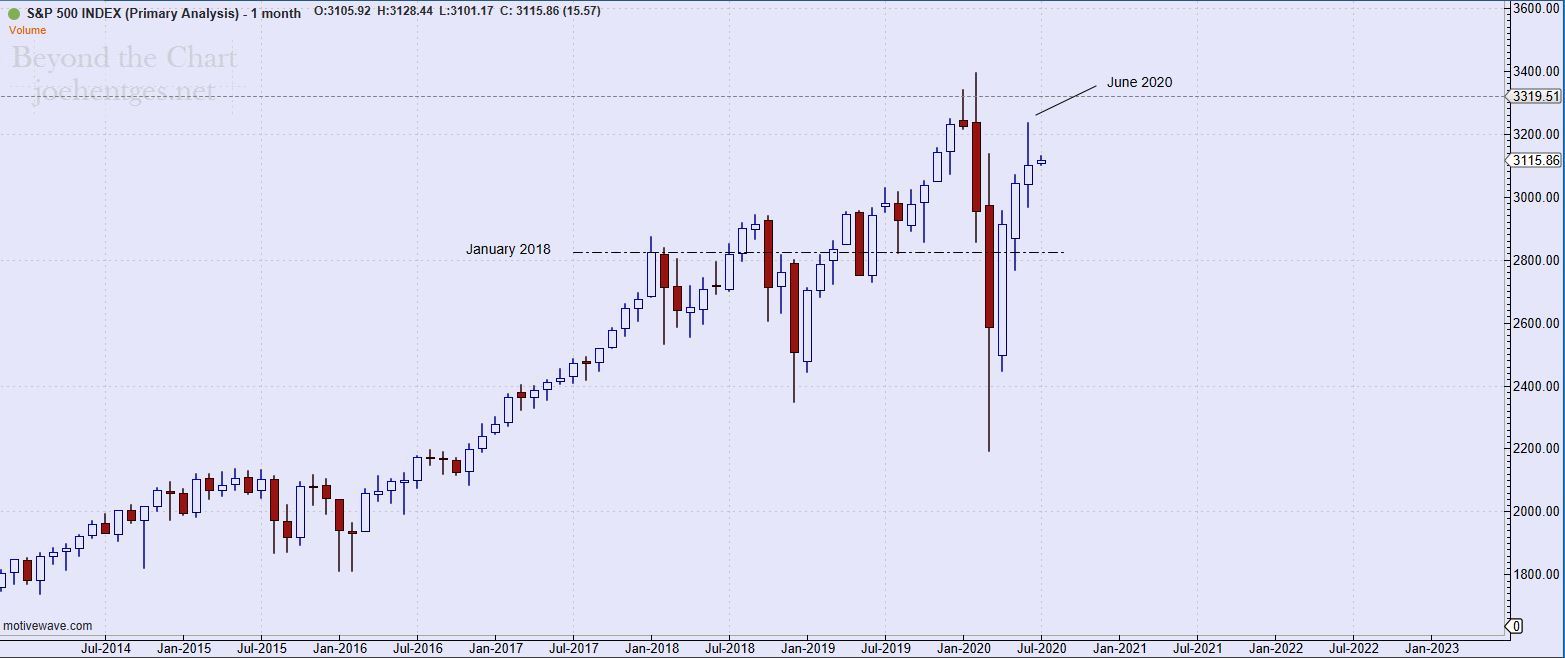
We just completed market action for the month of June and I want to provide some perspective on the three major indexes. These are monthly charts and the key level I'm highlighting is the January 2018 close.

That month was the peak of huge momentum for the markets. Since then the major indexes have been oscillating back and forth in huge gyrations. The first chart shows the Dow Jones Industrial Average (DJIA). The DJIA close June lower than the close for January 2018.  Bears are winning.

The second chart is the S & P 500 Index (SPX). It is fascinating to see that the January 2018 close resides right in the middle of all the price action since then. Bulls vs Bears is a draw at this point, with an edge to the Bulls due to higher close.

The third chart is the Nasdaq Composite Index (COMPQ).  This one has some huge oscillations also but with an upward slant to it.  There is a bit of frenzy/bubble going on here, similar to the 2000 bubble.  So far COMPQ is the only one of the three to push above the February 2020 highs. Bulls are clearly winning this battle...but for how long?

Memorial Day

Memorial Day | Remembered… Forever

The following is a post I wrote last year on Memorial Day weekend. I see no reason to change it as I am proud to remember and honor those who have gone before us. This is definitely a different holiday weekend with millions out of work and fighting a terrible pandemic. 


Here in the United States it is officially Memorial Day on Monday. Cookouts, camping, boating, the Indianapolis 500 all part of the official start of the summer season. But on this Memorial Day weekend my thoughts turn to remembering my Uncle Bob.

World War II

Uncle Bob served in the Army in World War II and the Korean War and then at the Pentagon for many years. He was a great guy and my favorite uncle. I was fortunate to have been able to spend some time with him in the late ’80s when we lived in Northern Virginia.

He would come visit the family and many times he and I would go play golf at Andrews Air Force Base and other courses around Washington D.C. I remember asking him about the war but he never wanted to talk about it. That was Uncle Bob.

Twice Honored

He didn’t want to talk about how he was in North Africa in 1943 and won the Silver Star for bravery. He didn’t talk about the Bronze Star that he received either. He didn’t talk about the fact that he was with the Army fighting their way up Italy to Monte Casino. I have a newspaper article about Uncle Bob from April 1944, with the title… “Says War Beyond Description”.

Uncle Bob died in 1990 of cancer at the age of 69. He, like my Dad, just liked those cigarettes a little too much.  Uncle Bob was laid to rest in Arlington National Cemetery. I was there when they buried him. I have his flag and his medals.

Remembering Uncle Bob and many others on this Memorial Day weekend. Remembered …forever.

Consecutive 3% Drops in S&P 500

A lot of turmoil in the stock market this week and it started with consecutive 3% declines in the S&P 500 (SPX). That kind of a move definitely gets your attention. I heard on CNBC that if the SPX were to decline by 3% for three days in a row, that would be an event that hasn't occurred since 1931 in the depths of the Great Depression.

But what about the consecutive 3% drops in the SPX? When in market history has that occurred? Well I came across article in Seeking Alpha that gives some perspective on this event. The article was created by a person that goes by the name Ploutos. I found the article very interesting. 

The article is called “A History of Consecutive -3% Days”. 

Fibonacci Levels Can Become Hurdles

I often wonder if Fibonacci numbers aren't the keys to the universe. These numbers generate the Golden Ratio ( or Mean) which equals 1.618 (inverse is 0.618).  The Golden Ratio drives the Golden Rectangle which in turn drives the Golden Spiral.  The Golden Spiral can be seen reflected in numerous places in all of nature from spiral galaxies (like the Milky Way), hurricanes, pine cones, to seeds on a sunflower. A good brief introduction to Fibonacci numbers can be viewed in the following video.

The Fibonacci ratios are important and are used for many key relationships in analyzing Elliott Wave structure and projecting future moves. But the actual Fibonacci levels themselves can play a key role that is many times forgotten or ignored.  They can become major hurdles that the market struggles to get through. Let's look at how the Dow Jones Industrial Average (DJIA) reacted at various Fibonacci levels.

Fibonacci Levels that Played Key Roles

I reviewed Fibonacci levels for the DJIA from 1928 thru present. The first key Fibonacci level was 377.  The DJIA hit that level in 1929 and then only exceeded it by 2.4% before collapsing in the 1929 crash.  
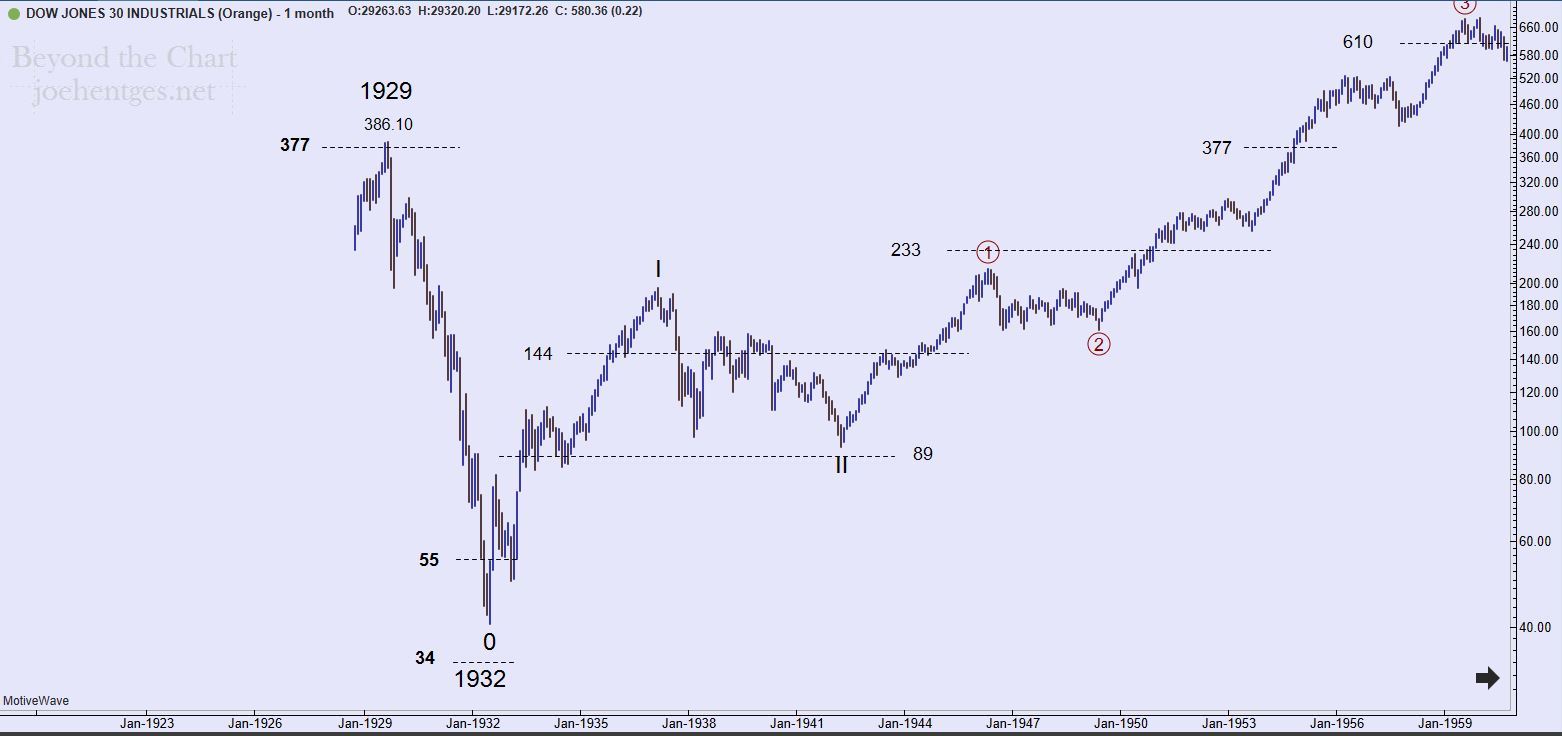
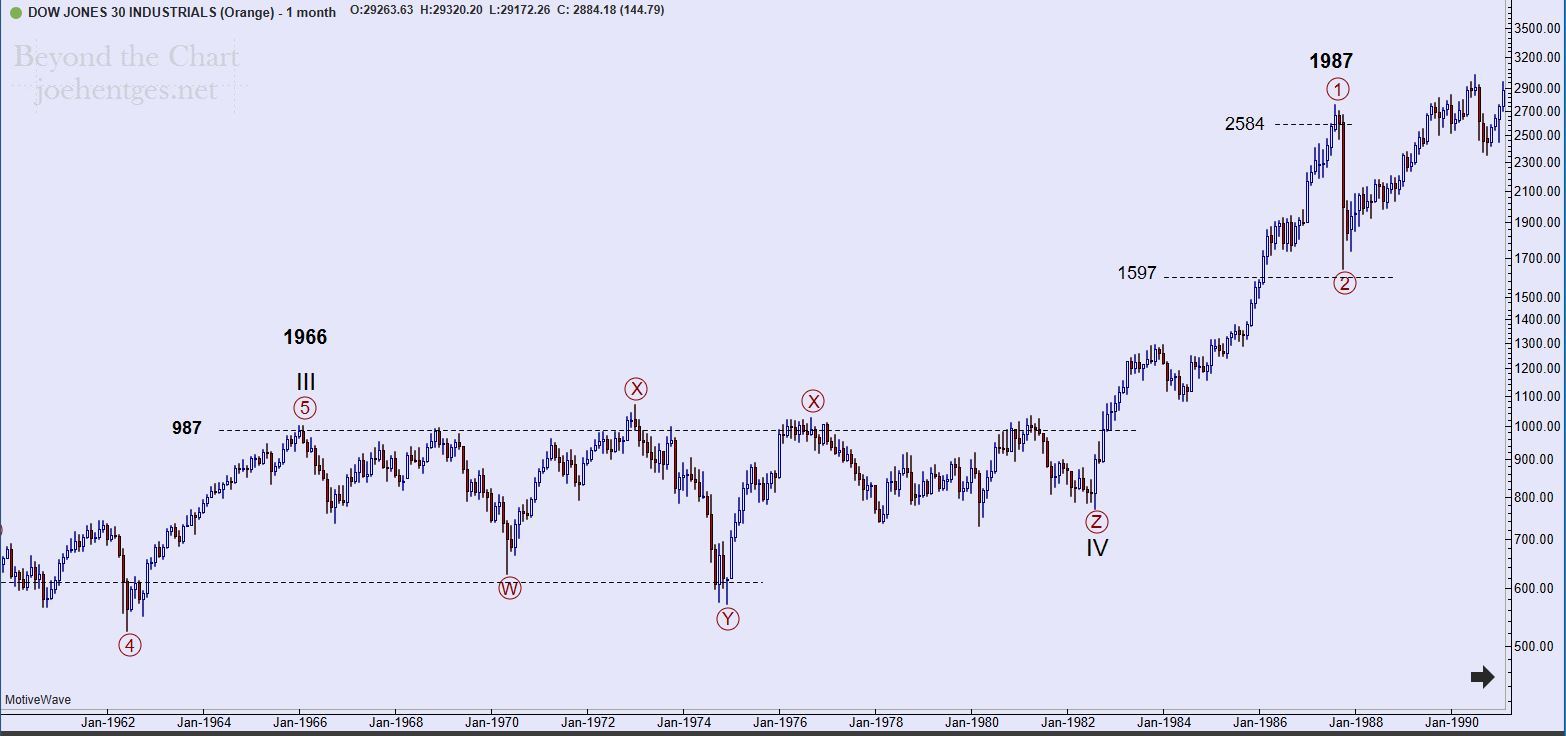
The next chart shows the end of Cycle Wave III in 1966. The DJIA exceeded the 987 Fibonacci level by just 1.4% at that high in 1966. What followed was a 16 year sideways correction. The DJIA tried 4 times to break above 987 and failed. The largest overshoot was 8.1% in January 1973.

Cycle Wave IV began in August 1982 and Primary Wave 1 (circled) exceeded the 2584 Fibonacci level by 6.3% before collapsing. Note that the prior Fibonacci level of 1597 was very close to the low of that Primary Wave 2 (circled) pullback.
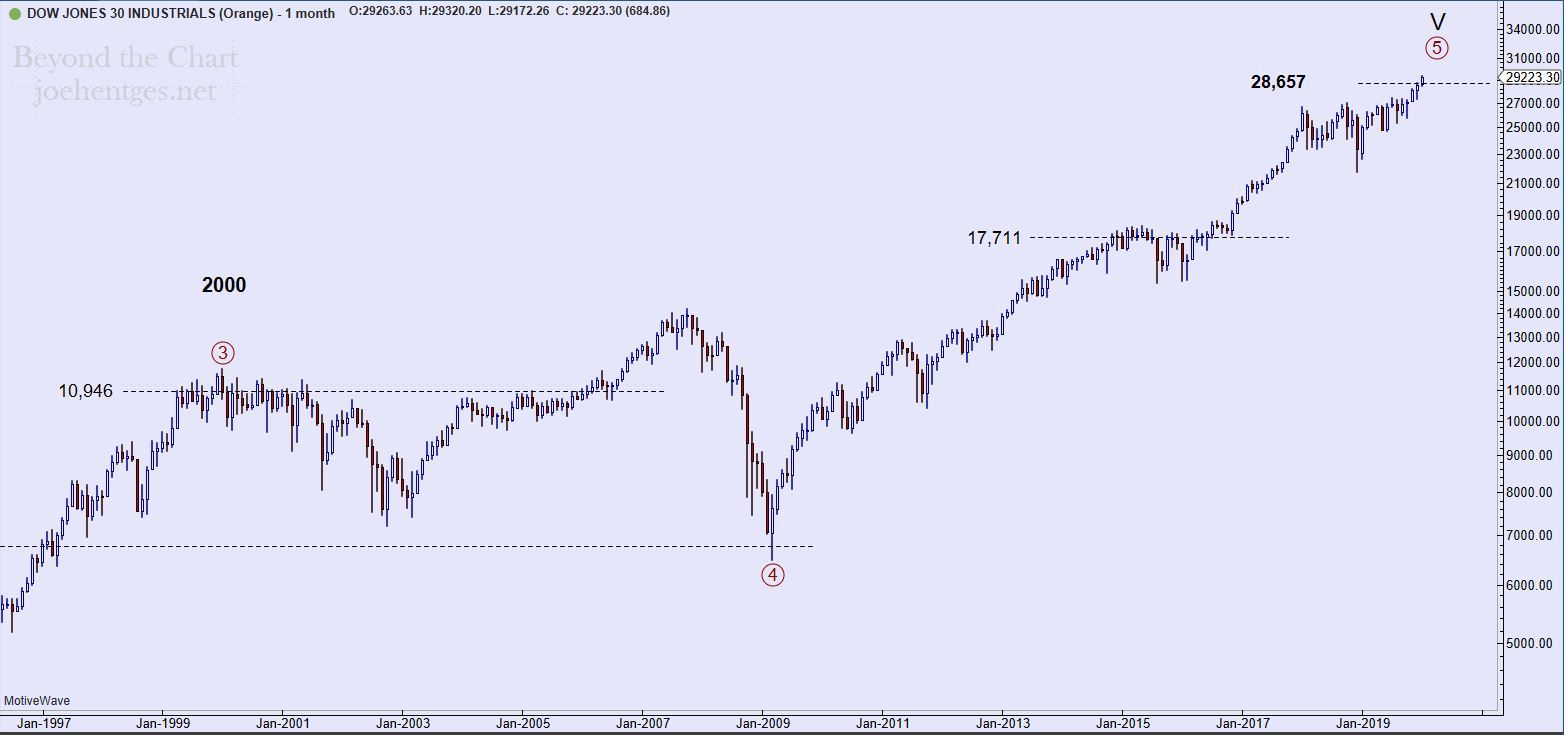
The next motive wave is Primary Wave 3 (circled) and it ended in January 2000. (see chart below) This wave exceeded the Fibonacci level at 10,946 by 7.3% before beginning a major correction. 

End of a Long Road?

So here we are at Fibonacci level 28,657 and near the end of Primary Wave 5 (circled) which is the 3rd motive wave up since 1982. Is there a guarantee that this level will define the top? No. There are  no guarantees when it comes to the stock market. But given the current market extremes and wave count, we need to be on high alert for a top. This could be the final hurdle for a long, long time.

frustrations

Markets Can Stay Irrational

As we are in the 11th year of a stock market rally off the Financial Crisis low of March 2009, a quote came to mind the other day.

“Markets can stay irrational longer than you can remain solvent.” – John Maynard Keynes

This quote was attributed to Keynes in the 1930s when the stock market was a very trying time. But indeed this saying applies to any market…stocks, futures, currencies, etc.

As our stock market continues to defy gravity and valuations remain near levels seen only in 1929 and the late 90’s (see the CAPE ratio) it is good to keep this quote in mind.

Powered by WishList Member - Membership Software