
I last wrote about the Baltic Dry Index three years ago. At that time the stock market was in the midst of its second leg down in Intermediate Wave (4) of Primary 5. The Baltic Dry Index (BDI) hit an all-time low close of 290 the week of February 7, 2016 telling us the global economy was on its knees.
For perspective, until 2015 the BDI never traded below the 1986 low of 556. The all-time high was 11,612 the week of June 1, 2008. See the chart below.
The BDI hit a 4 year high the week of July 29, 2018 at 1756 and then proceeded to break down. And just recently it closed at 610 the week of February 3, 2019. This is the lowest weekly reading in 3 1/2 years. So what is this telling us?
This is telling us that the global economy hit the breaks hard in the 2nd half of 2018. The BDI struggled for 2 1/2 years to get back on its feet after the February 2016 bottom. And for longer term perspective, last week’s reading of 634 was lower than the 2008 low of 663.
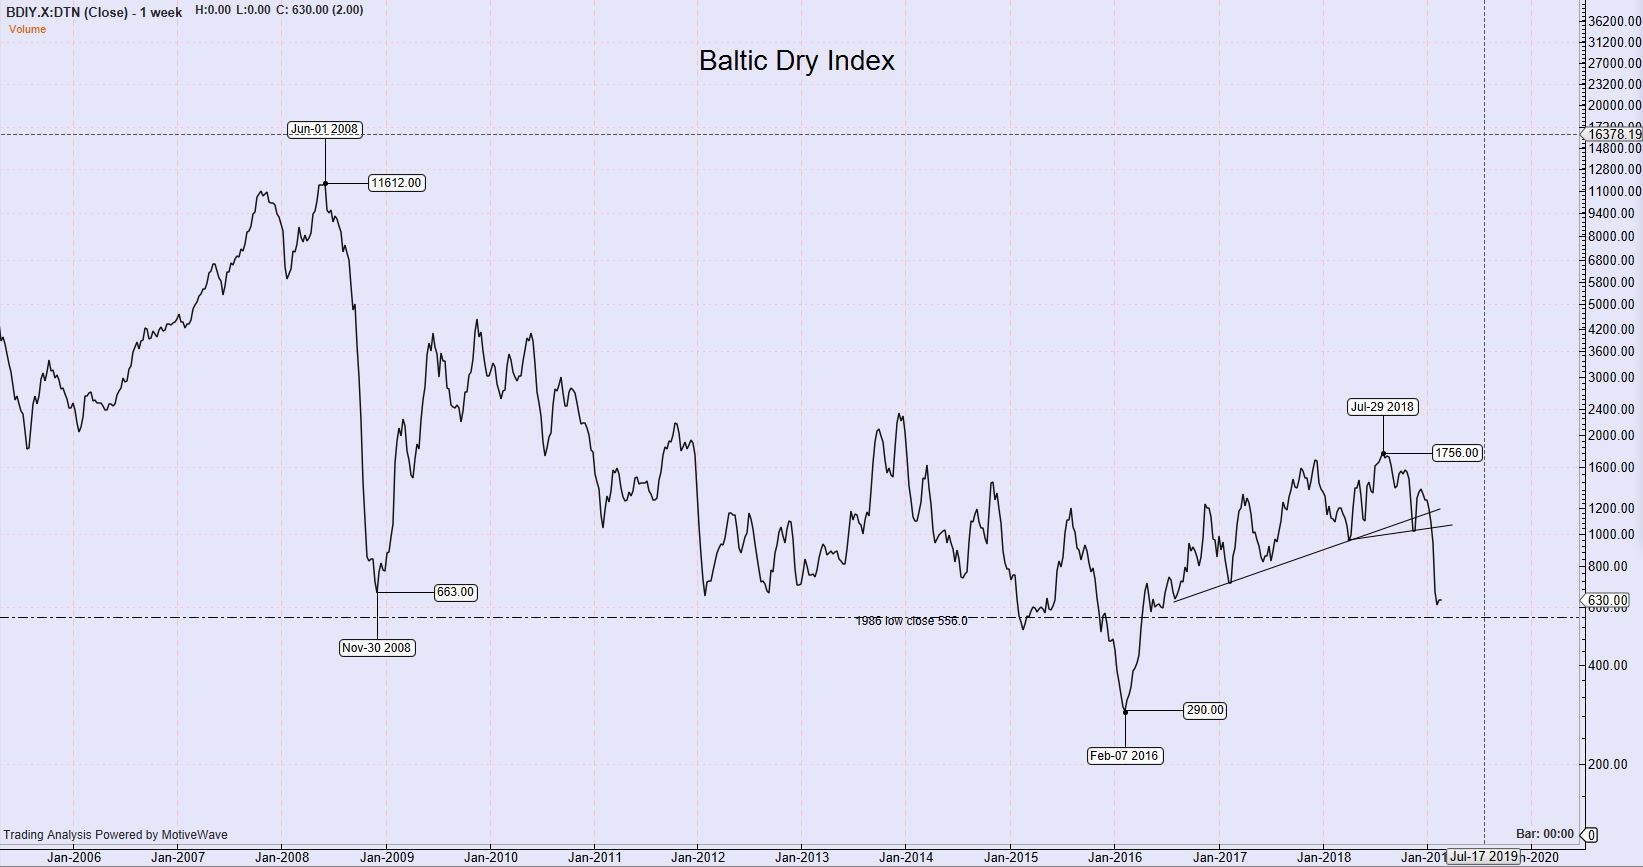
Baltic Dry Index – Weekly
So when you have UBS come out, like it did this morning, and cut Caterpillar from a buy, straight to a sell, we shouldn’t be surprised. They cited the global slowdown affecting many of CAT’s markets as the reason.
How low will the Baltic Dry Index go? Who knows for sure. No one thought in 2008 that it would drop from 11,612 to 663 in 6 months.