Options Market

Option Sentiment Provides a Warning

This post is based on information provided daily to the Insider Membership.

I like looking at option sentiment because it tells you what people are actually doing versus what people say they are doing. When I talk about option sentiment I’m talking about the level of trading in puts and calls.  For those of you unfamiliar with options, a call option is simply a contract that allows you to make money when a stock or index goes up. A put option allows you to make money when a stock or index goes down.

So when there is significantly more activity in calls versus puts that is a sign that bullishness is getting extreme. Another way to look at this is simply puts versus calls and that is why it is called the Put/Call ratio. Overall there is more bullishness in the market than bearishness so you have to take that into account when looking at option sentiment.

The data I look at comes straight from the Chicago Board of Options Exchange (CBOE).  And specifically I look at option trading on equities only. So just stocks, not indexes.  I’ve kept this data since November 1, 2006.  I have the raw data and then calculate the 10 day moving average. This is what I use for the primary signal for option sentiment.  Sometimes an individual day will also give a clue as to what might be happening.

So I bucket my signals into excessive, extreme and ultra extreme categories for both bullish and bearish scenarios.  Usually the data will provide signals that are several days to weeks long but sometimes it is only just one day.  I think of the excessive readings as warning flags that something is up and things could be about to change. If that reading is just a one day signal, it’s kind of a “shot across the bow” warning.

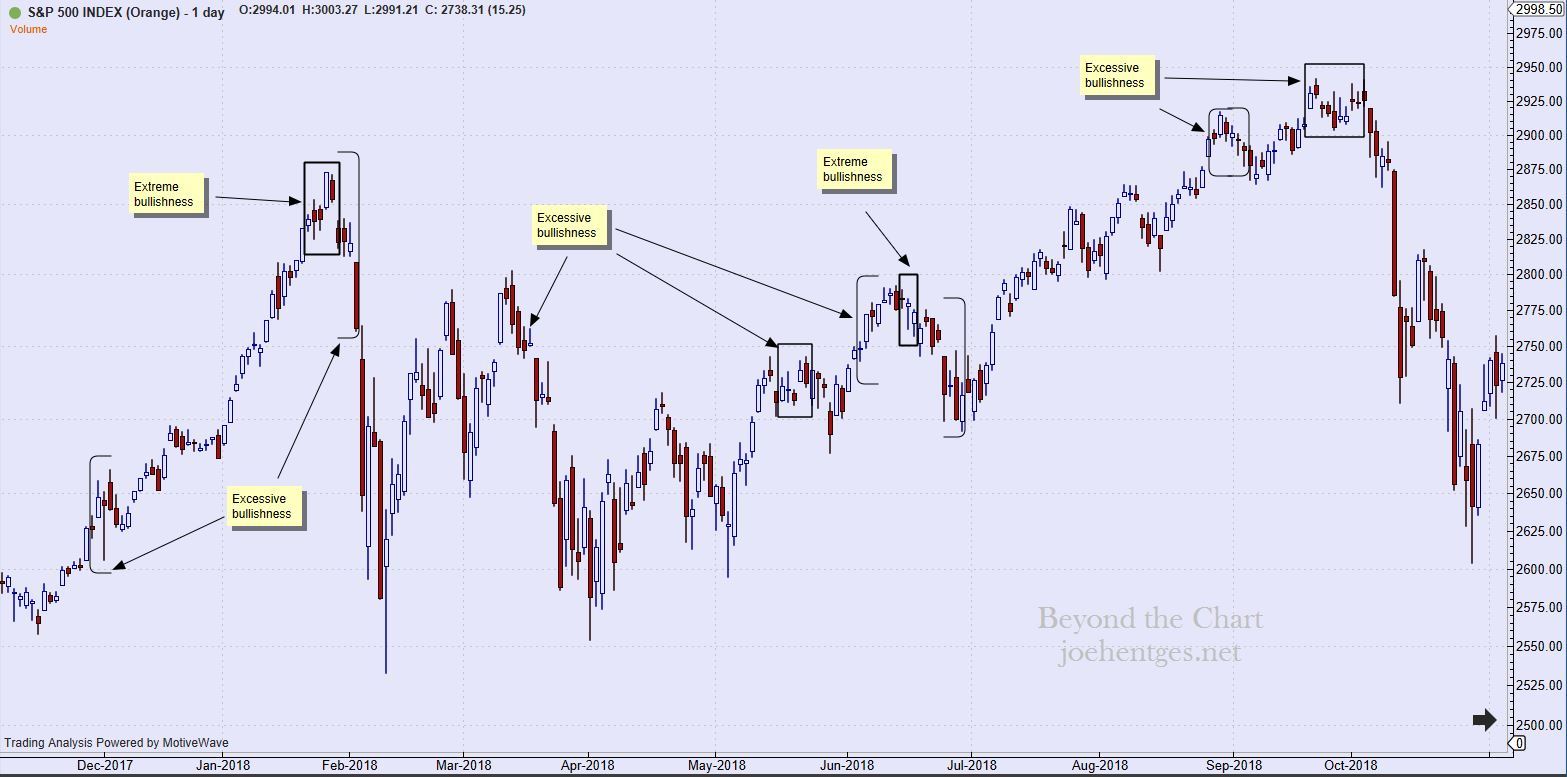
I am not going to share the actual levels that define these various categories, as that would not be fair to the Insider Members. But let’s take a look at where these signals have occurred over the last 2 years. The two charts below are for the S&P 500 Index (SPX) and show the daily view. In the first chart, there was a tremendous period of excessive bullishness that lasted 9 weeks and included a 6 day period of extreme bullishness right at the top, January 23-30, 2018.

The period in May and June 2018 also had a couple instances of excessive and one period of extreme bullishness but no market collapse. After the huge break in early February it was almost as if option traders were expecting the next shoe to drop but nothing major happened. It started to sell off in mid-June but then turned around.

Then came the warning flags in late August and late September that preceded the huge selling avalanche of the 4th quarter. That 2nd period of excessive bullishness lasted from September 20 to October 3.


Daily view from Nov 2017 thru Oct 2018

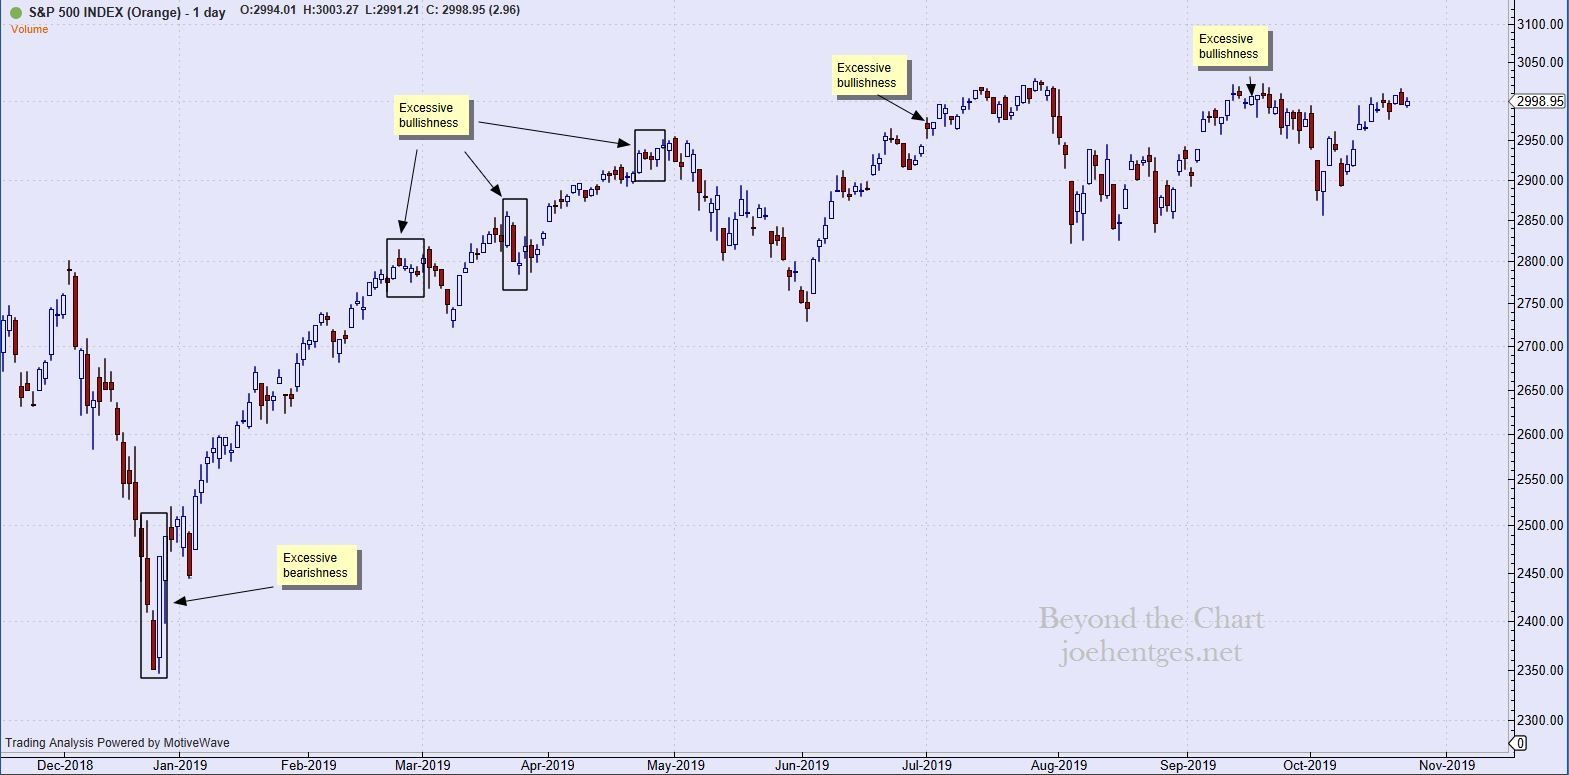
The next chart begins with December 2018 thru today.  The selling in December got extreme and this too was reflected in the Put/Call ratios.  Then we got the huge rally in January that just kept on pushing higher.  First warning flag appeared in late February but only resulted in a minor pullback. The second warning seemed to coincide with the minor pullback in late March but that too did not go anywhere.

Then came the third period of excessive bullishness in late April and that preceded a pretty strong selloff into mid-June. But since late April the only signals sent were one day “shots across the bow” at the beginning of July and in mid-September.  I view these one day signals as if they were a flare sent up.  Not enough to raise the warning flag, like on a beach for danger, but enough to say, ‘heads up’.


Daily view from Dec 2018 thru Oct 23, 2019


price of gold

Gold Still Trending Higher

This post is based on an excerpt from the Weekend Market Analysis published for the Insider Membership.

The chart below shows the weekly view for the Gold ETF (GLD).  Gold is tracing out a large ZigZag corrective pattern. The first leg down was Primary Wave A (circled) that completed in December 2015. The next wave is Primary Wave B (circled) that doesn’t appear to be complete yet. Wave B (circled) consists of 3 waves: Wave (A) that ended in July 2016, a triangle Wave (B) that ended in April 2019 and a Wave (C) that still appears to be underway.


Data thru Friday, October 11


This next image shows a little more detail to what looks like the final leg up. At this point I have labeled Minor Waves 1,2, 3 and 4 of Wave (C).  Since waves 1 and 3 are fairly equal in size, I am looking for Wave 5 to be larger than wave 1 or 3, as it pushes higher. We still don’t have confirmation that Wave 4 has finished, but we may be getting close.


Data thru Friday, October 11 (this is an image from a video)

Outliers Make all the Difference

The word outliers became a popular word I believe, after Malcolm Gladwell wrote the NY Times best seller, “Outliers, the story of success” in 2008. 
 
In the book he talks about several successful people and came up with the 10,000 hour rule. His rule said that to achieve world-class success, one needs to practice your craft for 10,000 hours.  
 
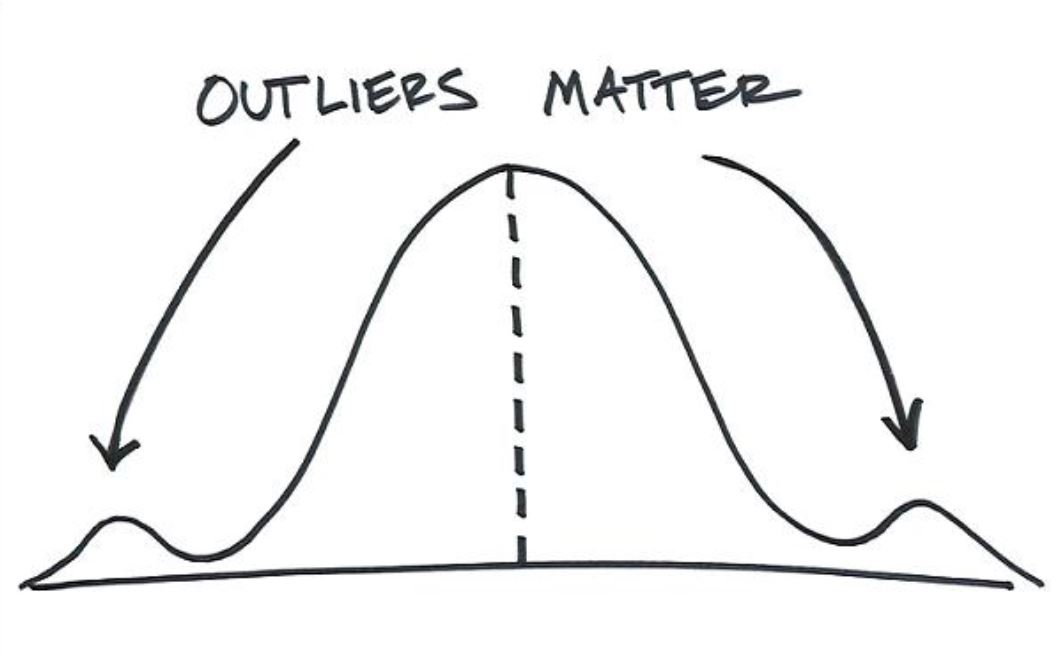
The 10,000 hour rule is an interesting idea and one that could apply to trading. But what I want to focus on today is the concept that an outlier is a trade, a trading day, week or month that can make your year.

Outliers and Losses

So what this concept does is support the philosophy of cutting your losses short. In order for outliers to help your trading you will have many smaller trades, days or weeks that offset each other.
 
And therefore the larger more successful trades will power thru and make your P&L. But that won’t happen if you let losses get out of control and offset the big winning trades.
 
Marty Schwartz in his book “Pit Bull” talks about this concept. Marty started out trading options but then moved to trading futures. 
 
“For two hundred days a year, I’d end up with reasonably small losses netted out with similar-size gains. Lose $5,000 here, make $6,000 there, round after round, twenty, thirty, forty times a day.
 
But I’d win the other fifty trading days by clear unanimous decisions. Smack the bonds for $75,000, hit a stock for $100,000, nail a couple of options for $125,000, pound the S&P s for $150,000.
 
Over time it made me a big winner, to the tune of $5 million a year.” 
 
                                                   – Marty Schwartz from “Pit Bull”

Fifty Days

What I want you to focus on is not the 20-40 times a day he traded or that he could make $5 million a year.  Focus on the 200 days out of 250 he would basically break even.  

That left 50 days that would be his outlier days.  The days that made his month and year. So what do outliers have to do with trading? Everything.


Memorial Day

Memorial Day | Remember Them

This following is a post I wrote last year on Memorial Day weekend. I see no reason to change it as I am proud to remember and honor those who have gone before us.  I am living free in this beautiful country because of their sacrifice.


Here in the United States it is officially Memorial Day on Monday. Cookouts, camping, boating, the Indianapolis 500 all part of the official start of the summer season. But on this Memorial Day weekend my thoughts turn to remembering my Uncle Bob.

World War II

Uncle Bob served in the Army in World War II and the Korean War and then at the Pentagon for many years. He was a great guy and my favorite uncle. I was fortunate to have been able to spend some time with him in the late ’80s when we lived in Northern Virginia. Continue reading

1 3 4 5 6 7 56

Powered by WishList Member - Membership Software