

Today the focus is on State Street Global Advisors (SSGA)’ Financial Select Sector SPDR Fund (XLF). This ETF is usually either the number 2 or number 3 most actively traded non-index ETF. 3 month average daily volume of a little over 40 million shares.
Sector Changes
In June S&P Dow Jones Indices and MSCI, Inc. announced they were modifying the S&P sectors to remove real estate from the financials (except mortgage REITS) and create a new S&P real estate sector.
So in order to continue accurately tracking the sectors, SSGA announced they were removing real estate holdings from the XLF and creating a new ETF called the The Real Estate Select Sector SPDR Fund (XLRE).
Special Dividend
Removing real estate from the Financials will take place after the close on September 16. XLF will issue a special dividend to its shareholders as part of this adjustment. Ex-dividend date is September 19. The dividend will be in the form of shares of the new XLRE fund.
So going forward starting September 17, XLF will include securities of diversified financial services, insurance, banks, capital markets, consumer finance, thrifts and mortgage finance, and mortgage real estate investment trusts (REITs).
The chart of XLF is discussed in the brief market wrap video shown below. The three largest holdings in XLF are Berkshire Hathaway Inc. Class B, at 9.18%, JP Morgan Chase & Co. at 8.01% and Wells Fargo & Company at 7.59%.
Berkshire Hathaway Class B
Berkshire Hathaway Class B (BRK.B) is in a solid uptrend since the financial crisis low. It is in its 5th wave, Intermediate Wave (5). It is now in Minor Wave 3 of Wave (5) and closed very nearly on its high for the day on Friday and for the week.
The high in December 2014 is the all-time high and the stock if very close to breaking that.
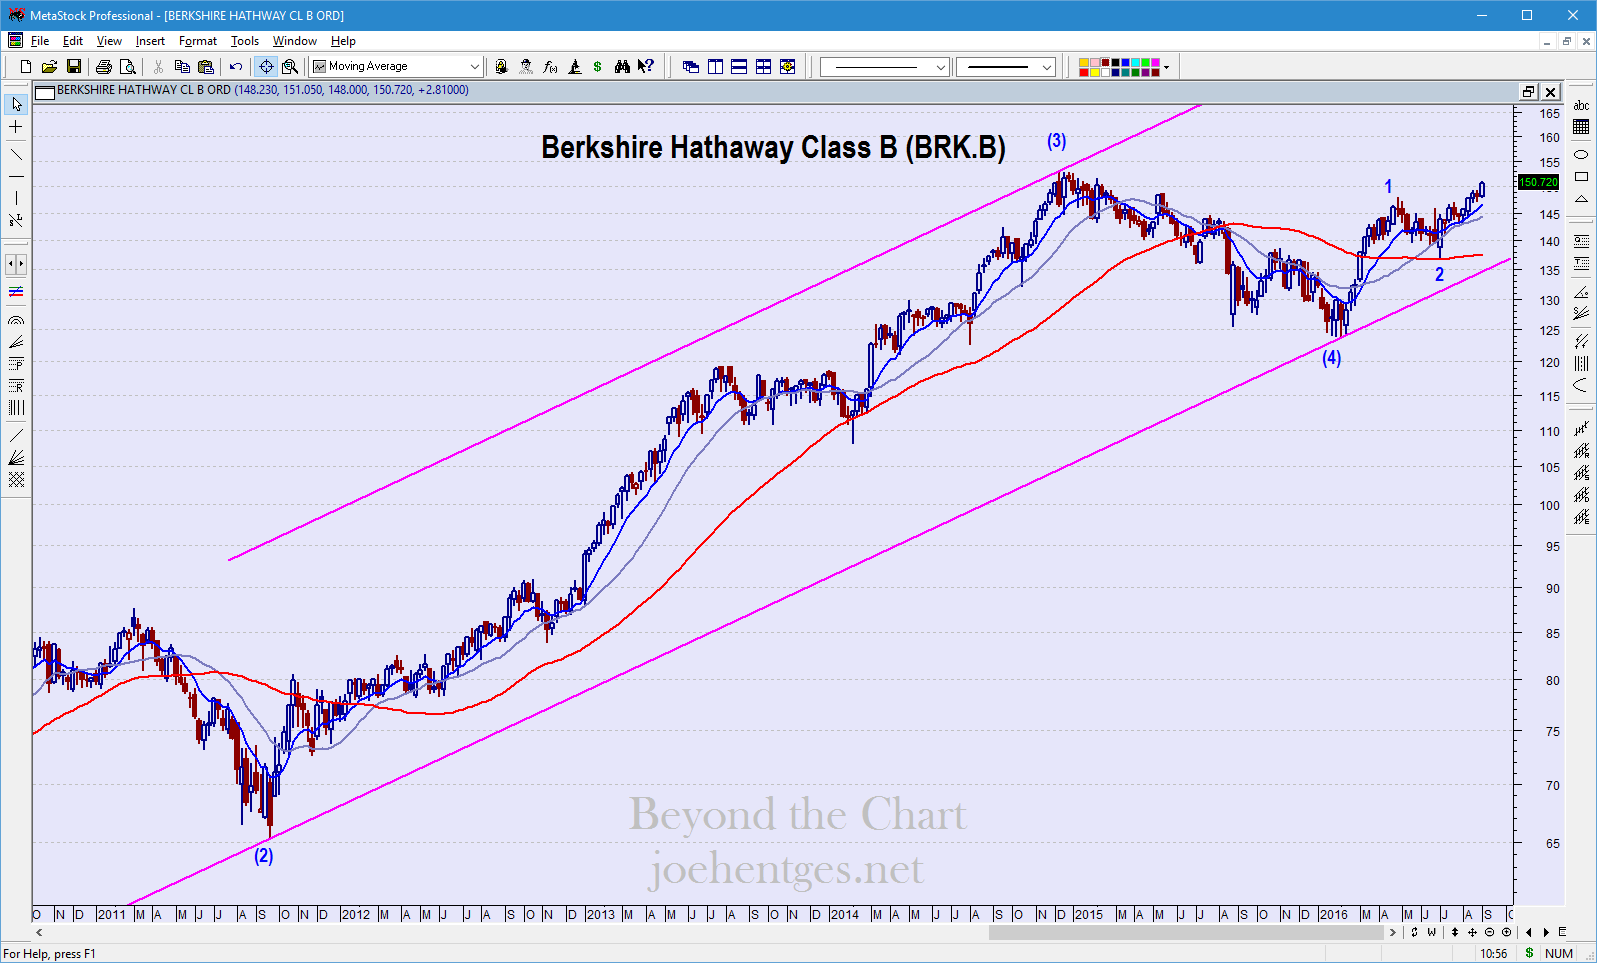
Weekly Chart, December 2011 – Sept 2, 2016
JP Morgan Chase & Co.
JP Morgan Chase & Co (JPM) is also in a solid uptrend since March 2009. The Elliott Wave count is the same as BRK.B. It also pushed nicely this week, closing at 67.49, +$1.27 for the week and near the high of the week which occurred on Friday.
JPM had its all-time high in July 2015 and now appears to be making a run at it. The Elliott Wave count projects to the upper end of the channel. One note about the channel lines. The bottom line connects Wave (2) and Wave (4). The upper line projects from the end of (3).
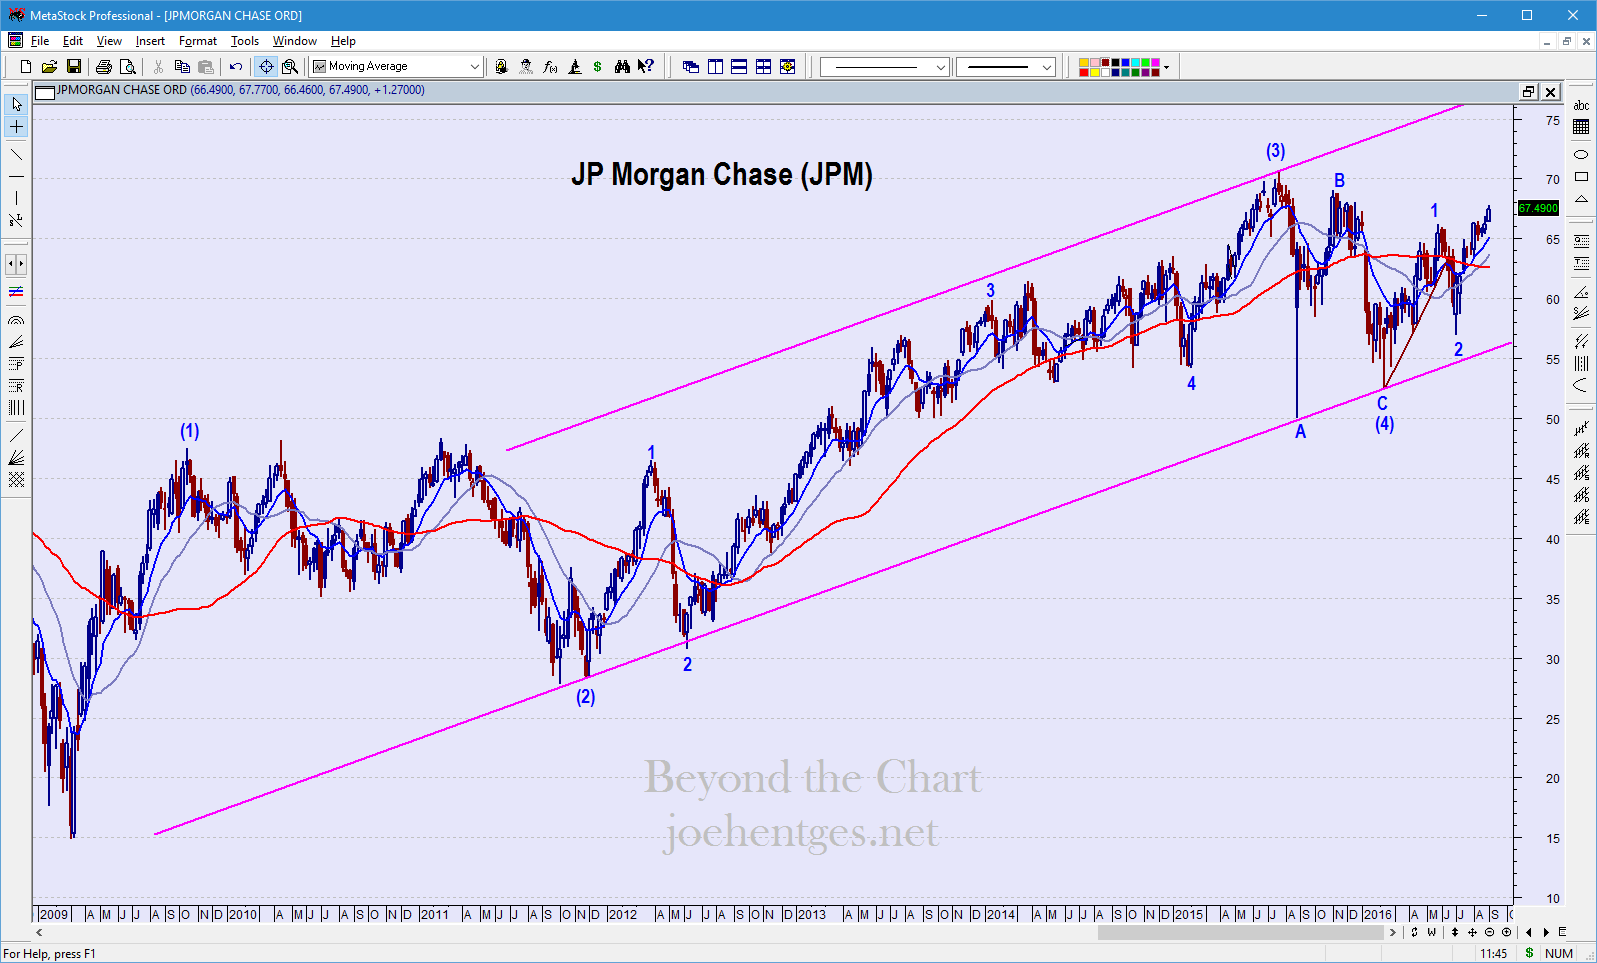
Weekly Chart January 2009 – September 2, 2016
Wells Fargo & Company
Wells Fargo & Company (WFC) rounds out the top three holdings of the Financials ETF. It is also in a sold uptrend from the financial crisis lows. The Elliott Wave count since February is not as clear so I’m just leaving it off. The move from the week ending February 12 thru April 29 is choppy and overlapping.
WFC is lagging the other two financials and is much further away from its all-time highs. It needs to push thru resistance at 51 – 51.50 short term.
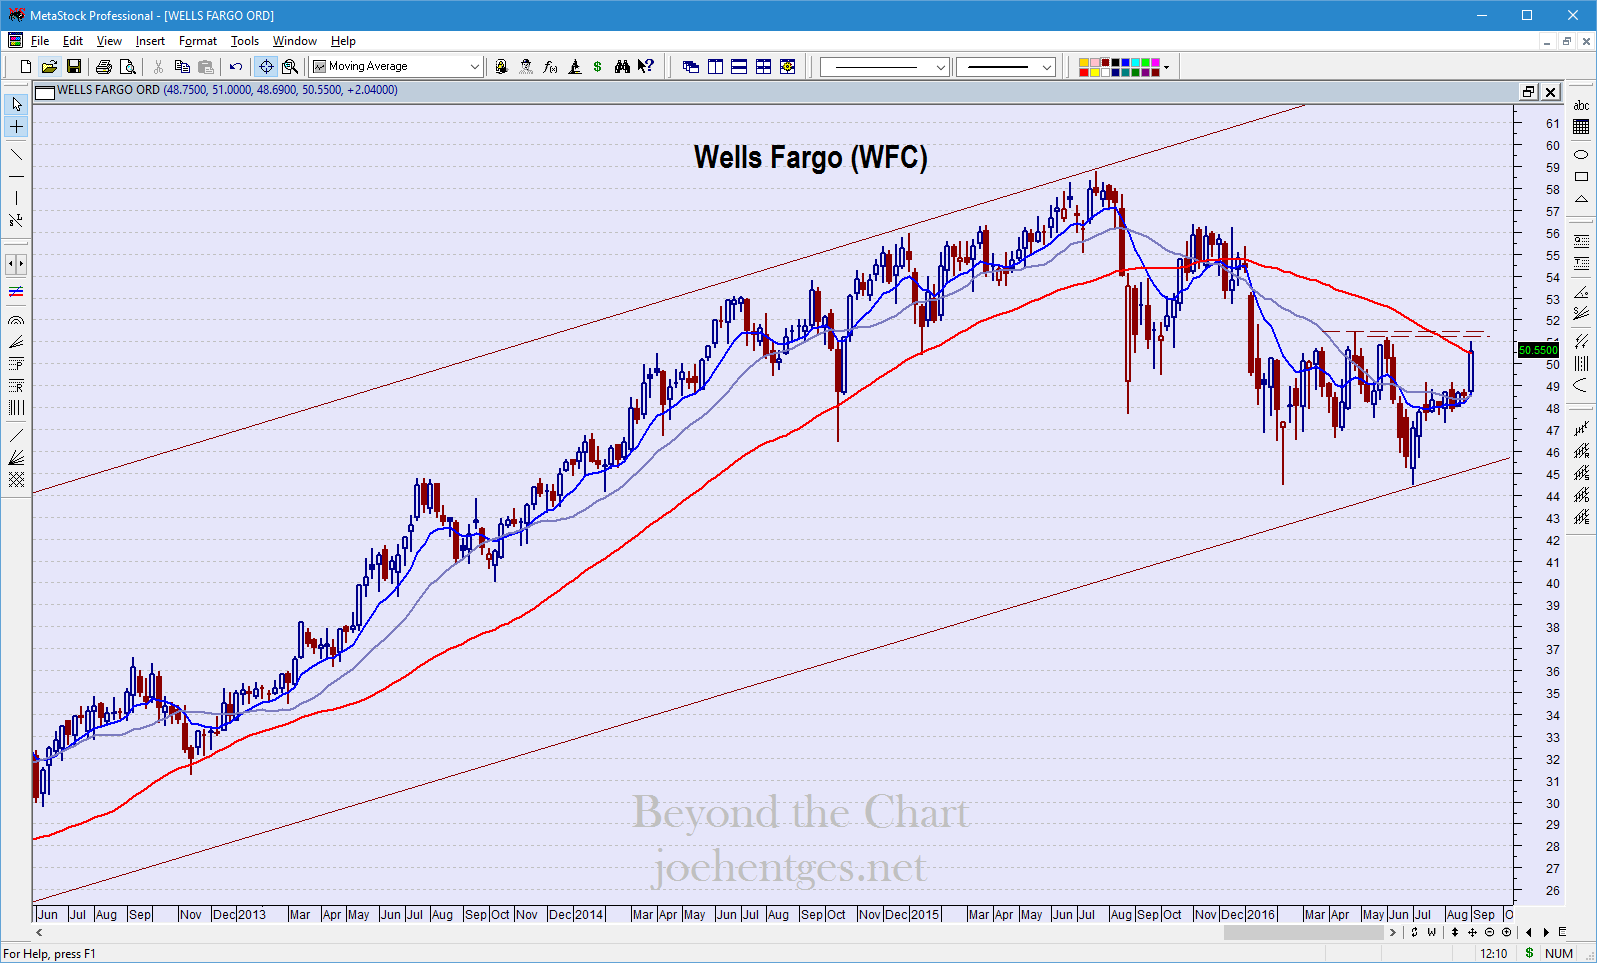
Weekly Chart June 2012 – September 2, 2016
Next week my focus will be on the Energy Select Sector SPDR ETF (XLE).