Fed Cut Rates…Now What?

The Federal Reserve (Fed) cut the Federal Funds rate by 50 basis points or 0.50% on September 18. So does this mean that the economy is so weak that the stock market will sell off or is something else going on? Let's review what's happened in the last 30 years, 1994 to 2024. 

Mid-90's

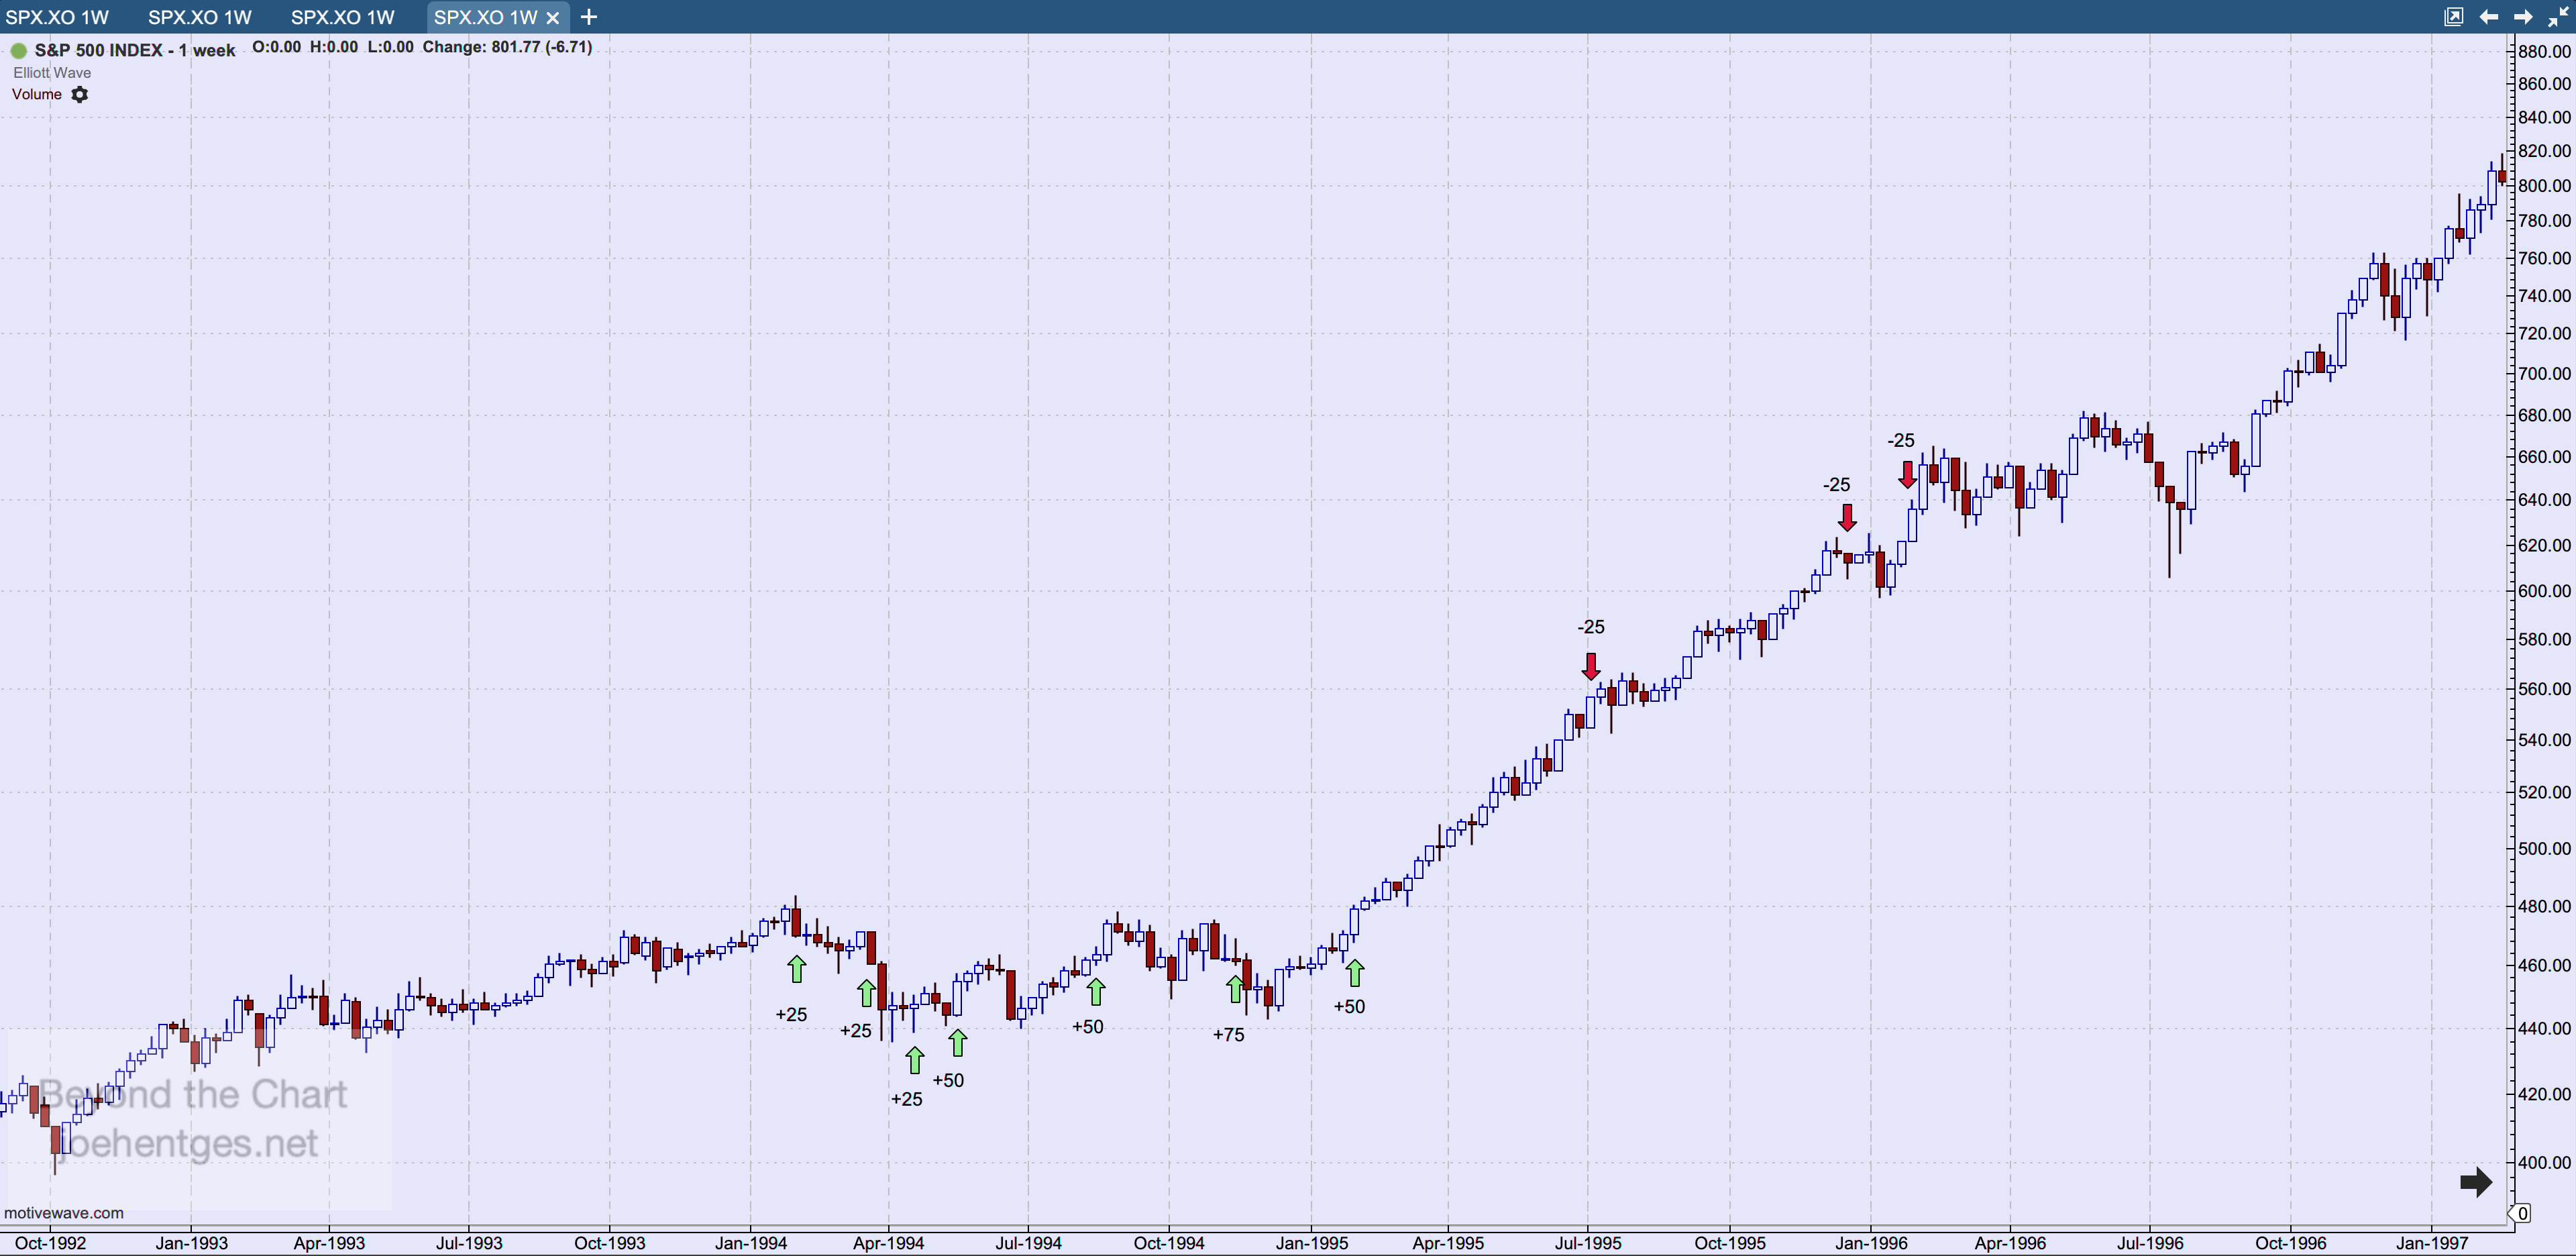
The first chart below shows the S&P 500 Index (SPX) from 1993 thru 1996. The Fed raised interest rates 7 times, starting with +.25% in February 1994 and ending with +0.50% February 1995. The SPX chopped sideways during this time and then began a steady rise in 1995. 

The Fed then cut interest rates in July 1995 by 0.25% followed by two more cuts in Deember 1995 and in January 1996. The SPX kept rising into May 1996, had a small pullback in July then took off again steadily rising.

1994-1996 Rate Cycle


2000 to 2003 

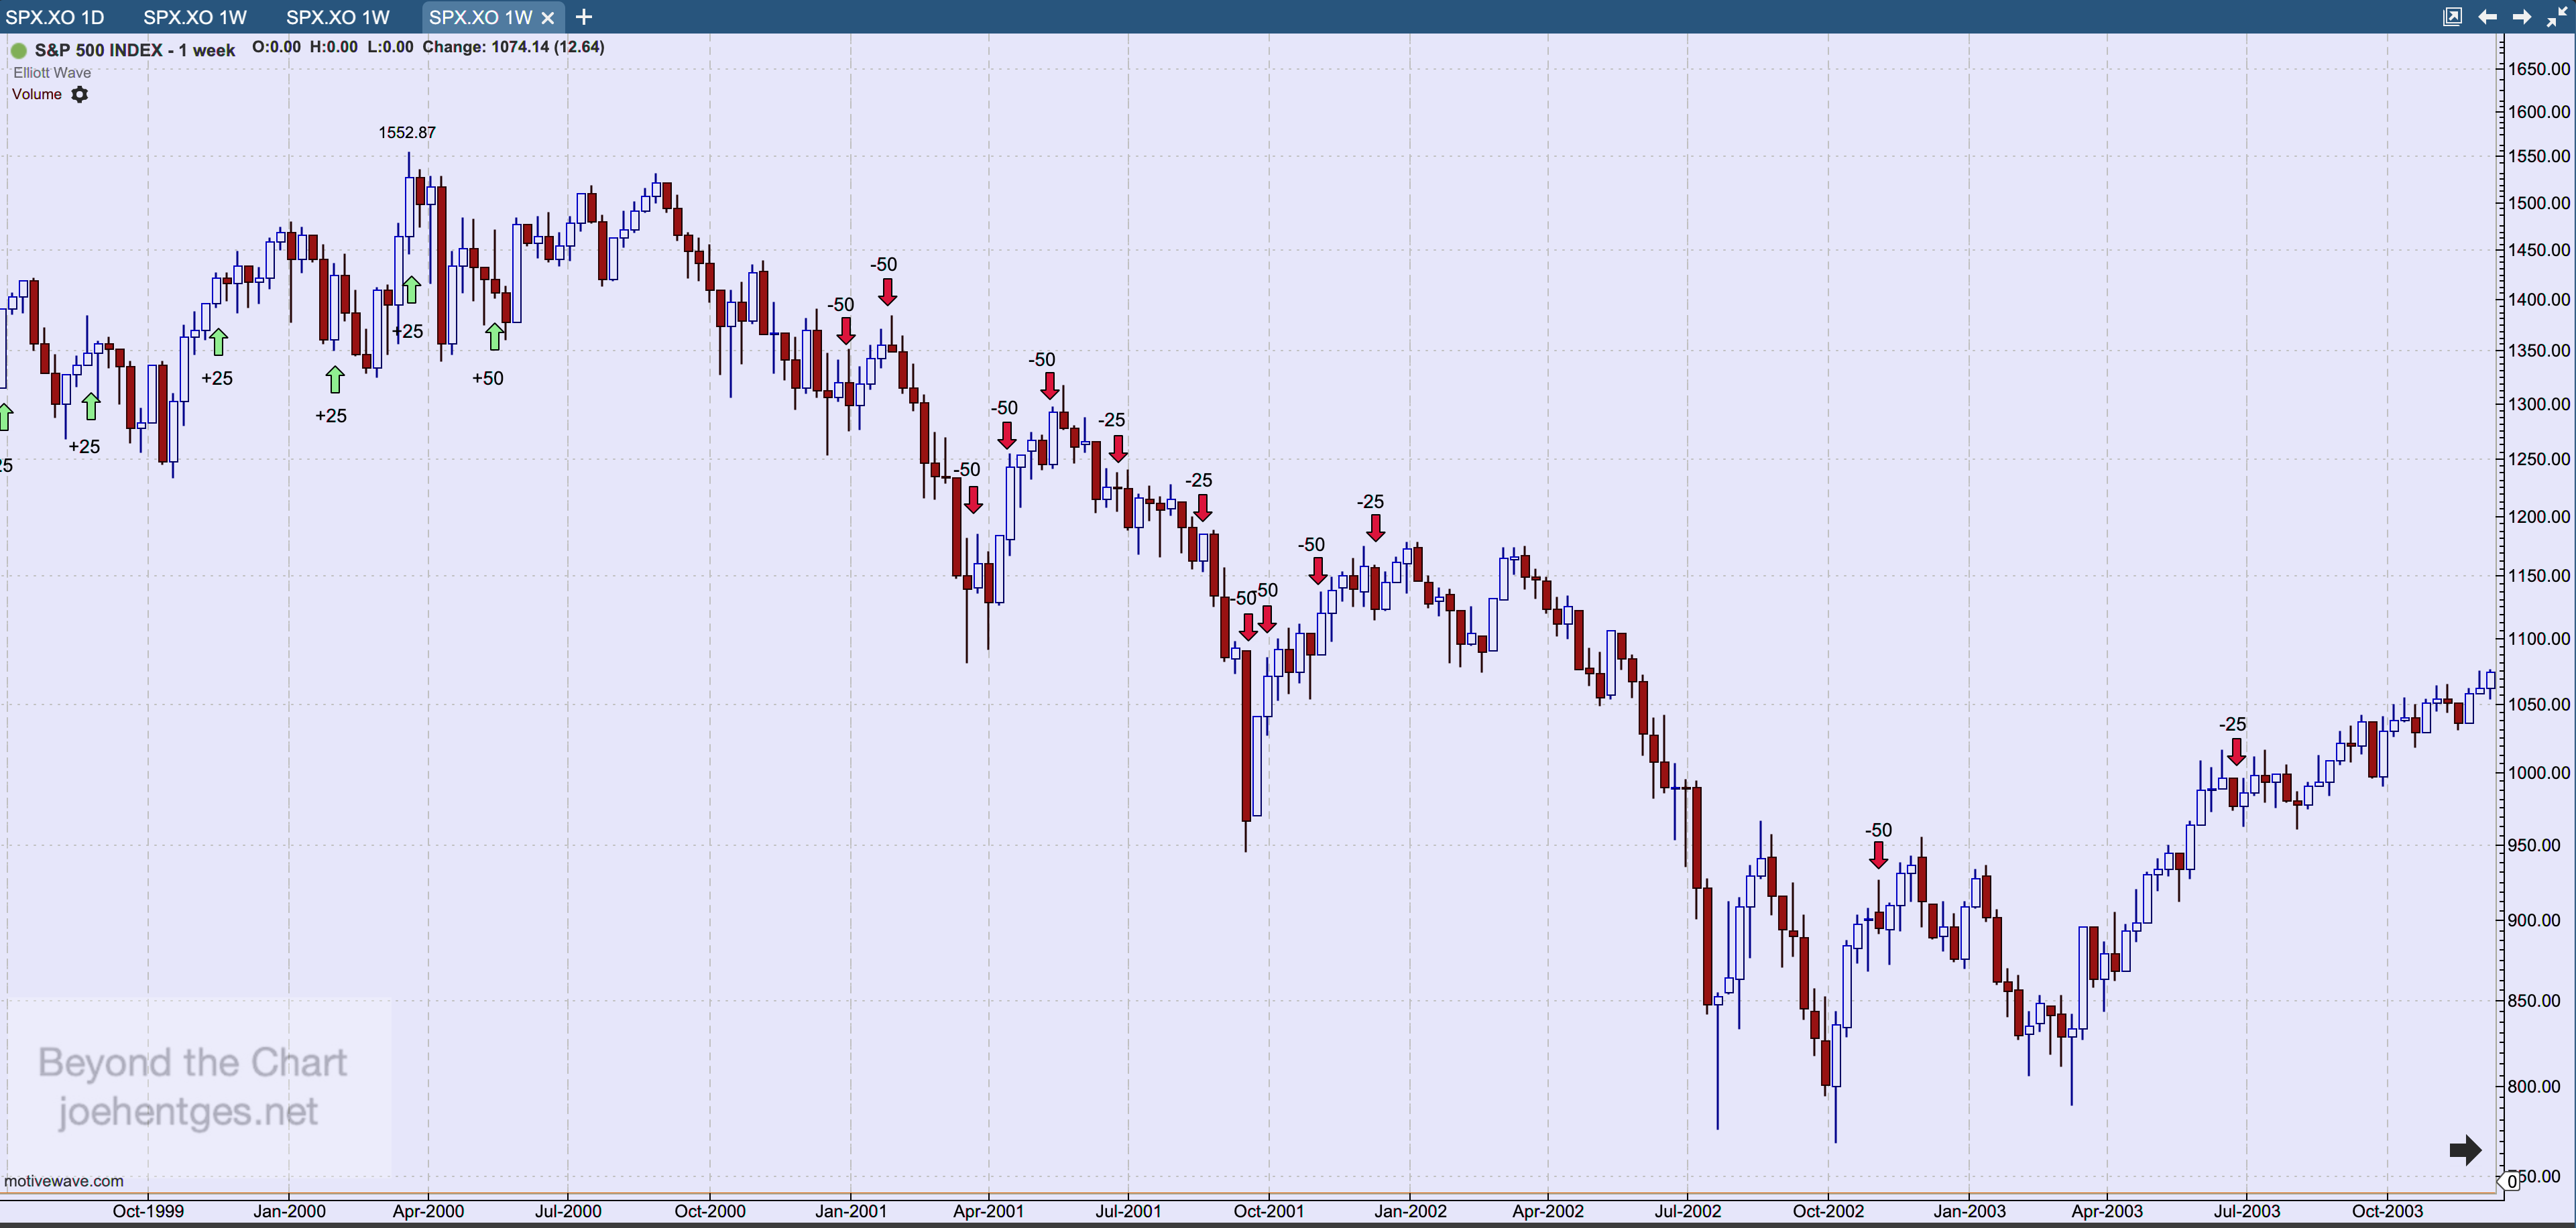
The next rate cut cycle began in December 2000 with a -0.50% cut. This occurred nine months after the SPX peaked in March 2000. The Fed then cut rates 12 more times, with the last cut occurring in June 2003. At that point they had cut interest rates by -5.50%. Notice that the SPX hit bottom in October 2002, about 9 months before the last rate cut.

2000 Rate Cut Cycle


2007 to 2008

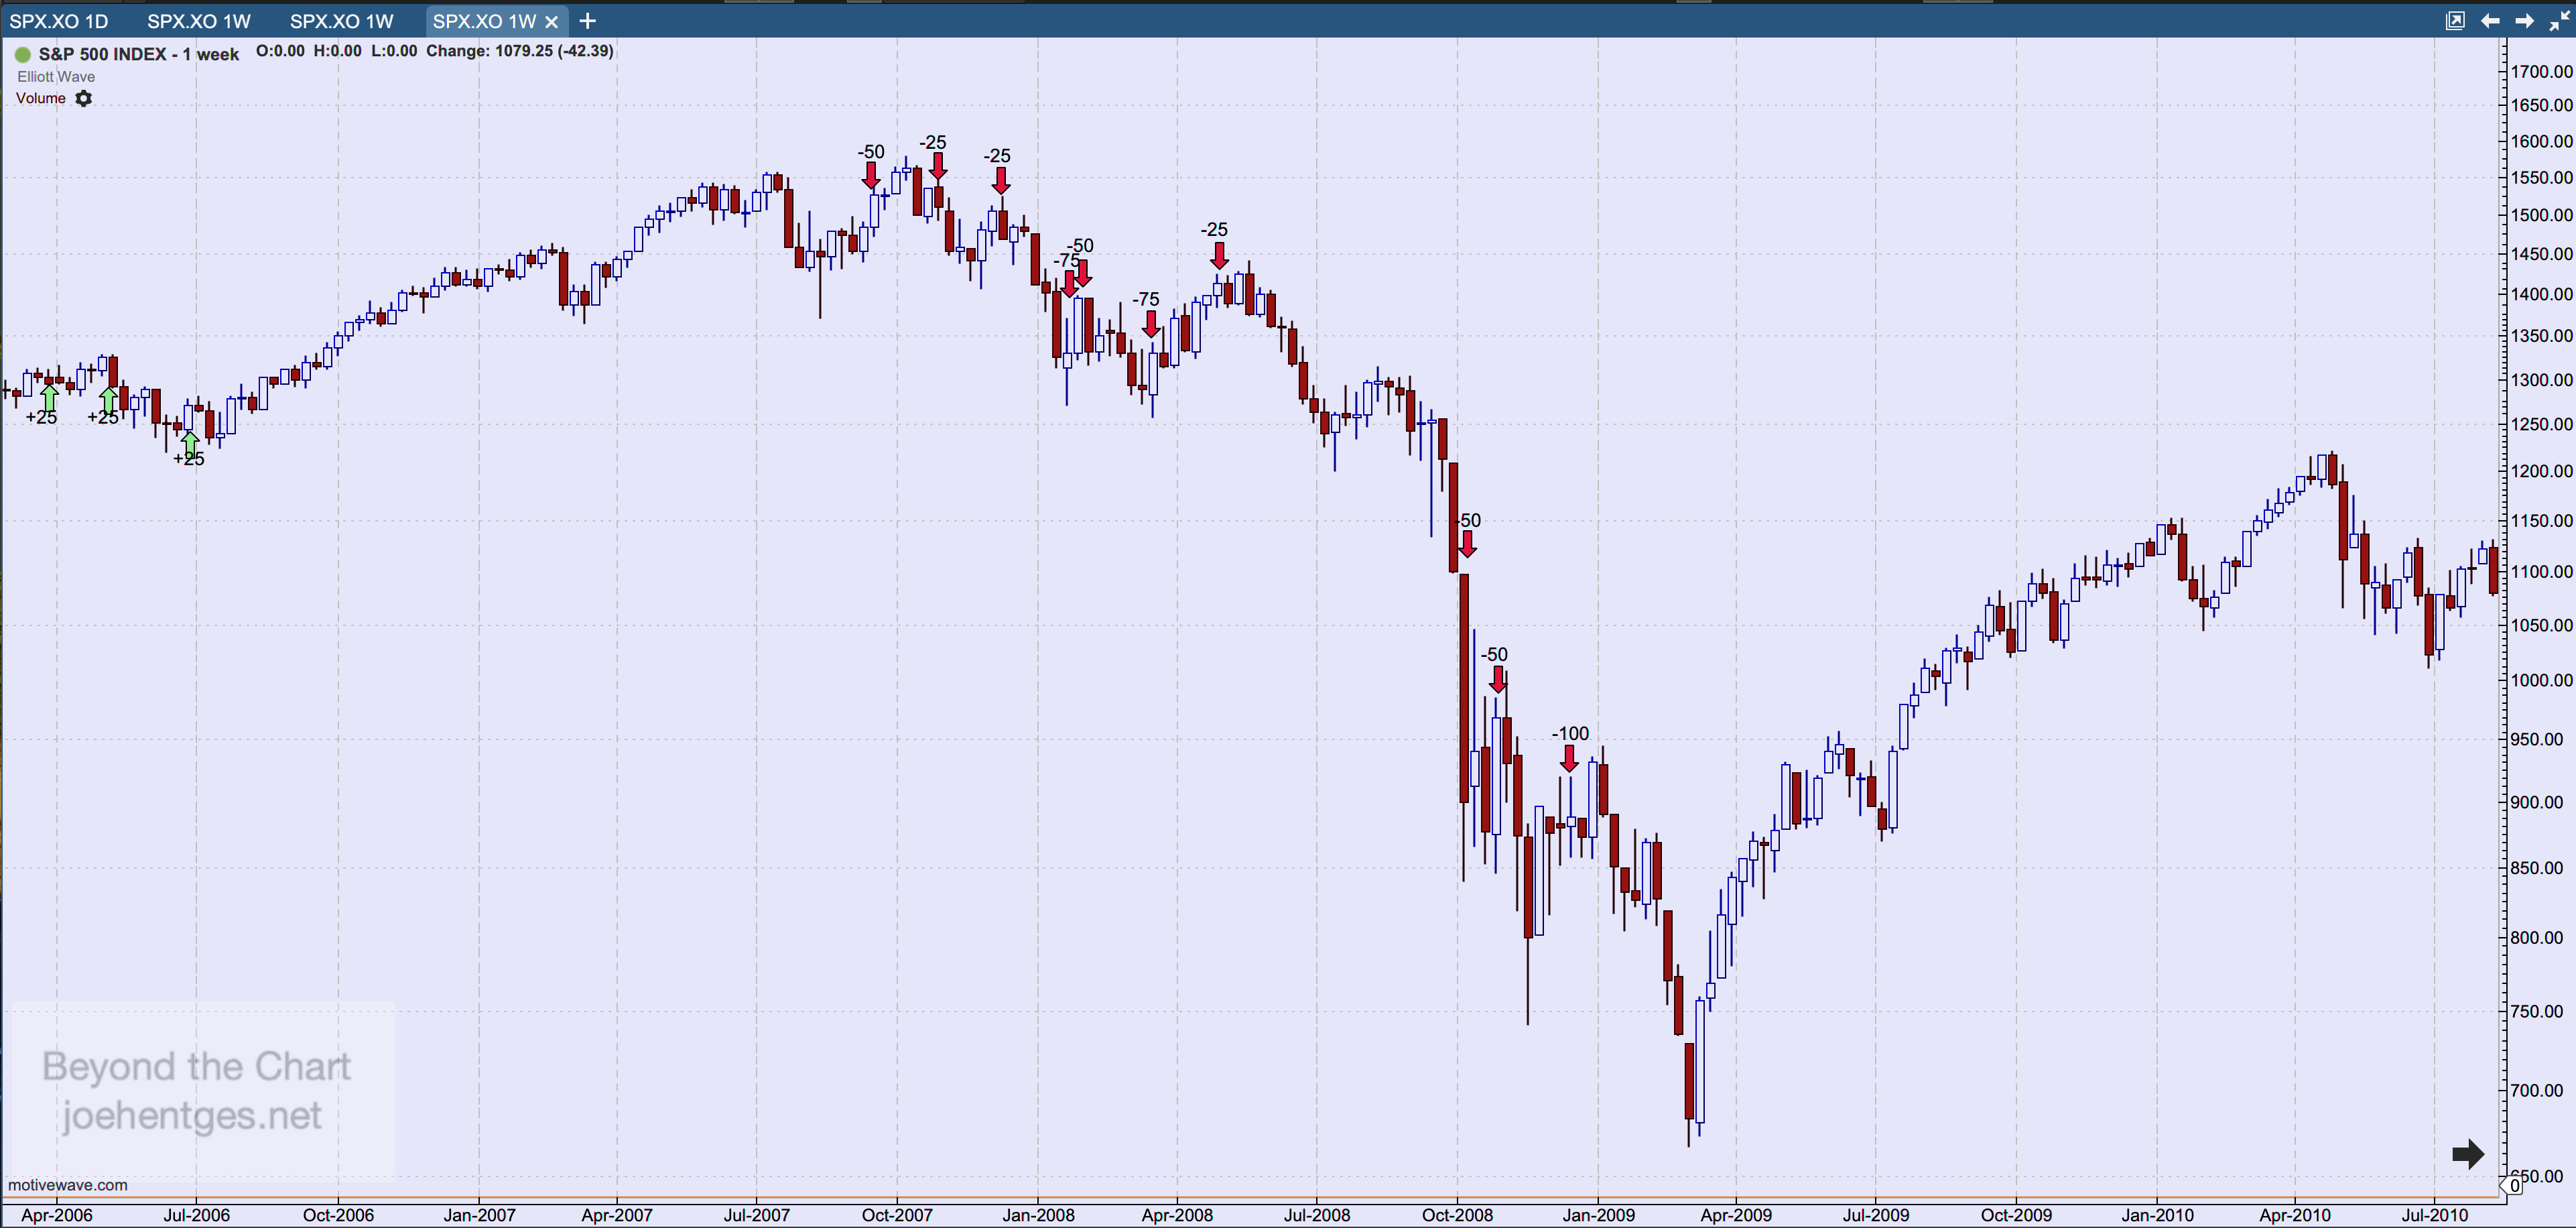
The next rate cut cycle began in September 2007 when the Fed cut rates -0.50%. The SPX peaked 3 weeks later. The Fed then cut rates 9 more times for a total of -5.50%. The last cut occurred in December 2008 and the SPX bottomed 3 months later in March 2009. 

2007-2008 Rate Cut Cycle


2019 to 2020

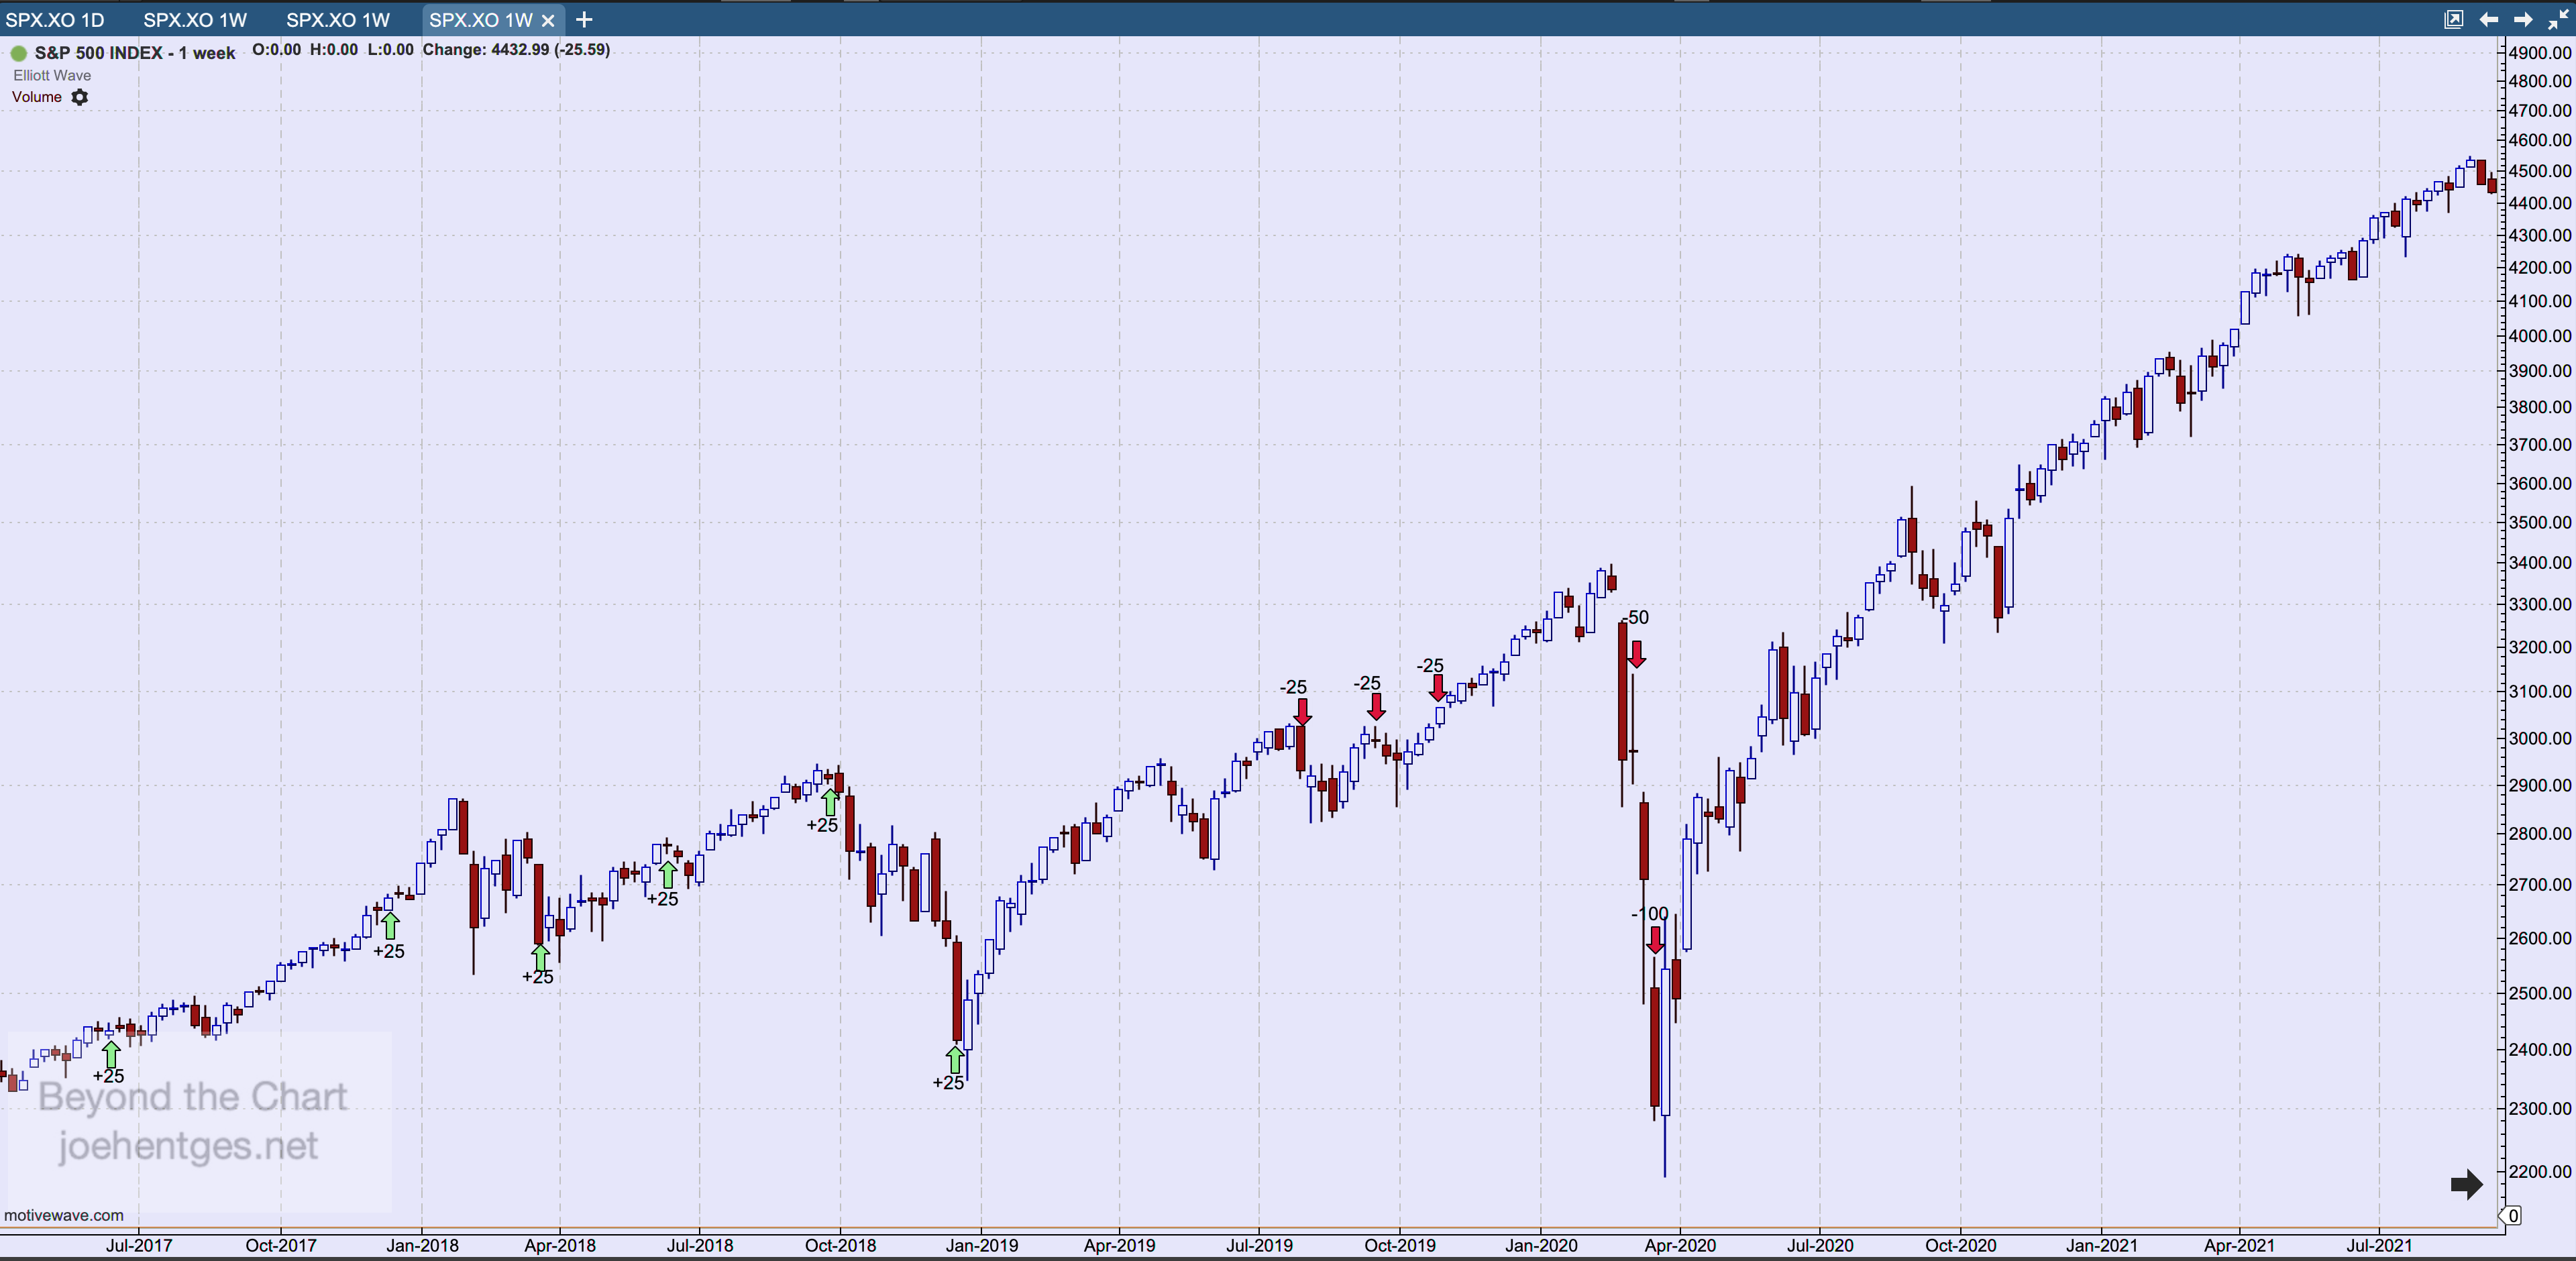
The next rate cut cycle began in July 2019 when the Fed cut rates -0.25%. They then cut rates 2 more times before the Covid panic in March 2000. In March 2020 the Fed cut rates -1.50% in a 3 week period. The SPX bottomed during the very next week. This set off a rapid rise in the stock market because not only did the Fed cut rates but they dramatically increased their balance sheet by buying everything in sight and thereby injecting a huge supply of money into the system.

2019-2020 Rate Cut Cycle


2024 to ......

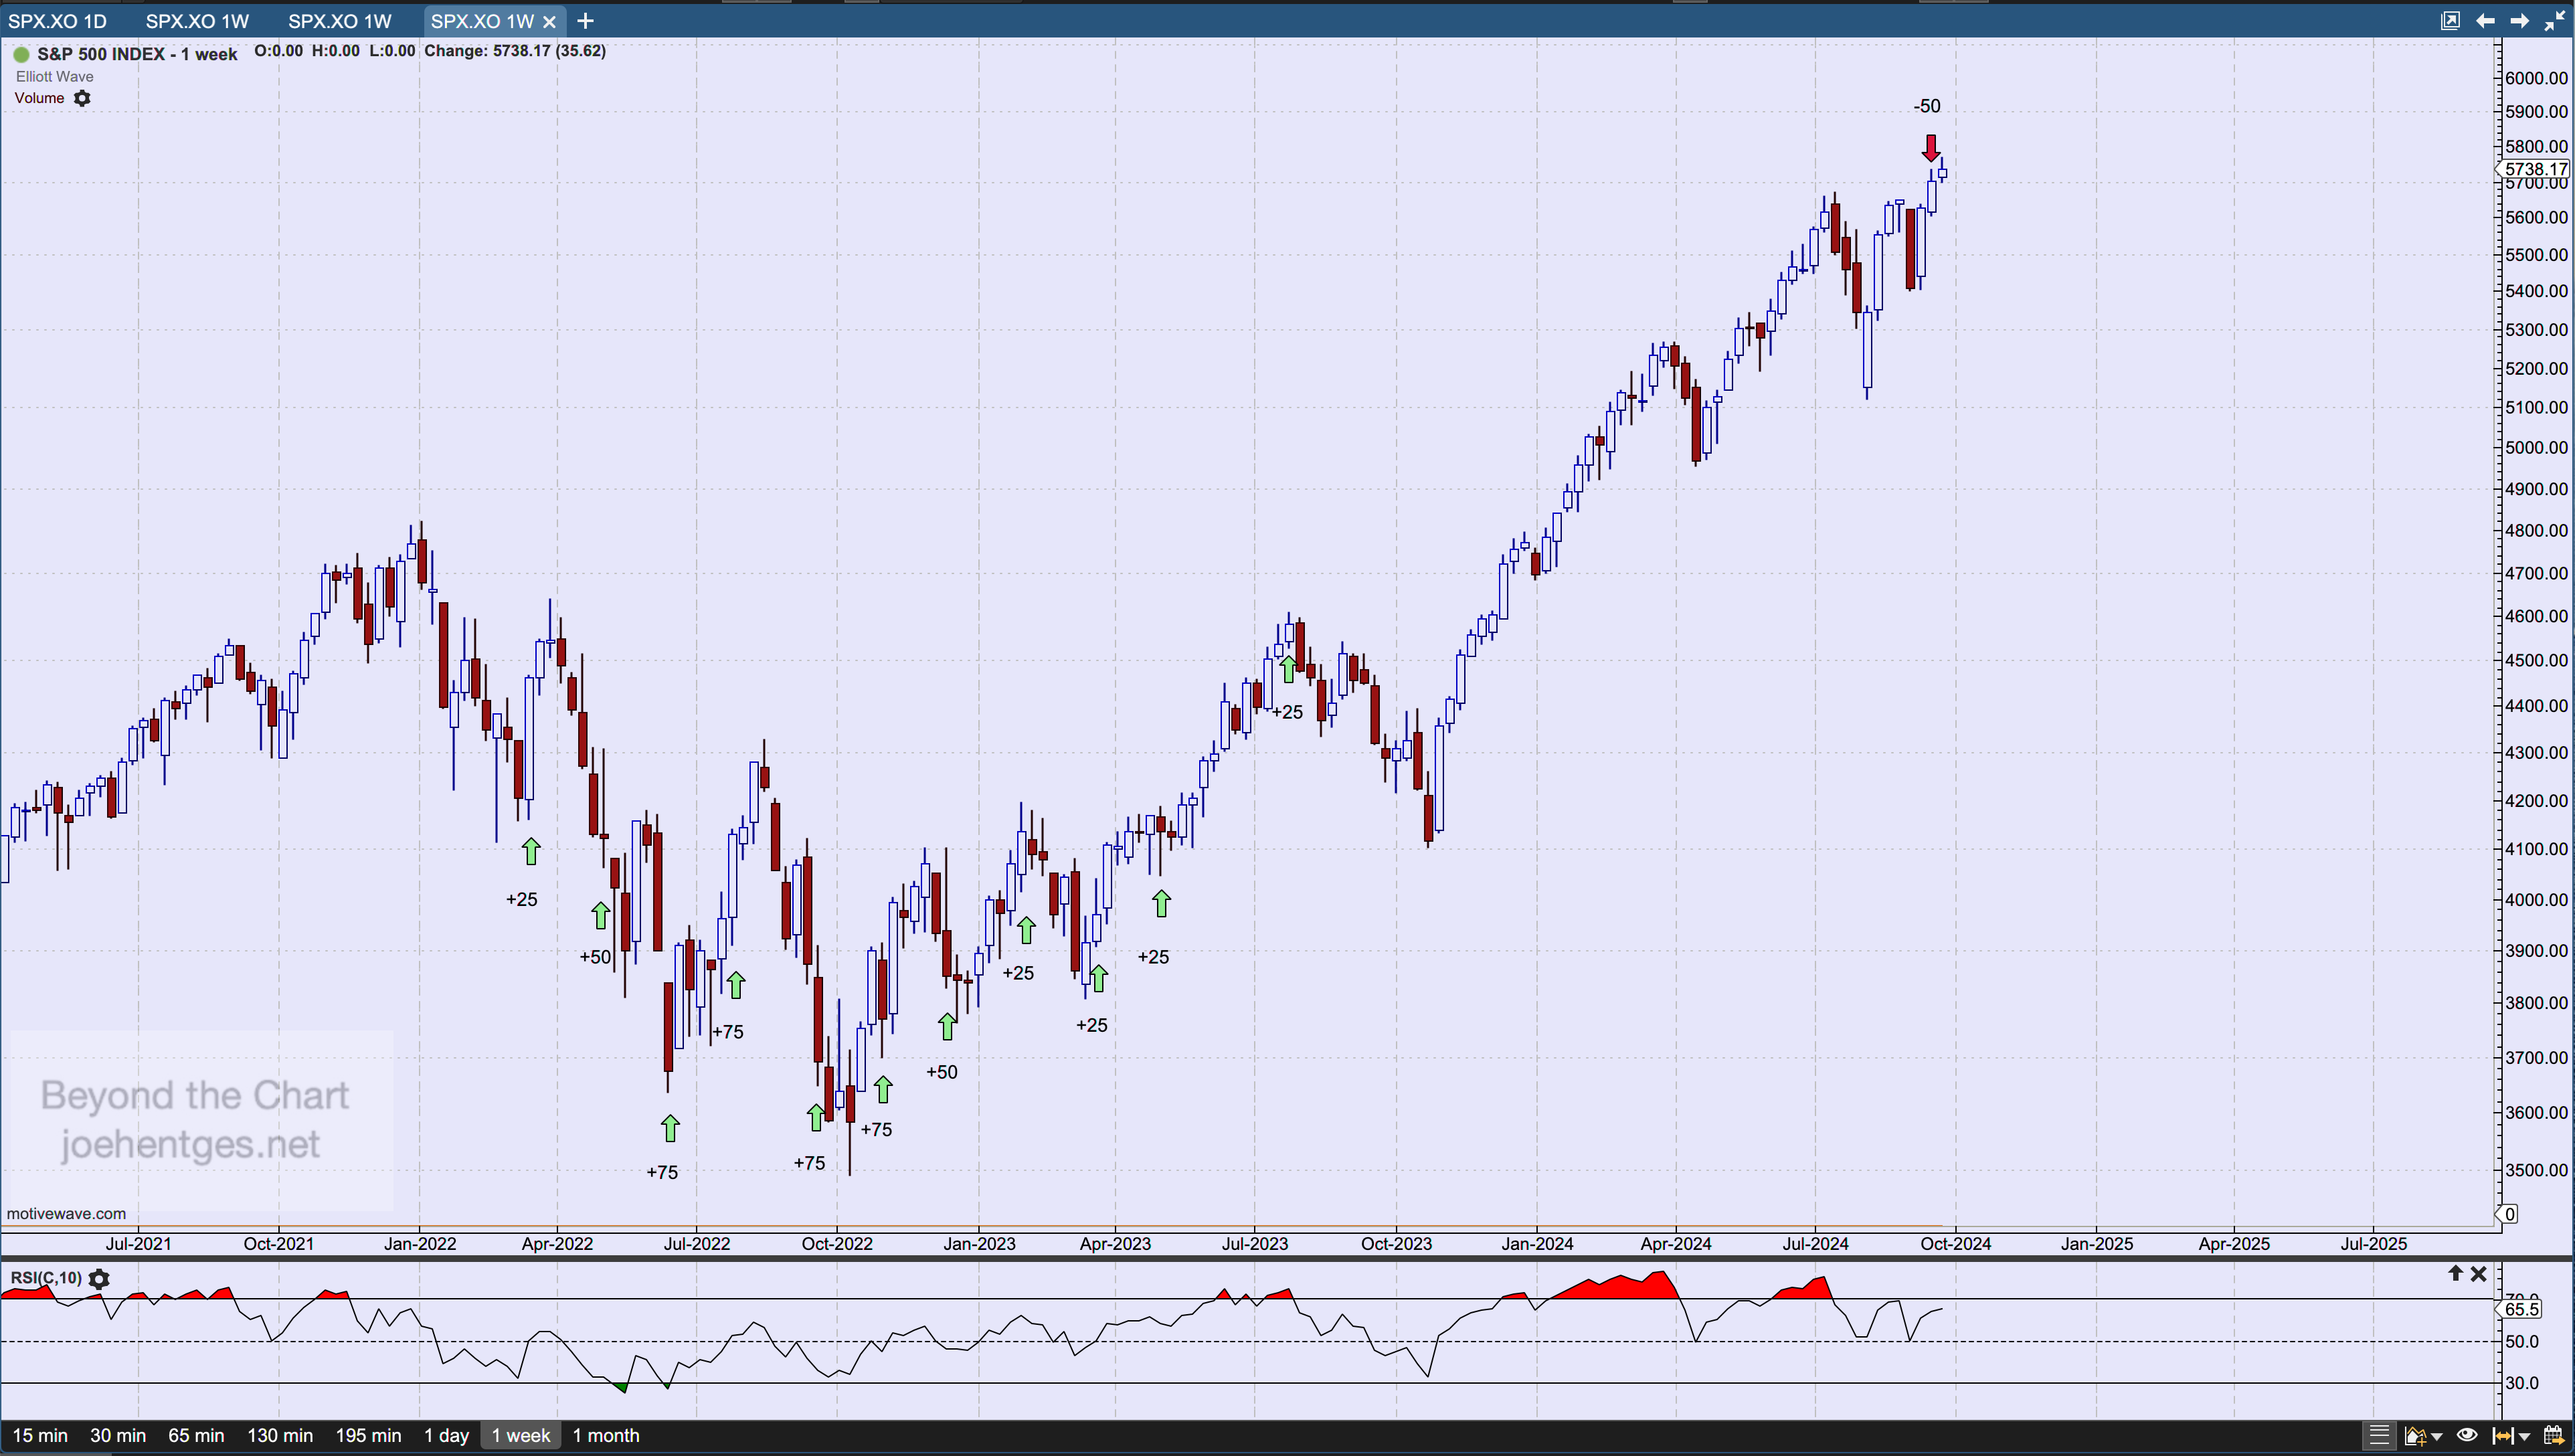
And now the Fed began another rate cut cycle with the -0.50% cut on September 18, 2024. So is the market about to peak like 2007 or is this more like the mid-90's. Over at Charles Schwab, Liz Ann Sanders and Kevin Gordon published an article back in August that looks back at the 14 Fed rate cycles since 1929. Interesting article that provides additional insight. You can read it here

2024 Rate Cut Cycle

The Decade Cycle

The stock market shows some interesting tendencies when it comes to its path throughout a decade. In this post I will review what occurred in the Decade Cycle over the last 100 years. Then I'll apply those tendencies to the current decade to see what may be underway.  Keep in mind this is just one cycle of many cycles influencing the stock market but it's amazing how well it repeats.

First let me say that I start the count for the decade cycle with year 1.  So even though we say 1930 is in the thirties, I count it as year 10 of the 1920s cycle since we don't count to 10 by starting with zero, we count 1, 2, 3....10.

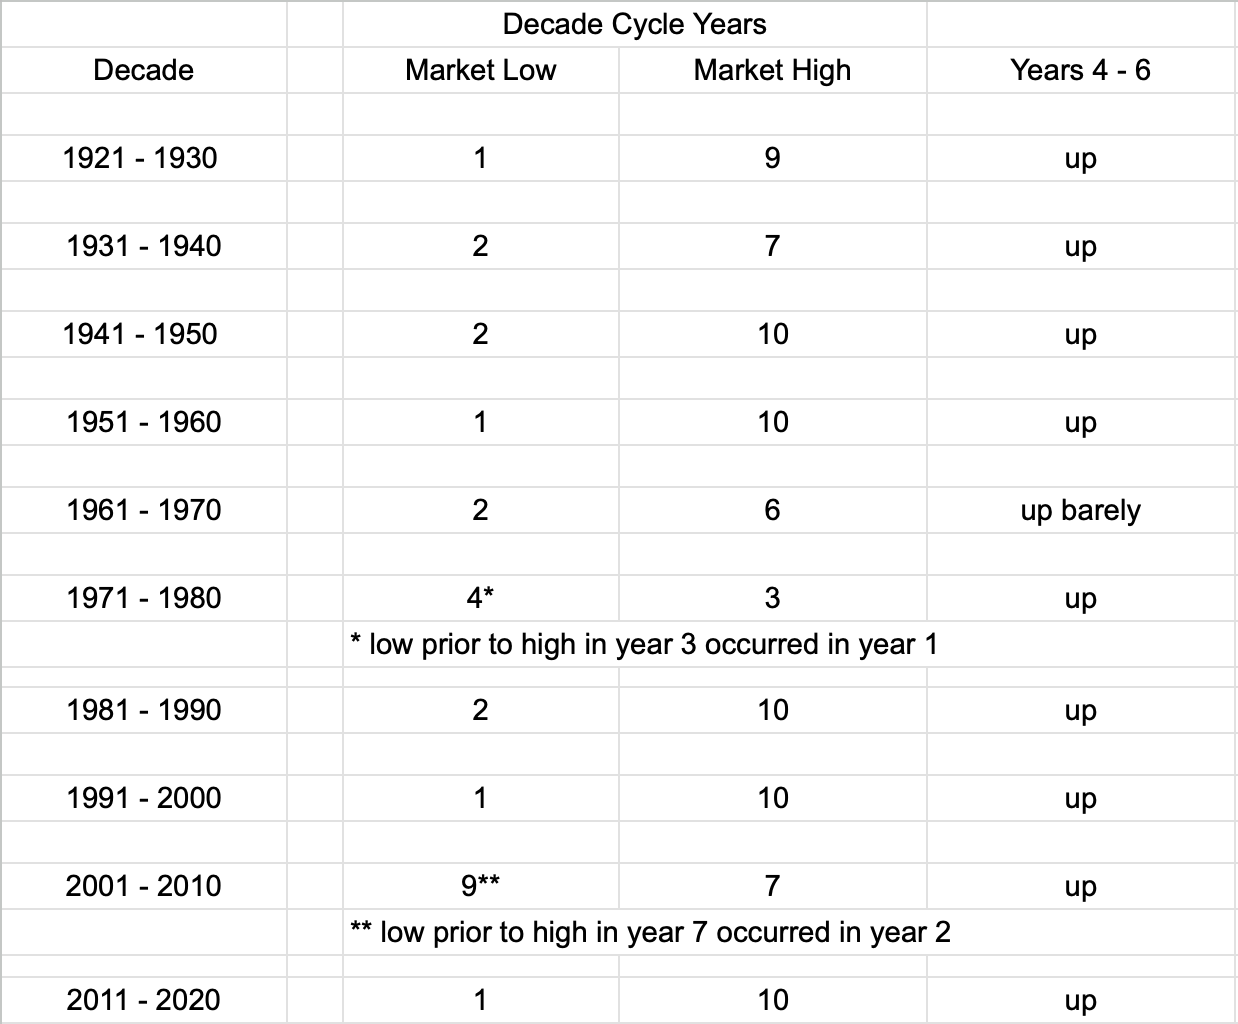
So I looked at 10 decades starting with 1921 - 1930 using data from the Dow Jones Industrial Average (DJIA).  See the table below.  


Early Decade Low

The first fact that leaps off the table is that eight of the ten years showed the low for the decade in either year 1 or year 2.  But let's take a look at the two decades that didn't show this. 

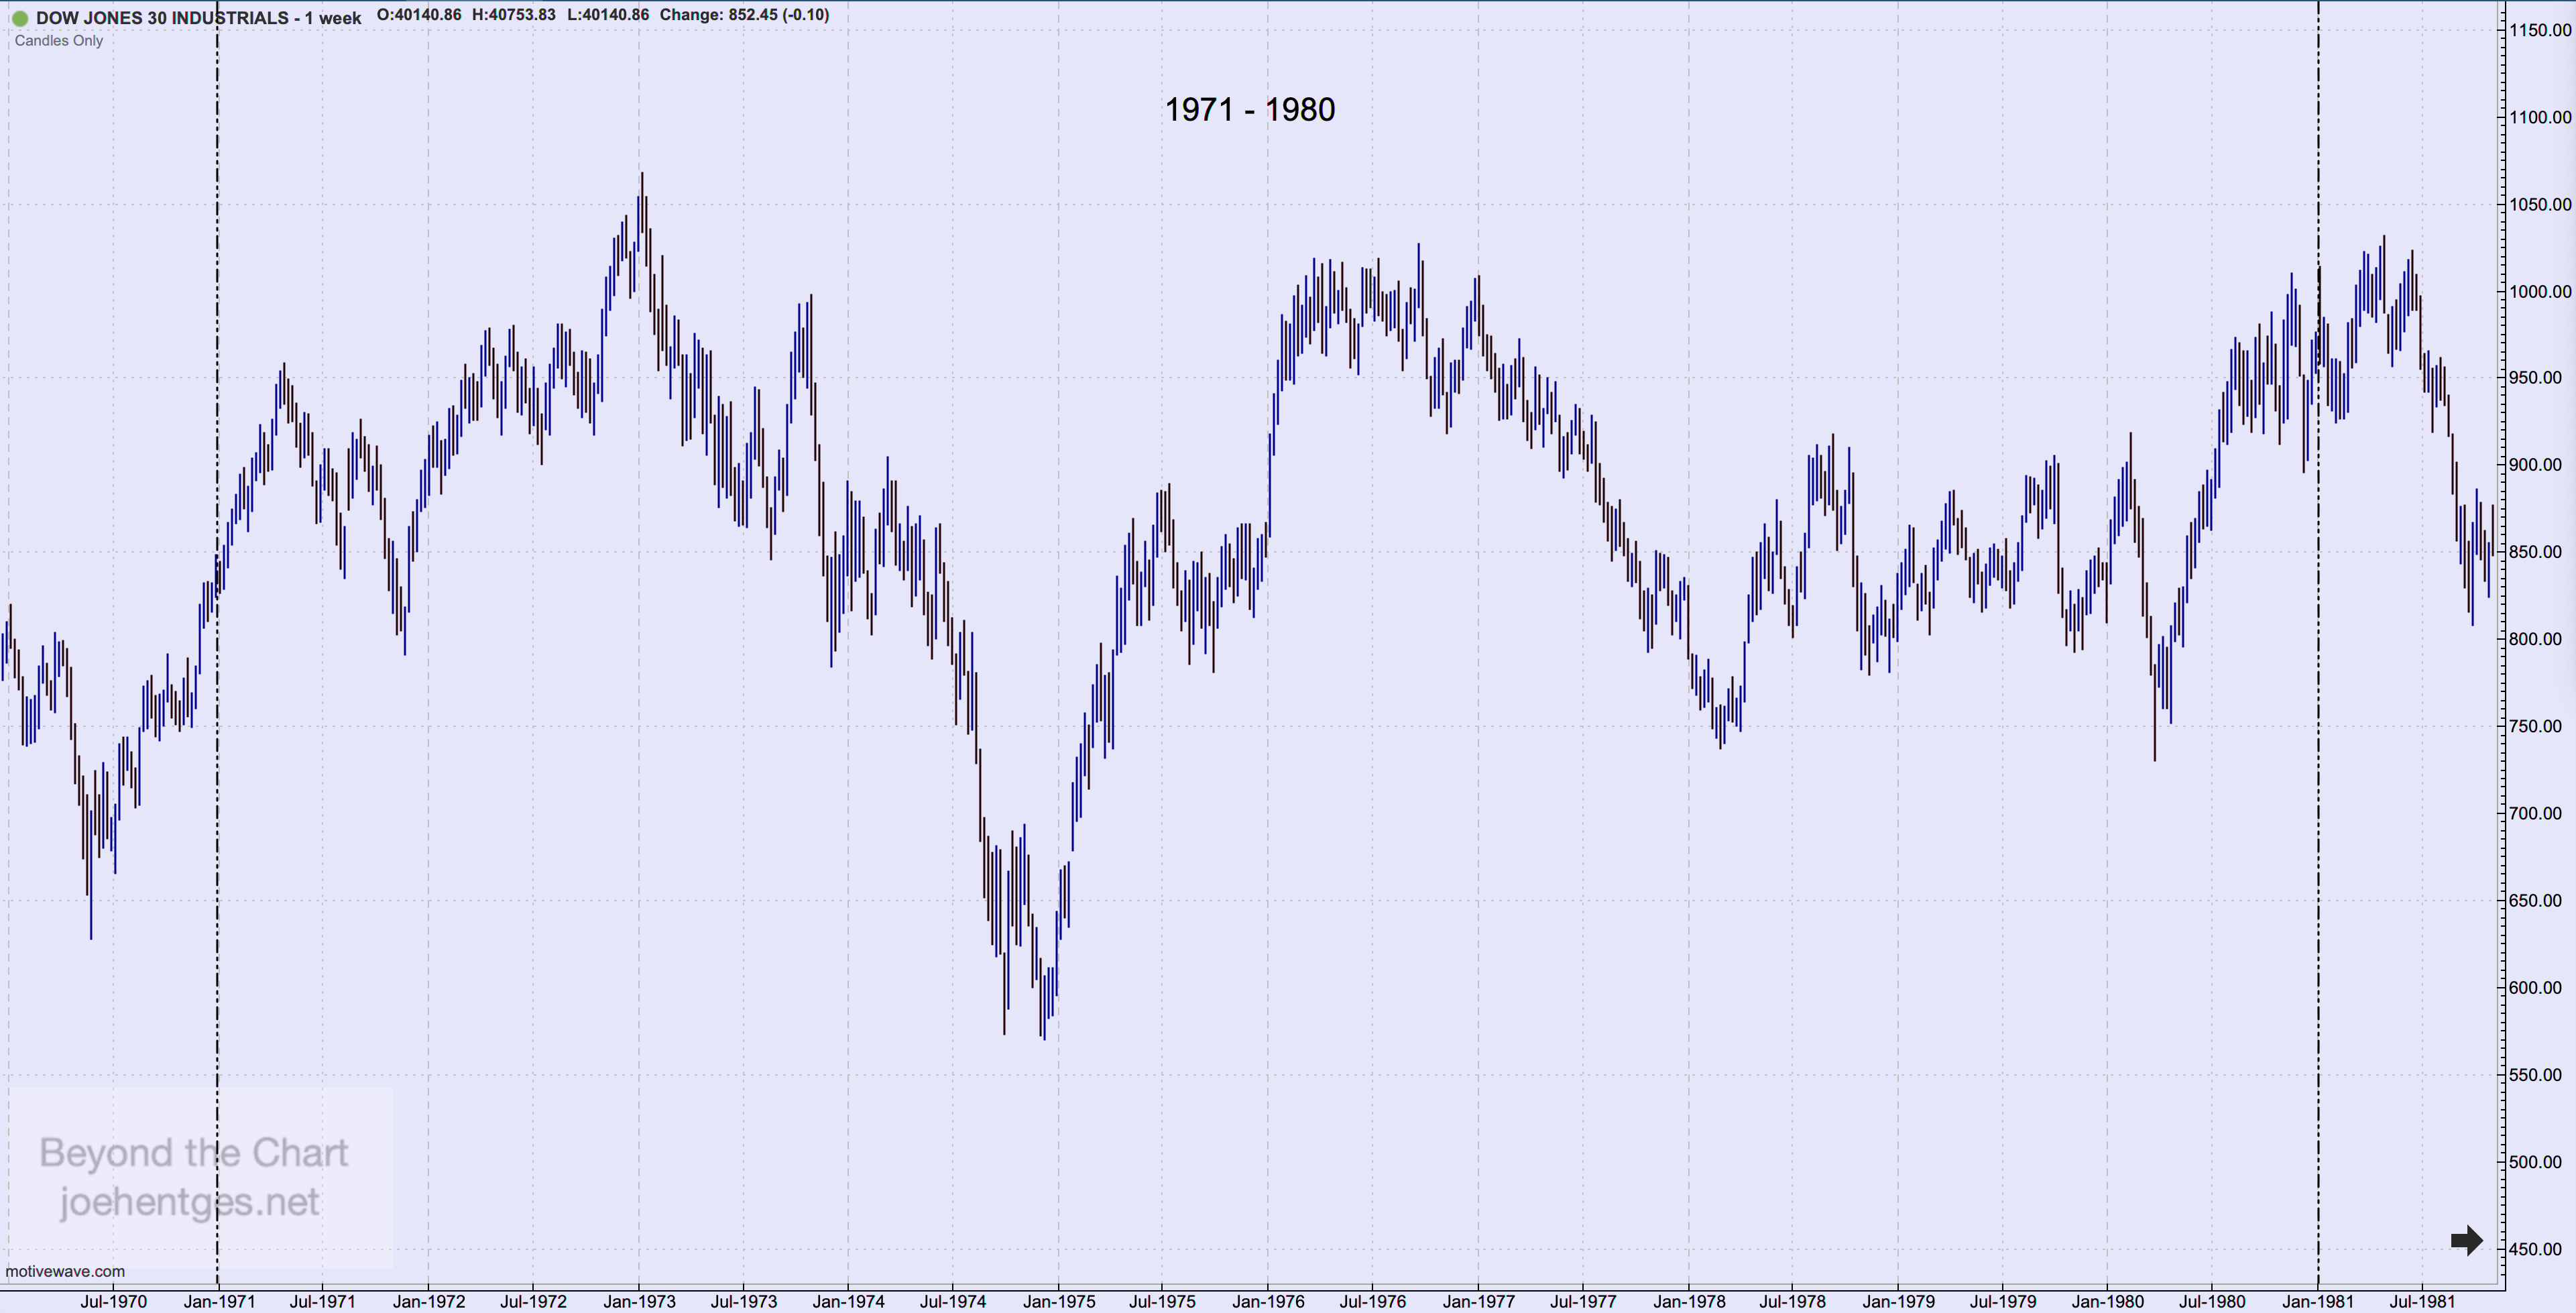
1971 - 1980 had a low for the decade in year 4 BUT when we look closer you see that the low occurring prior to the high for the decade, happened in year 1.  


And the 2001 - 2010 decade had a low of the decade in year 9, BUT the low prior to the decade high occurred in year 2.  So the Decade Cycle indicates that our low made in 2022 has an 80% chance of being the low for the decade and a 100% chance of being the low prior to the high of this decade.


2nd Half Highs

The next fact that arises is that the the high for the decade occurs in years 7 - 10 in eight of the ten decades.  See the second column in the table.  And if we add in the high in year 6 for the 1961 - 1970 decade, then we can say that nine out of ten decades had their high in the 2nd half of the decade in years 6 - 10.  

The 1971 - 1980 decade had a high in year 3 and was extremely volatile.  It did have highs in year 6 and year 10 that came close to the year 3 high but the 1973 high remained the high for the decade.

So the Decade Cycle indicates that there is a 90% chance that the high for 2021 -2030 will occur sometime in 2026 - 2030.

Up in the Middle

The third fact that jumps out at you is the column titled Years 4 - 6.  This is the middle of the decade and we are in year 4 right now.  All ten decades were positive for these 3 years.  So there's a high probability that on December 31, 2026 the DJIA will close higher than 37,689.54 which is where it closed on the last trading day of 2023.

Election Year in Year 4

We are in year 4 of the Decade Cycle and it's an election year.  Five prior decades in the last 100 years had presidential elections in year 4. All of the highs for those decade cycles occurred in years 6 - 10. Those were the 1920s, 1940s, 1960s, 1980s and 2001 - 2010.

So based on 10 decades of data covering huge rallies, crashes, depressions, recessions, war and generations of stock market participants there is a high probability that the low for this decade has been seen and the high is still to come.  One thing you can be sure of...there will be plenty of volatility.

AI Exhaustion

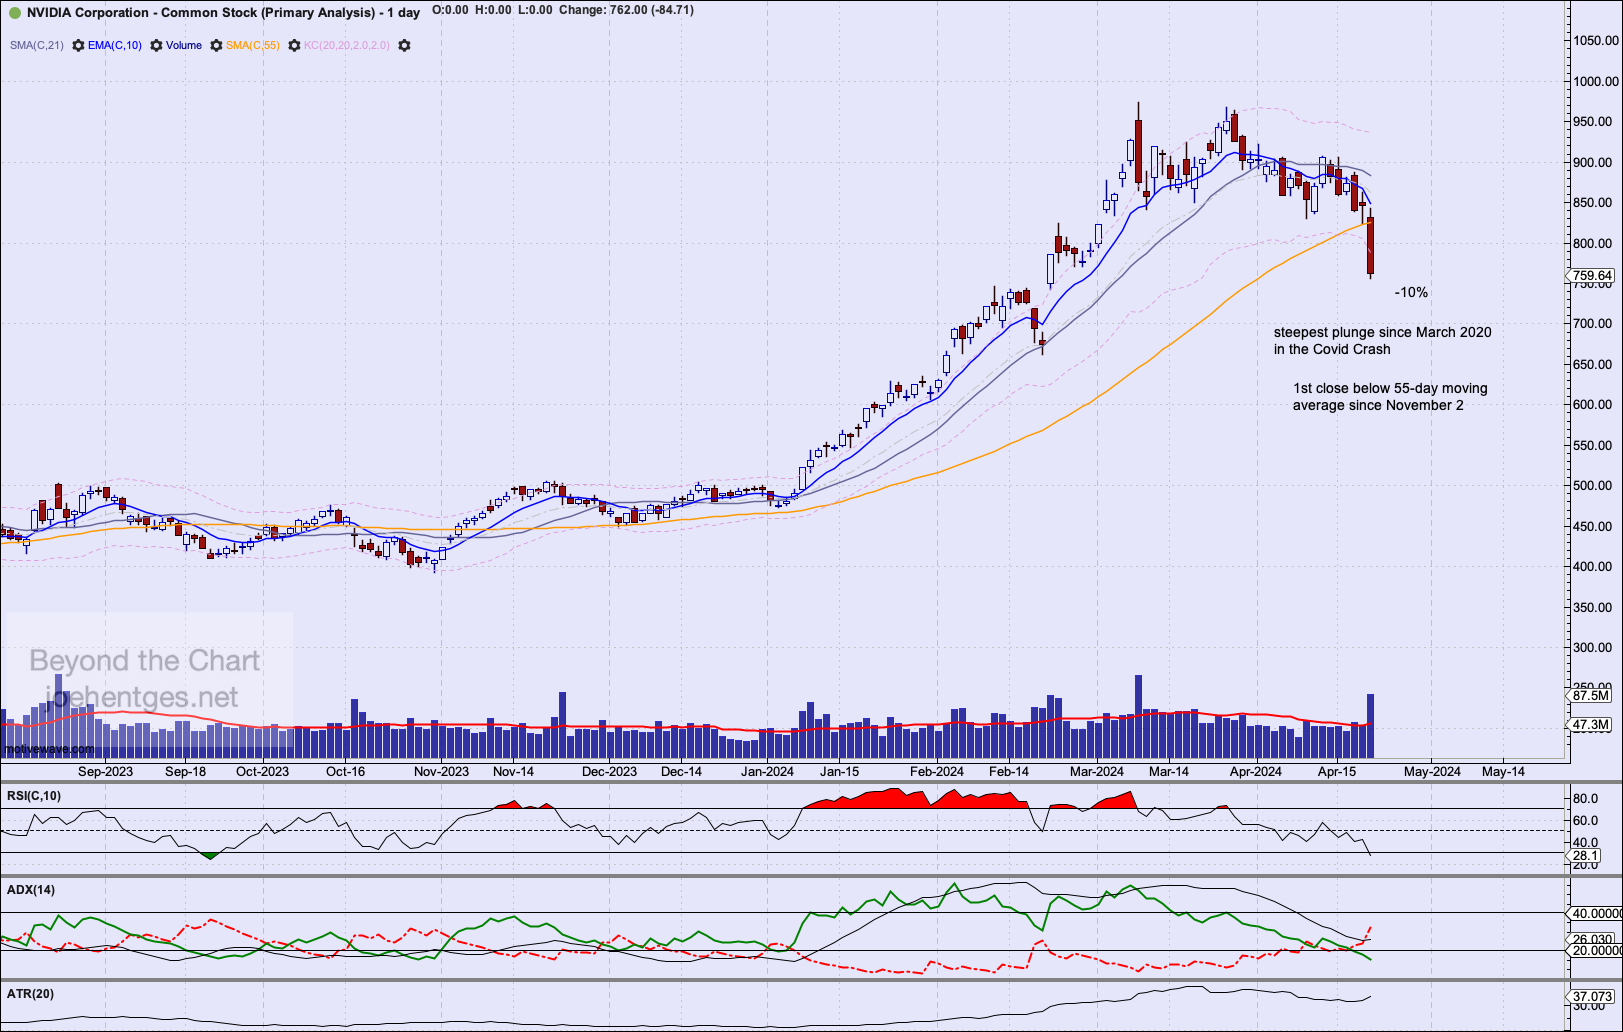
Nvidia has reached that point where it is time for a rest. Last week the stock took a pretty big hit, dropping 13.6%. It was down 10% on Friday alone. (see chart below).

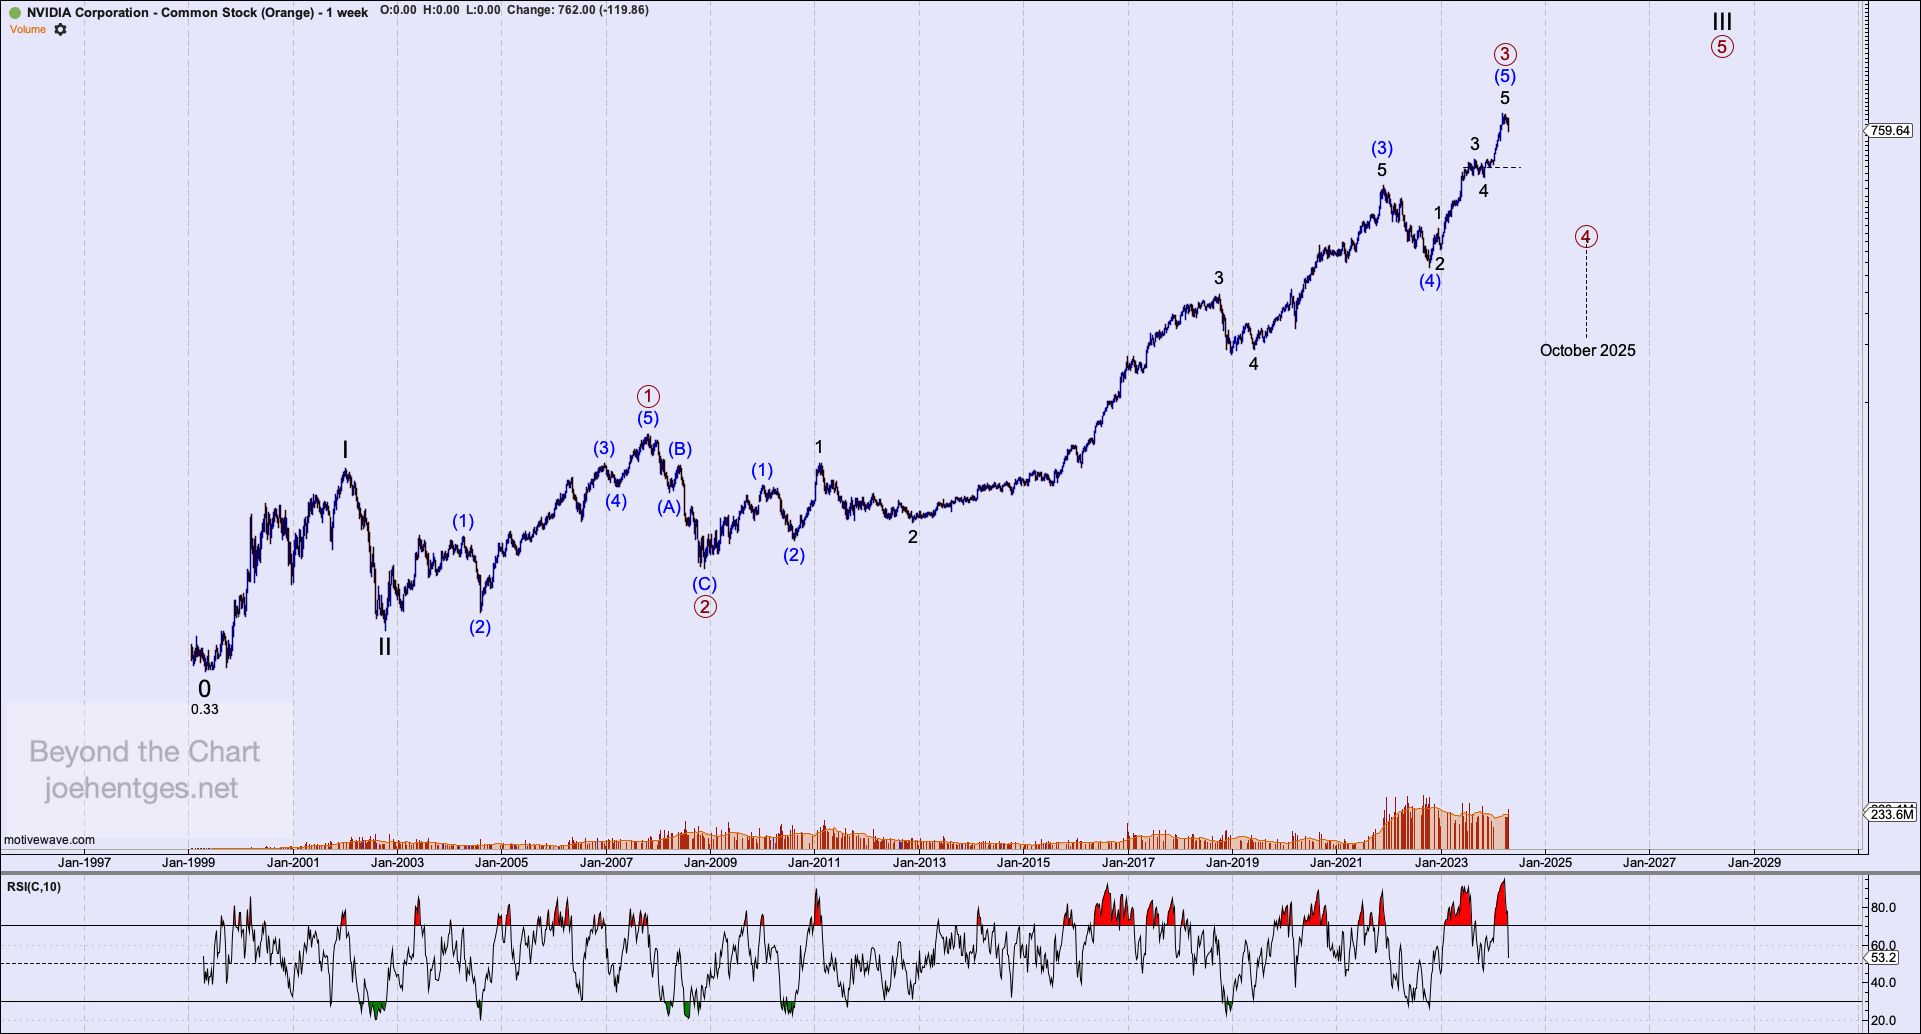
When we view the price action from an Elliott Wave perspective, a 15 year Primary Wave 3 (circled) is complete. Intermediate Wave (5) from October 2022 topped out on March 25, 2024 after a beautiful 5 wave move. (see chart below).

Now I expect NVDA to go thru a corrective phase that will take until about October 2025 to complete.  That corrective move should pull the price down into the 108 – 345 zone based on Intermediate Wave (4).  What we don’t know is what shape the corrective pattern will take. 

Primary Wave 2 (circled) was a sharp pull back so I expect Primary 4 to be a sideways type of move that could have quite a bit of volatility to it. It could take the shape of a Flat, a Triangle or a combination of corrective patterns.  

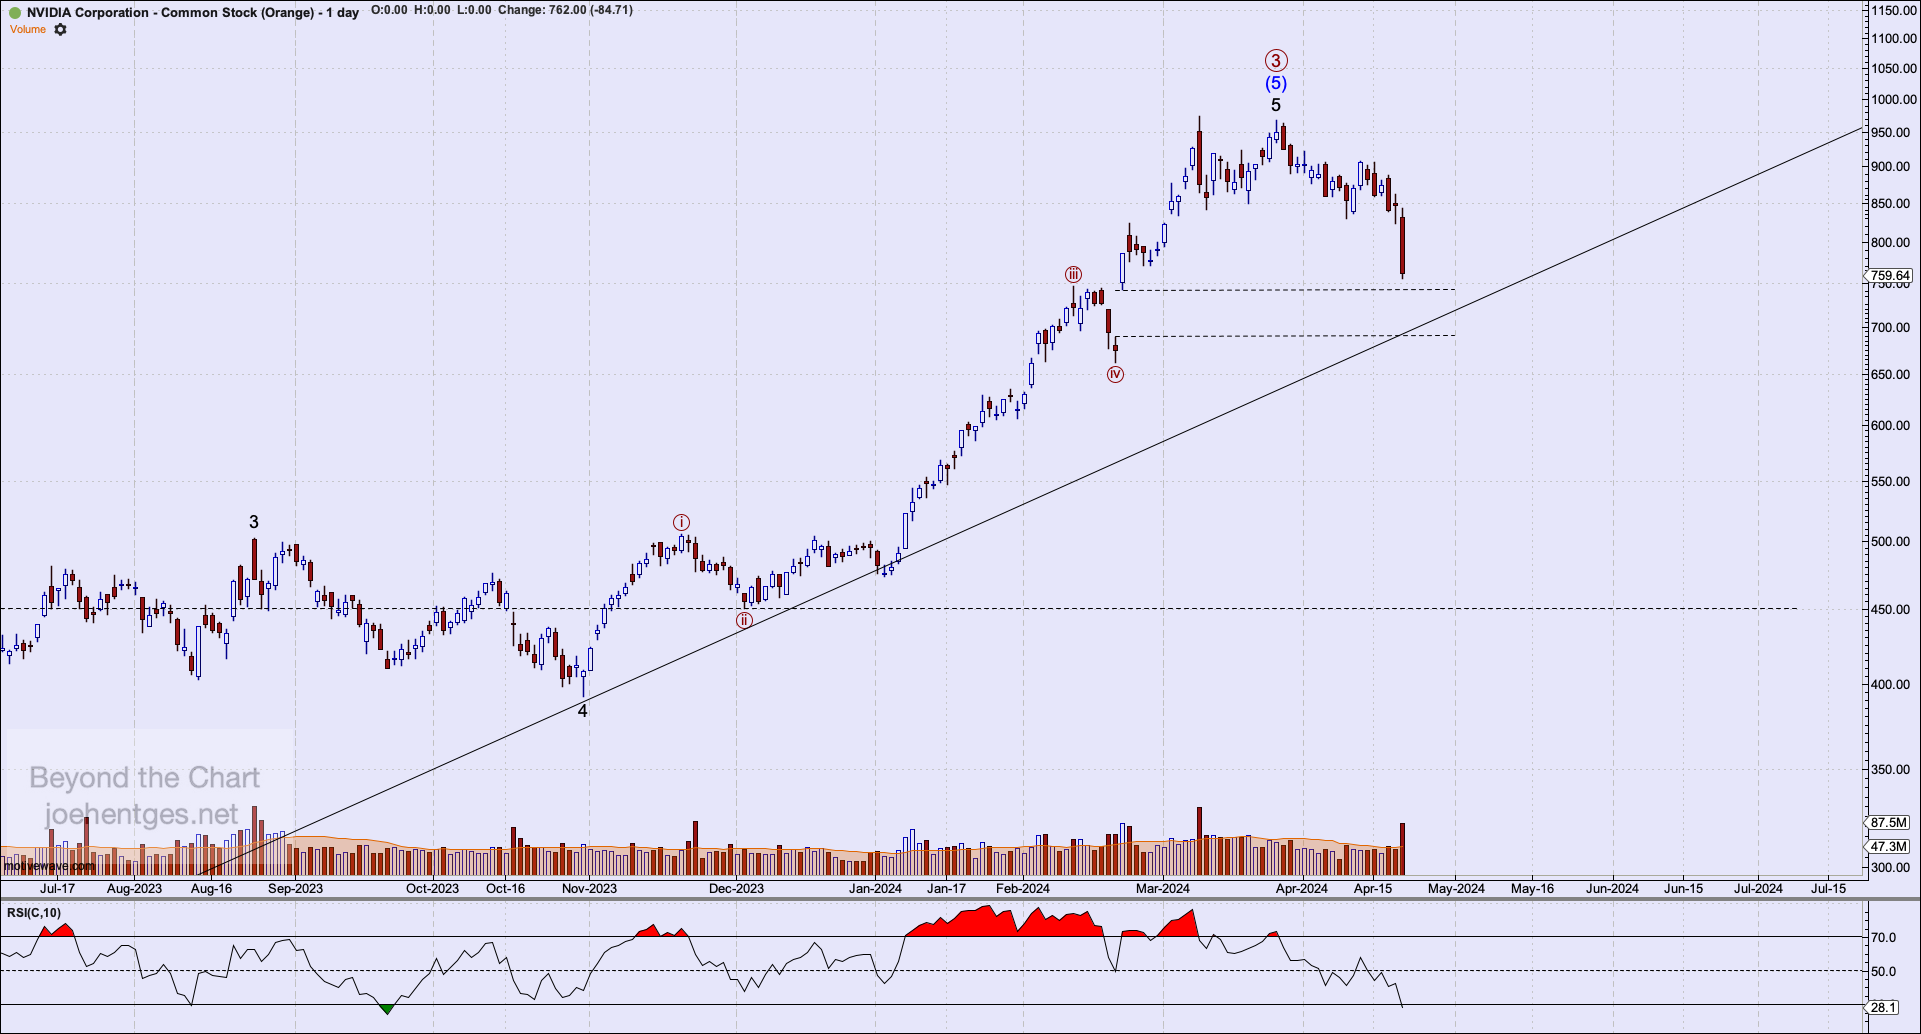
When we drill down to review the daily picture (see below), we see Friday’s close was just above a gap, that when closed, will bring the price to a trend line supporting the entire Intermediate Wave (5). Once this is broken the next level of key support will be around 450.  It is going to be an interesting next couple of years.

Fasten Your Seatbelts

There's a confluence of cycles occurring in the economy/stock market.  The Fourth Turning,  Elliott Wave SuperCycle,  18.6-year economic cycle and several others.  I've discussed the Fourth Turning before. Neil Howe, the co-author of "The Fourth Turning, An American Prophecy", pub. 1997 and "The Fourth Turning is Here" pub. 2023, believes we are in the midst of the Fourth Turning which began in 2008 and will end  in the early 2030's possibly 2033. 

Of course I've also discussed the long-term Elliott Wave cycles.  Cycle Wave V of SuperCycle (III) either ended in January 2022 or is in the final stages.  The price action will soon confirm the timing. I've recently been introduced to the 18.6-year economic cycle related to real estate and the economy that is impacting the Elliott Waves.  It has very significant implications for the stock market and the economy and ties in nicely with everything occurring now. 

As a member of the Foundation for the Study of Cycles I became aware of Akhil Patel and also Phil Anderson who has extensively studied the 18.6-year economic cycle. Here is what I've learned: 

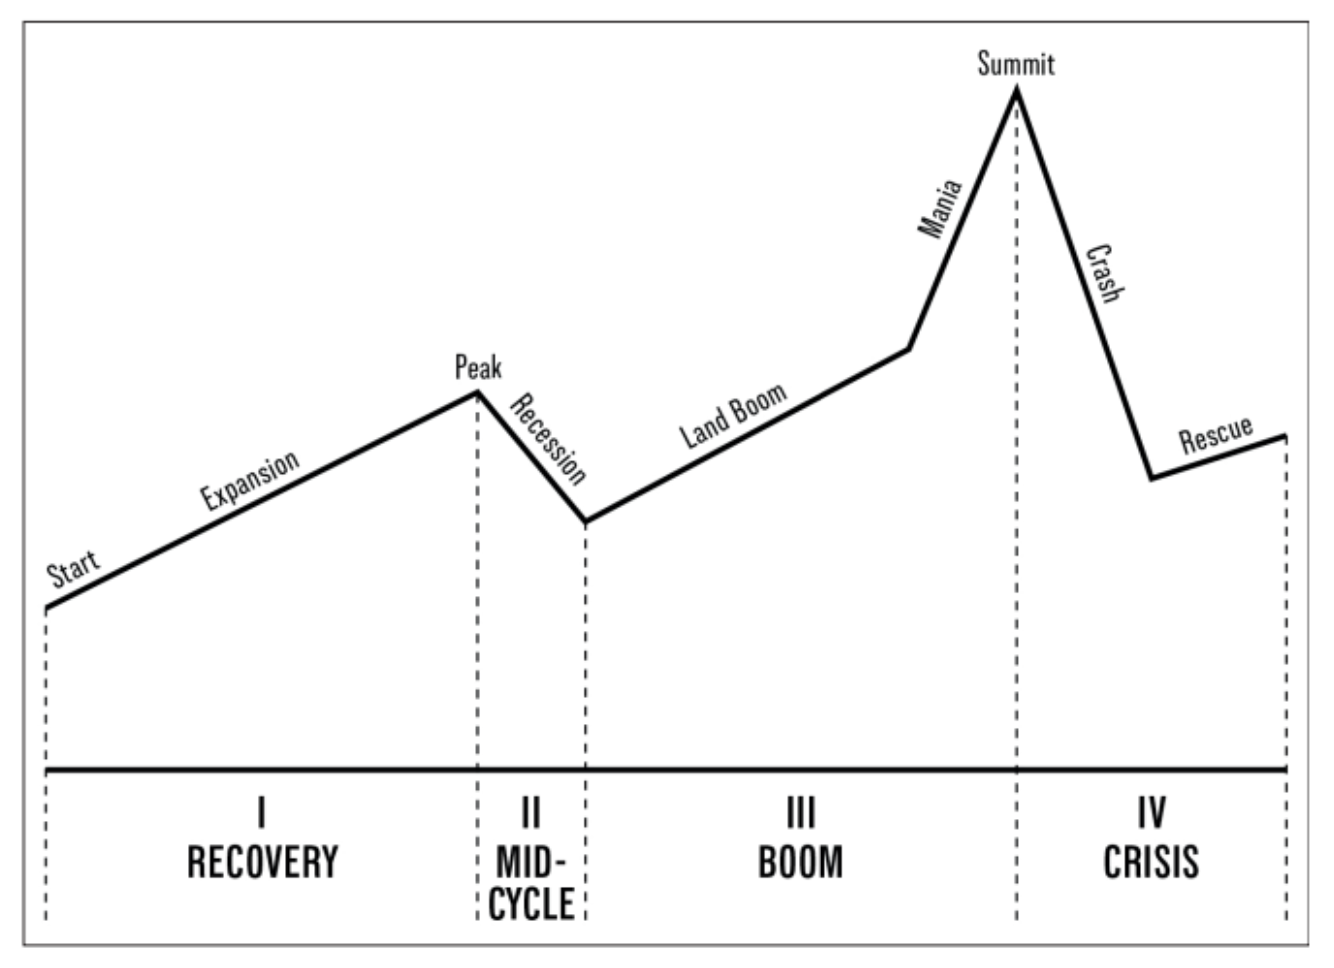
Each cycle has four phases.

Phase I is Recovery.  The prior cycle has ended and the economy recovers. Over the next 6-7 years the economy grows and confidence returns.

Phase II is a Mid-Cycle.  In this phase a minor recession takes place.  This generates some fear but it turns into a relatively short slowdown with no real financial crisis.

Phase III is the Boom.  This leads to a much stronger boom over the next six to seven years which generates higher growth, surging stock and property markets.  This phase concludes with about 2 years of extreme bullishness and FOMO, before the cycle finally reaches its summit, 14 years after it began.

Final phase is Crisis.  As Akhil Patel says: "The cycle ends with a terrific crash and depression.  The economy must be rescued from its deep malaise;  the ruins are cleared over a period of four years.  The 18-year cycle ends, and a new one begins."   

This 18.6-year cycle in the economy has been going on for over 200 years now.  Sometimes it gets interrupted by major events like World War II. Its length has been has short as 17 years and as long as 21years.  The following is a diagram that visually explains the cycle.

Created by Akhil Patel

So the current 18.6-year cycle began in late 2011/early 2012 as the economy started recovering.  The unemployment rate in the United States hit a peak of 10.0% in October 2009 and then started to decline.  By October 2011 it reached 8.8% and continued slowly dropping.  The stock market bottomed in March 2009, ahead of the economy as is usual. The end of the recovery phase occurred in about 2019.

Then the Mid-Cycle period began and included the brief recession at the beginning of the Covid pandemic.  So in late 2020 the next phase began. The Boom.

The Boom period began in late 2020/early 2021 and is projected to run into 2025-2026 timeframe, ending about 14 years after it began.  At that point everything peaks and the crisis period begins. As mentioned above the crisis period is expected to run about four years.

So an 18.6-year cycle that began in 2012 implies that the end of the Elliott Wave SuperCycle is delayed. And therefore the end of Cycle Wave V has also not occurred and will push higher for 2-3 more years. This drives my alternate count on the indexes.  Monitor the price action closely...and fasten your seatbelts.

1 2 3 57

Powered by WishList Member - Membership Software