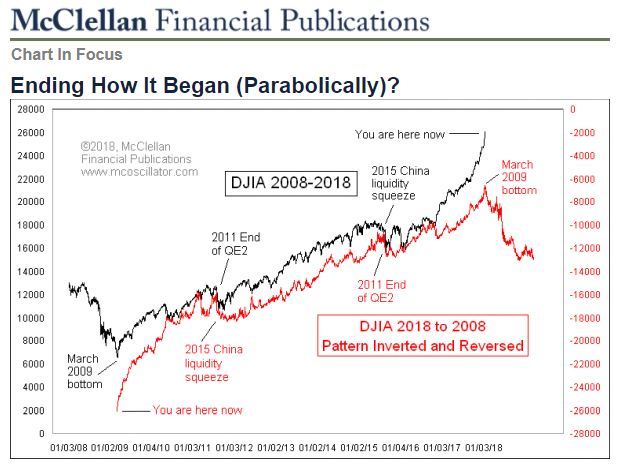
Today’s video focuses on the Dow Jones Industrial Average (DJIA) weekly chart. Tom McClellan of McClellan Financial Publications published an article on Thursday where he talked about the parabolic stock market pattern of the DJIA. He actually flipped the chart and then compared it to the actual chart. It is very interesting.
People think of a parabolic line as starting off fairly slow and then rapidly accelerating until it finally seems to be going almost straight up. They have a convex look to them. But that same line, if flipped, would have the same curve but more of a concave look to it. Here is how he showed it:

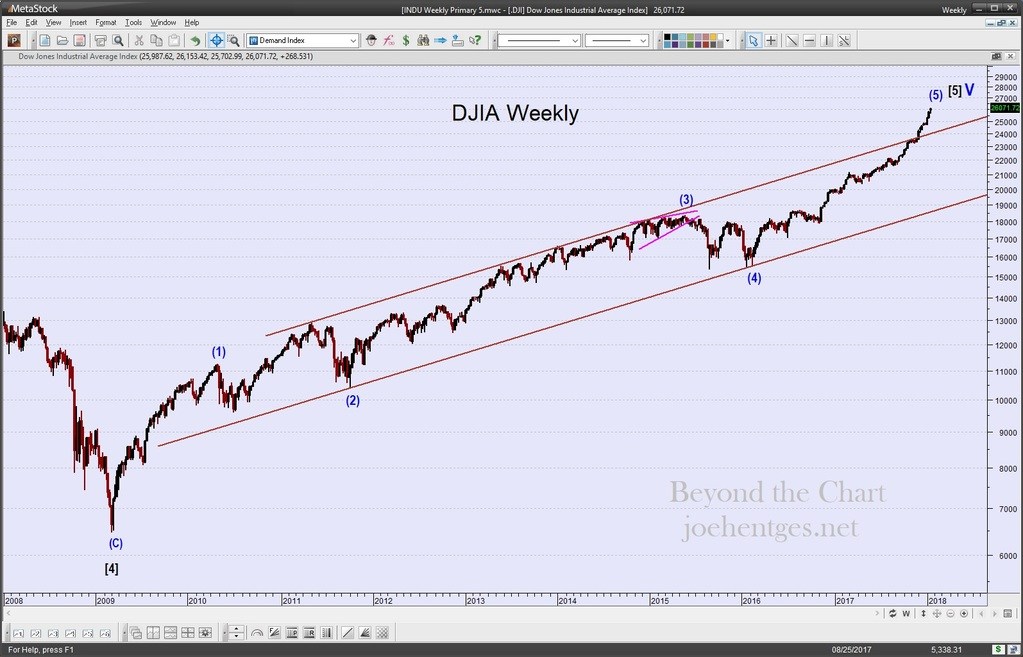
So I compared where we are now, near the end of Intermediate Wave (5), to the magnitude of Intermediate Wave (1). These are the ending and beginning portions of the chart shown above. We are very close to equal.
Last weeks high for Intermediate Wave (5) was 1.69 times the beginning low of the week ended February 12, 2016. Intermediate Wave (1) was 1.74 times the beginning low of the week ended March 6, 2009.
Crude Prediction
In today’s video I also review a chart that Tom McClellan published in February, 2016 showing crude oil prices and how they foretold the Trump rally…10 years ago. It was an interesting article then but even more interesting is that prices 10 years ago also predict a stock market peak and collapse in 2018.
You do remember the huge peak in crude oil into June-July 2008 don’t you? I believe the high was $147.27 a barrel on July 11, 2008. By December 23rd, it had collapsed to $30.28.
Not all of the price patterns of crude have a direct correlation to the DJIA but there have been some very interesting ones. Watch the video below and read the article.
Extremely Overbought
So when the title says, party on, that is a description of what folks are doing right now. And it doesn’t matter if we are talking about your 401k, your margin account or the activity of huge hedge funds. The DJIA and S&P 500 are now more overbought than at any time in the history of the stock market.
I am making that statement based on the RSI (10) level of their monthly charts. Now the month hasn’t ended yet. Eight more trading days. But right now 2018 is looking to go down as a truly historic year. Fasten your seat belts.

