I often wonder if Fibonacci numbers aren't the keys to the universe. These numbers generate the Golden Ratio ( or Mean) which equals 1.618 (inverse is 0.618). The Golden Ratio drives the Golden Rectangle which in turn drives the Golden Spiral. The Golden Spiral can be seen reflected in numerous places in all of nature from spiral galaxies (like the Milky Way), hurricanes, pine cones, to seeds on a sunflower. A good brief introduction to Fibonacci numbers can be viewed in the following video.
The Fibonacci ratios are important and are used for many key relationships in analyzing Elliott Wave structure and projecting future moves. But the actual Fibonacci levels themselves can play a key role that is many times forgotten or ignored. They can become major hurdles that the market struggles to get through. Let's look at how the Dow Jones Industrial Average (DJIA) reacted at various Fibonacci levels.
Fibonacci Levels that Played Key Roles
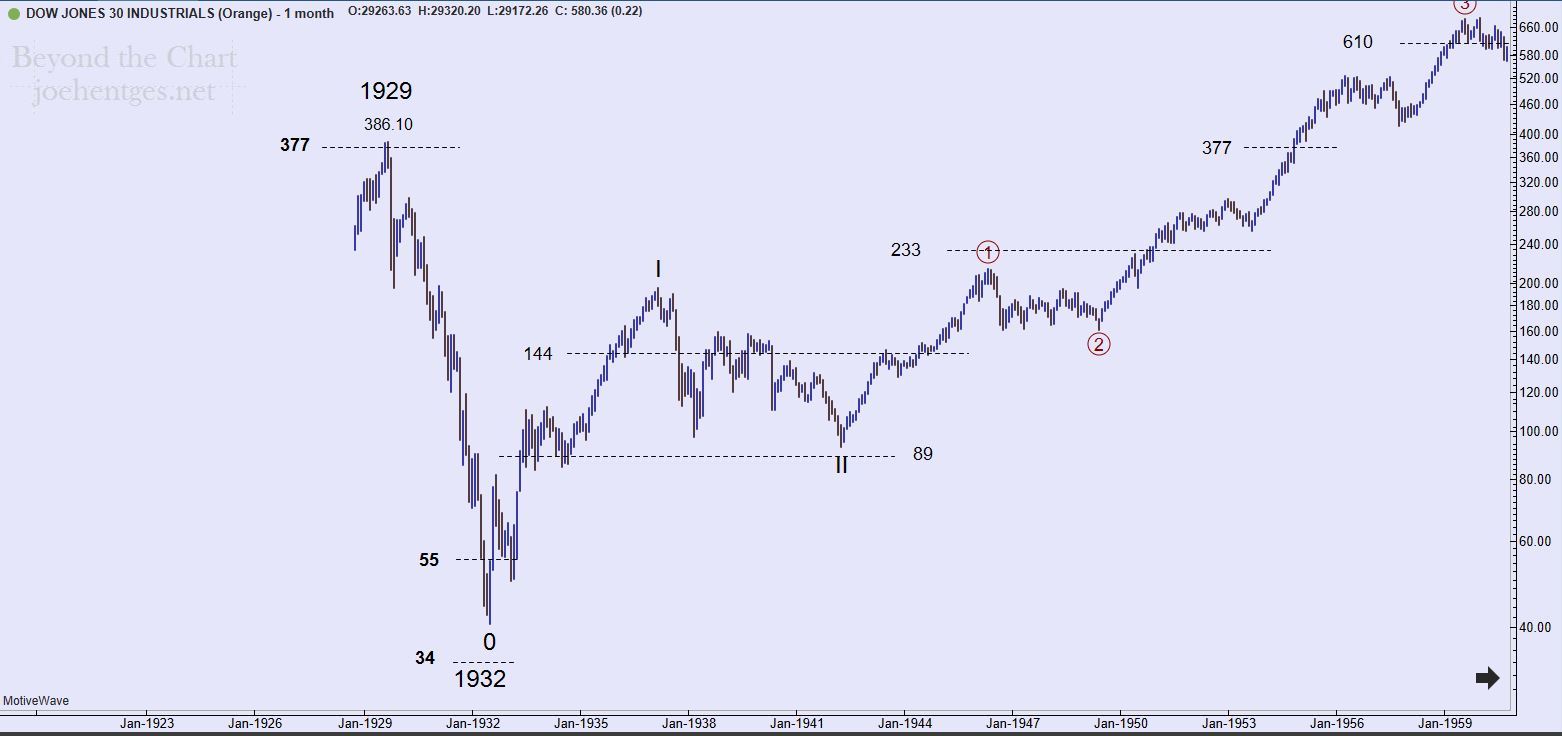
I reviewed Fibonacci levels for the DJIA from 1928 thru present. The first key Fibonacci level was 377. The DJIA hit that level in 1929 and then only exceeded it by 2.4% before collapsing in the 1929 crash.
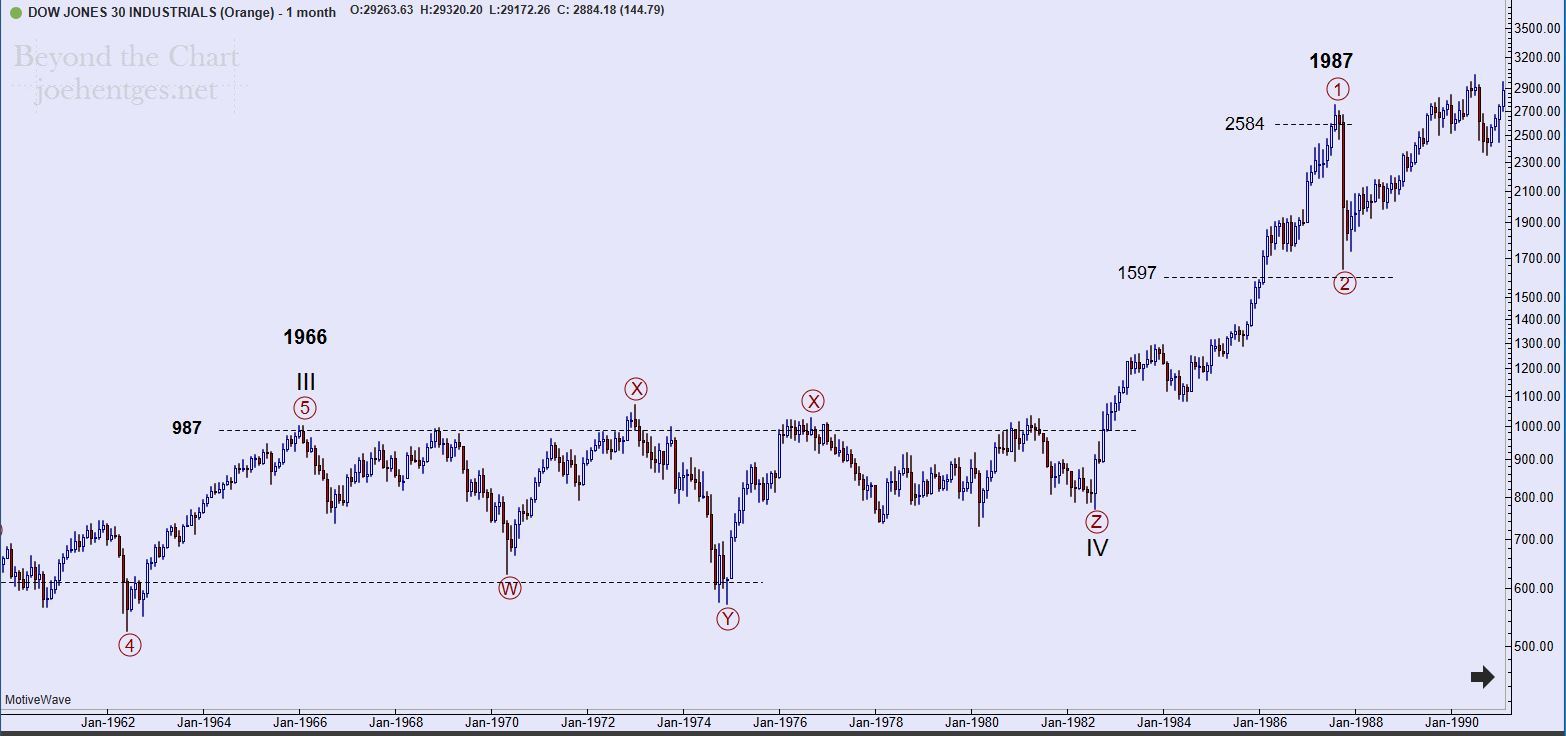
The next chart shows the end of Cycle Wave III in 1966. The DJIA exceeded the 987 Fibonacci level by just 1.4% at that high in 1966. What followed was a 16 year sideways correction. The DJIA tried 4 times to break above 987 and failed. The largest overshoot was 8.1% in January 1973.
Cycle Wave IV began in August 1982 and Primary Wave 1 (circled) exceeded the 2584 Fibonacci level by 6.3% before collapsing. Note that the prior Fibonacci level of 1597 was very close to the low of that Primary Wave 2 (circled) pullback.
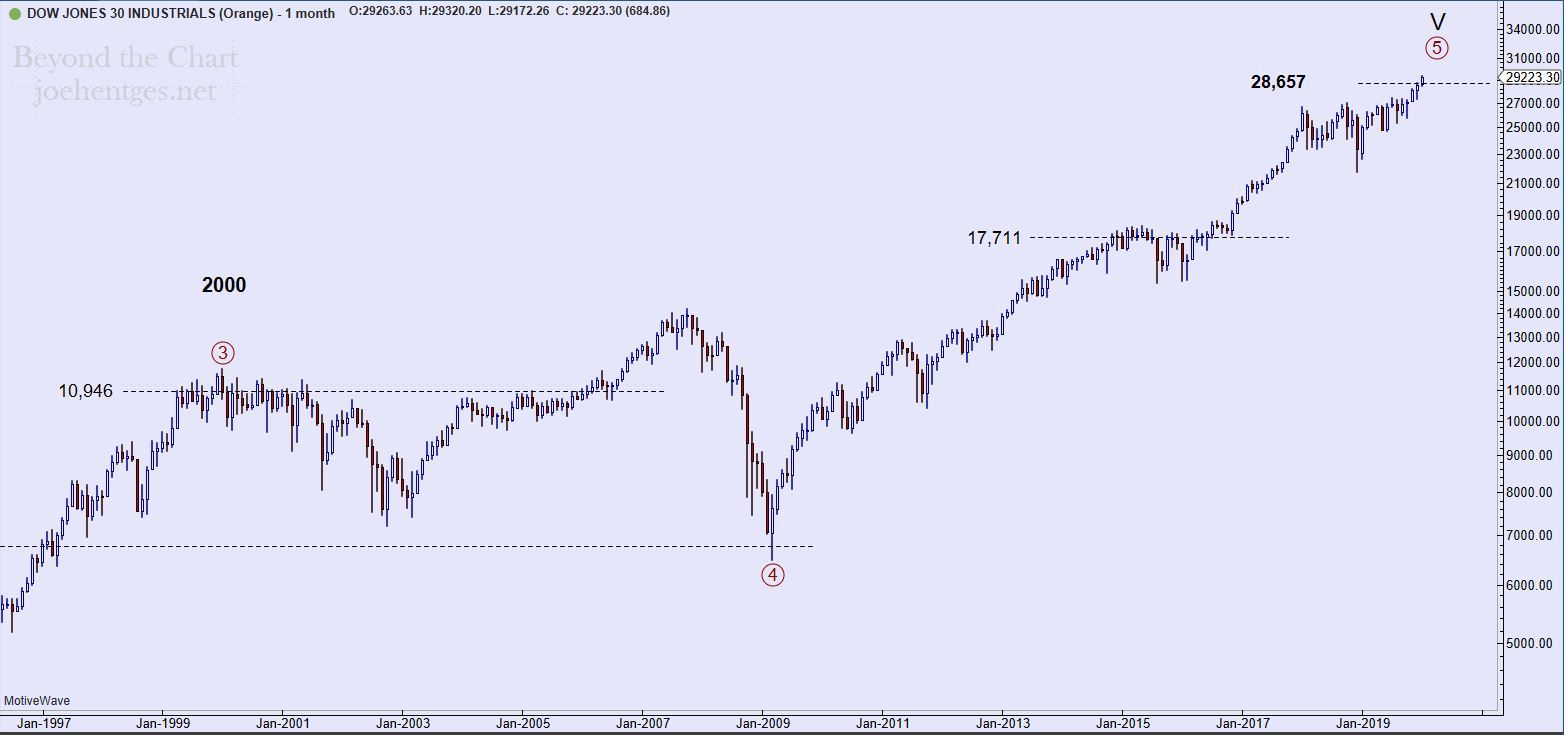
The next motive wave is Primary Wave 3 (circled) and it ended in January 2000. (see chart below) This wave exceeded the Fibonacci level at 10,946 by 7.3% before beginning a major correction.
End of a Long Road?
So here we are at Fibonacci level 28,657 and near the end of Primary Wave 5 (circled) which is the 3rd motive wave up since 1982. Is there a guarantee that this level will define the top? No. There are no guarantees when it comes to the stock market. But given the current market extremes and wave count, we need to be on high alert for a top. This could be the final hurdle for a long, long time.


