Professor Robert Shiller's CAPE (Cyclically Adjusted Price-to-Earnings) ratio, also known as the Shiller PE ratio, is a widely followed valuation metric for assessing the long-term valuation of the stock market. It differs from the traditional P/E ratio by using a longer-term average of earnings to smooth out the impact of economic cycles and provide a more stable measure of valuation.
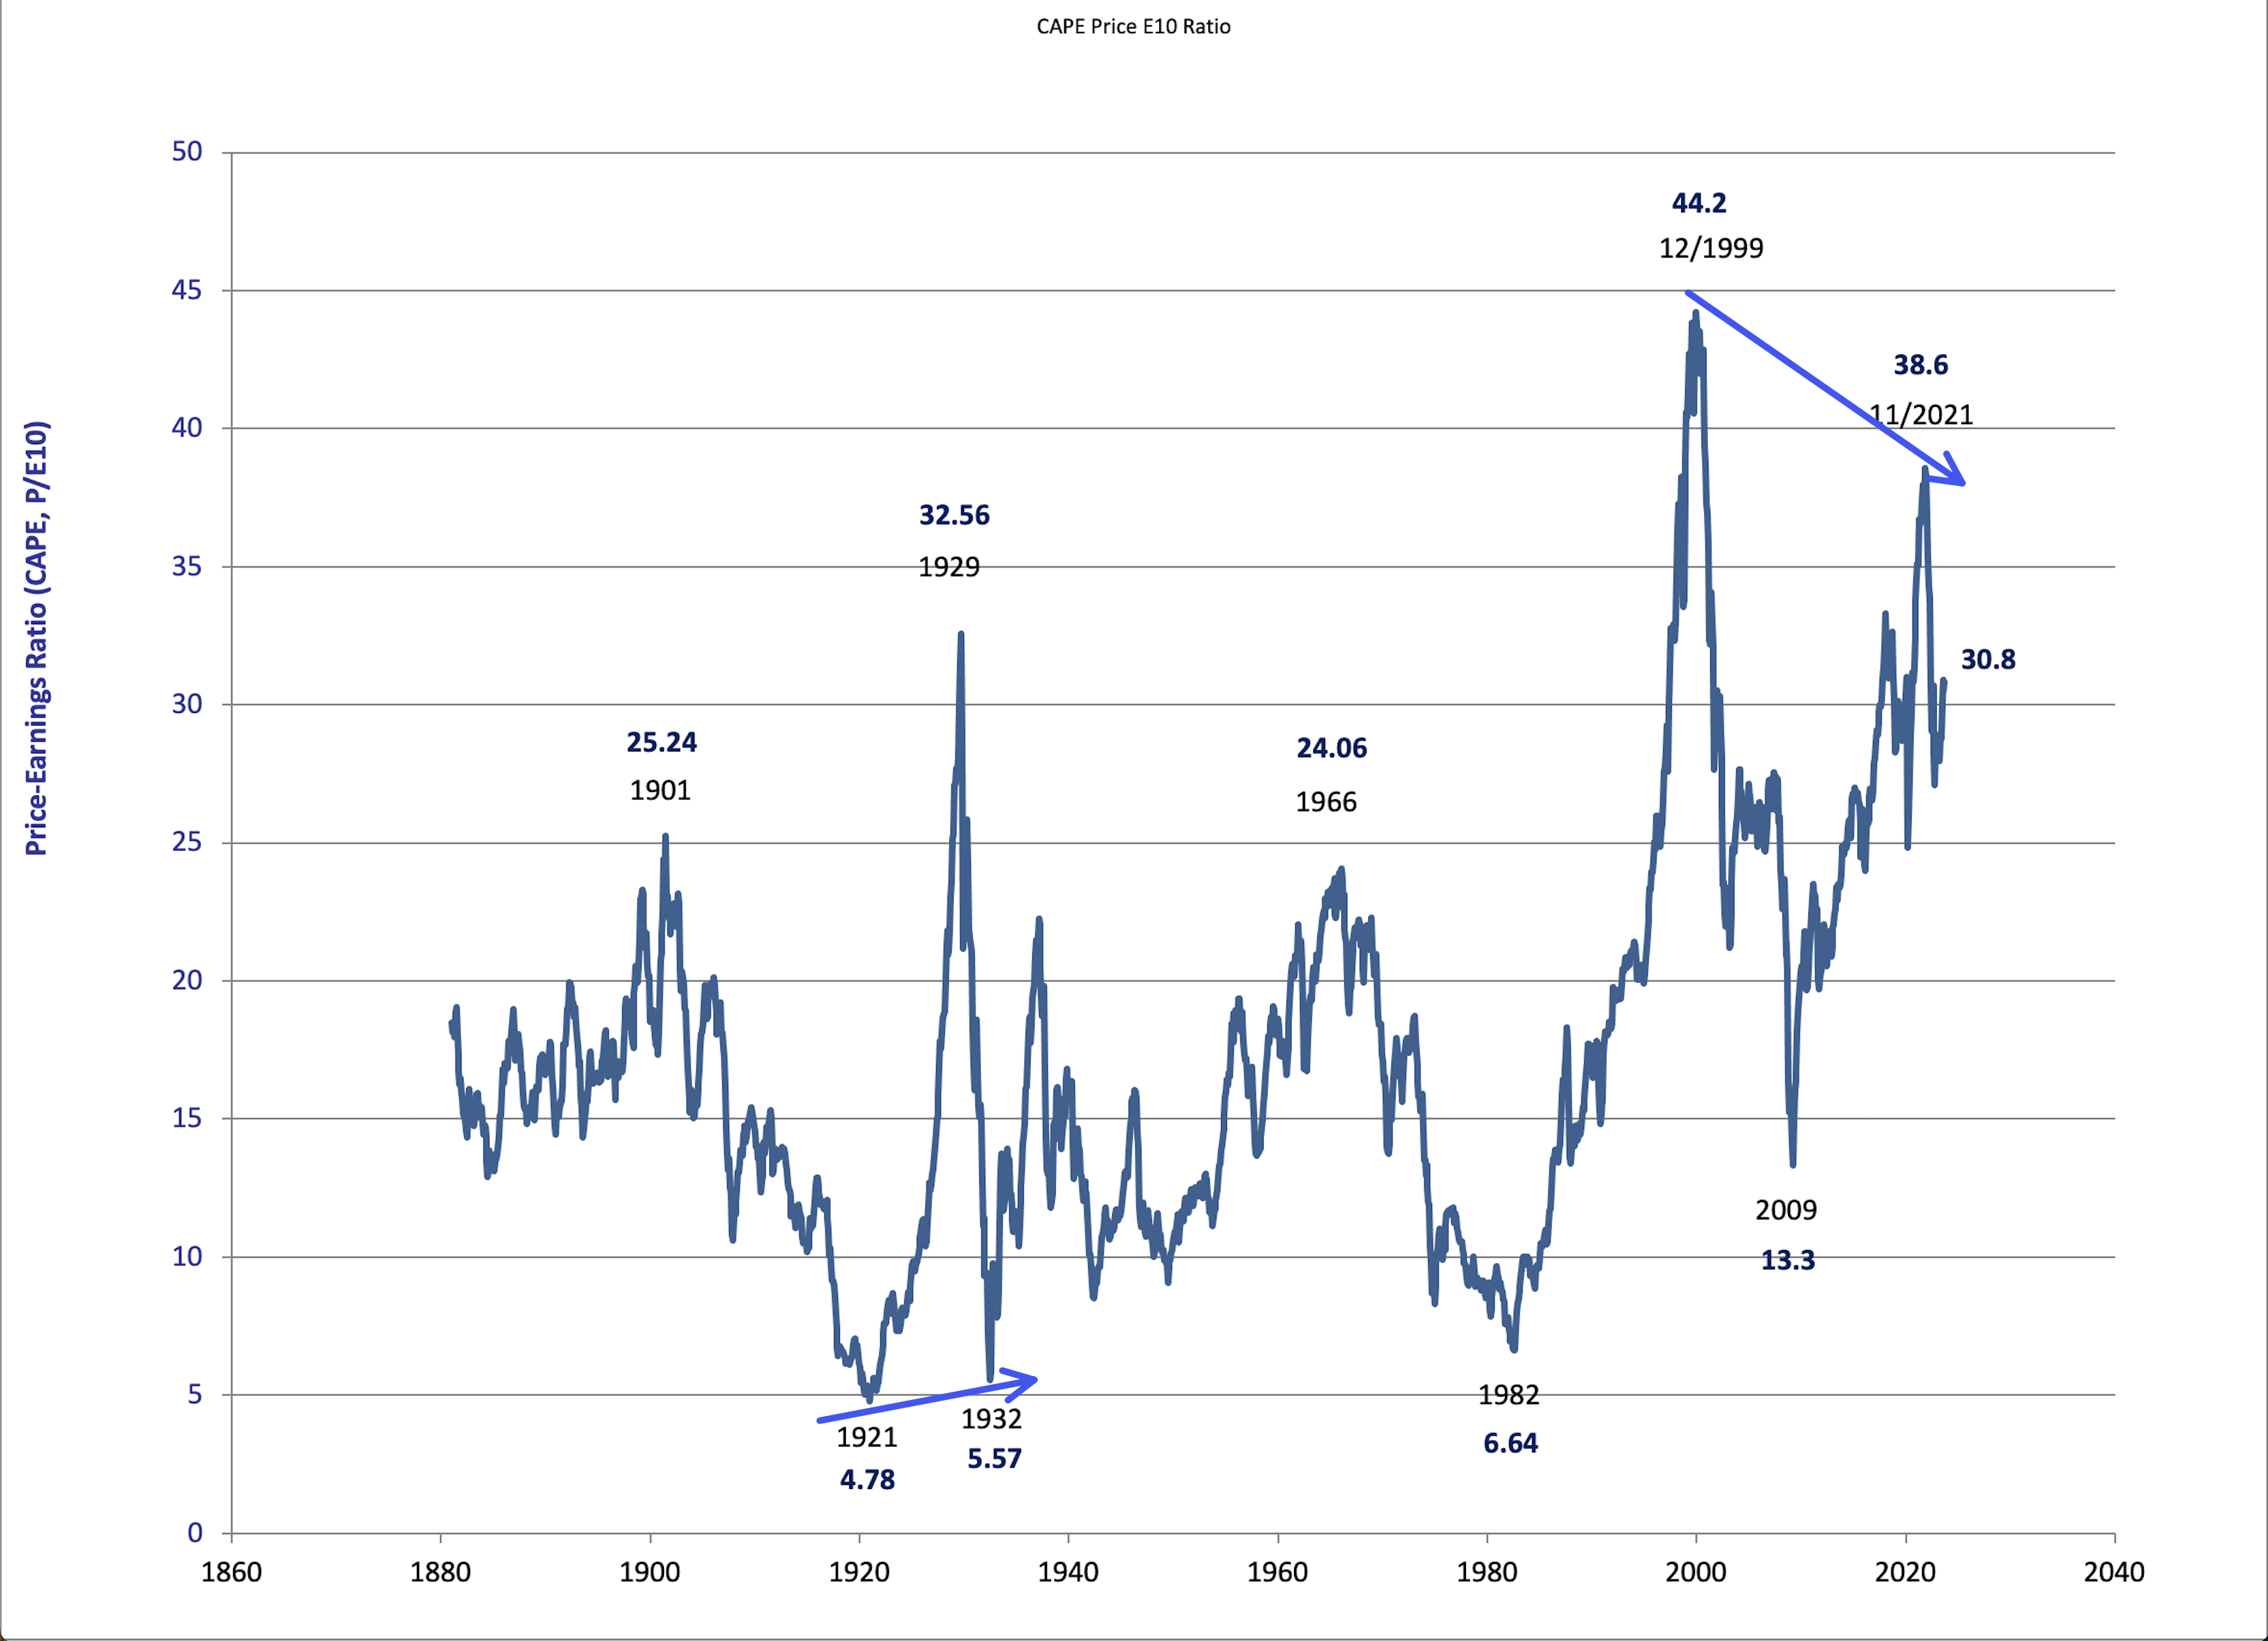
The CAPE ratio provides a great historical context for stock market valuations, allowing investors to see how current valuations compare to historical averages. Let's take a look at the following chart of the CAPE ratio using stock market data since 1871.

The current CAPE ratio sits at 30.8 for September 2023. This is a preliniary reading as all data inputs are not finalized yet. The CAPE ratio has declined from a very high reading of 38.6 in November 2021. This reading coincided with the top in the Nasdaq and just prior to the peak in the Dow Jones Industrial Average and S&P 500 Index in January 2022. You will notice that this peak in valuation was higher than 1929 and second only to the extreme achieved in the Dotcom bubble of 1999-2000. 2021 had its share of craziness and extreme market activity creating a bubble for the ages.
One of the key insights from the CAPE ratio is the concept of mean reversion. Historically, when the CAPE ratio has been high (indicating overvaluation), subsequent returns have tended to be lower, and when it has been low (indicating undervaluation), subsequent returns have tended to be higher.
Coming down from the 2021 peak, I believe we are in the process of stair stepping our way down. We could very easily do something like what occurred between 1966 and 1982 when the stock market basically went sideways for 16 years with wild swings. Or we could take the elevator down like after 1929 and 1999. How low? No one knows. But everything moves in cycles. Just look at what has happened in the bond market recently.
There is something else that I hadn't noticed before. Look at the CAPE ratio readings in 1921 and 1932. The stock market went lower in 1932 but the CAPE ratio provided a bullish divergence indicating a long-term bottom. And a similar thing occurred with the CAPE readings of 12/1999 and 11/2021. Stock market in 2021 was much higher than 1999/2000 but the CAPE ratios provide a long-term bearish divergence indicating a possible long-term peak.
Now the CAPE ratio is not a precise timing tool for short-term market movements. High or low CAPE ratios do not necessarily predict immediate market crashes or rallies. Markets can remain overvalued or undervalued for extended periods, and other factors, such as interest rates and economic conditions, also play a significant role.
But CAPE ratios do indeed provide perspective on where the market sits compared to previous times in history of overvaluation and undervaluation. The CAPE ratio is saying this stock market is still extremely overvalued.

