

The CBOE Volalitiy Index, VIX exploded this week, up 55% from the close last Friday. It closed the week at 15.51 after hitting a high of 17.28 on Friday. It has been coiling tighter and tighter for the last 18 months. In fact this coiling process occurred throughout the entire 5th Intermediate Wave up in the market that started in February 2016.
Explosion
The explosion this week actually began on Tuesday as the VIX broke higher out of a beautiful bull flag that I was monitoring for my Insider Members. On Tuesday the VIX closed at 10.96. It is also interesting to note the reversal candle that occurred on July 27 which started this entire move. See chart below.
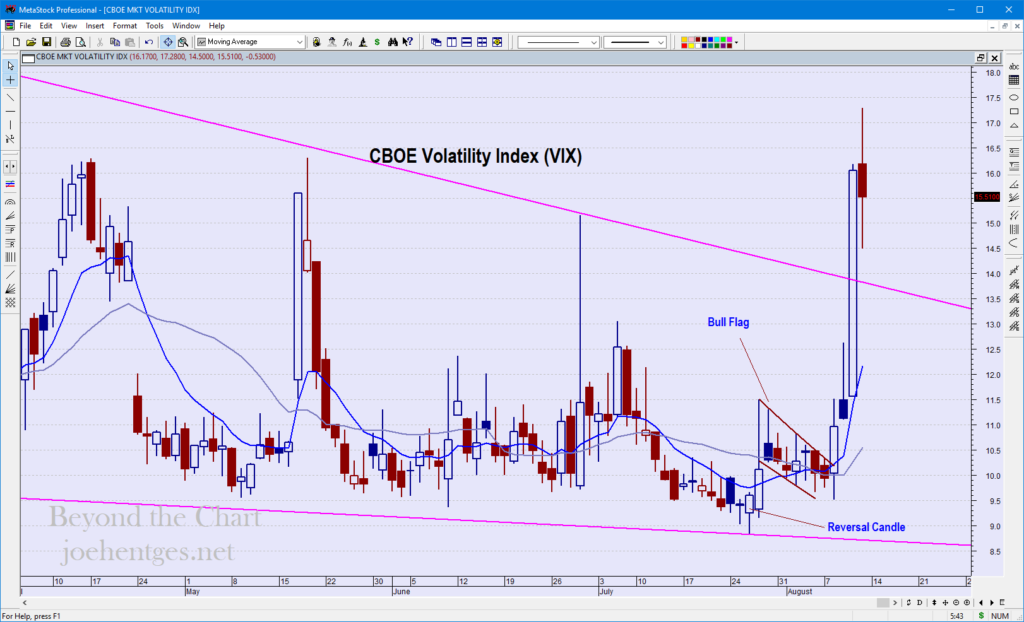
VIX Daily Chart
So now that we’ve had this explosion how much higher can the VIX go? Well it can go a heck of a lot higher. A normal level for the VIX has been about 20, that is the red horizontal line on the weekly chart below. There have been significant periods of time where the VIX has stayed above 20 and below 20.
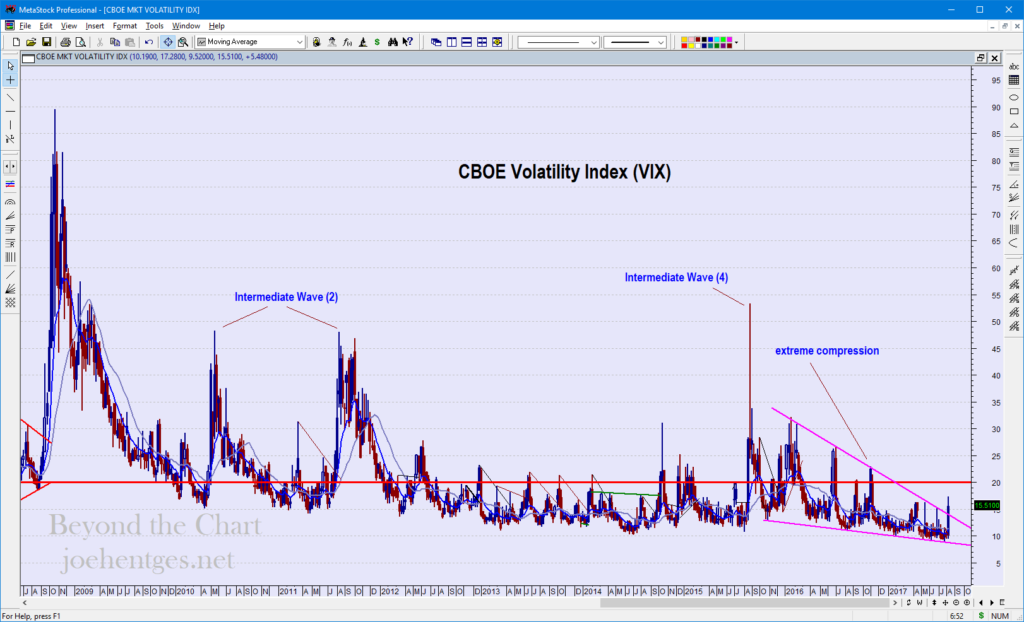
VIX Weekly Chart
Prior Highs
The big break in the market in August 2015 that led to the Intermediate Wave 4 correction hit a VIX high of 53.29. Intermediate Wave 2 hit a VIX of 48.20 in May 2010 and an equal level in August 2011 as the two legs of that corrective wave occurred.
But that pales in comparison to the level that VIX exploded in the 2008 financial crisis. In October 2008 the VIX hit a high of 89.53. So the VIX can go a lot higher.
Given the degree of coiling and compression that has occurred over the last 18 months and the current wave structure, I believe there is a high probability that this explosive move has much more to go. At a minimum VIX should reach the levels of 2010/2011 which was 48.
And if that happens stocks will be going the other direction, so get ready.