

Yes the VIX has been low off and on over the last few years. And by low I mean in the 10.5 to 12.0 range. But over the last 4 weeks we’ve had several closes below 10.
Friday’s close was the lowest since December 27, 1993.
There have only been two other days in the history of the VIX with lower closes. Both of those were December 22nd and 23rd of…you guessed it…December 1993.
VIX Double Bottom
So take a look at the chart below. This is the VIX during that time-frame and a few a months afterword.
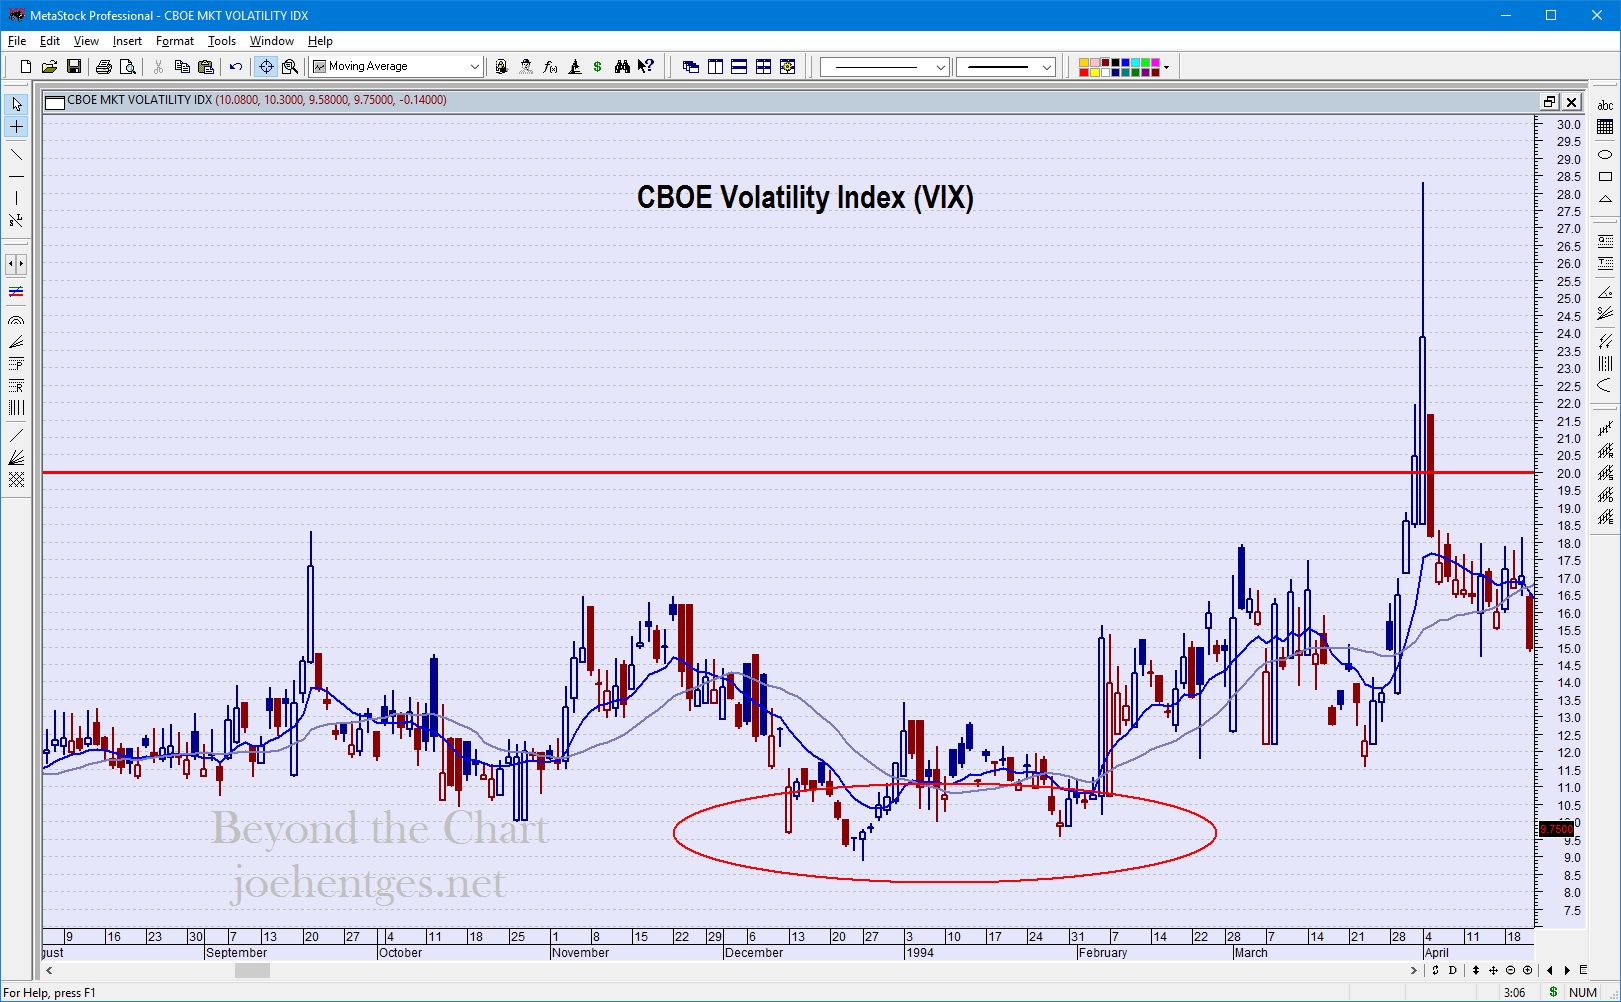
VIX December 1993
Notice the double bottom in December and January both with readings below 10 about a month apart. After the second bottom, the VIX gradually started to rise peaking on April 4th with a high of 28.30 This was about 2 months after the second bottom.
Now take a look at the chart below.
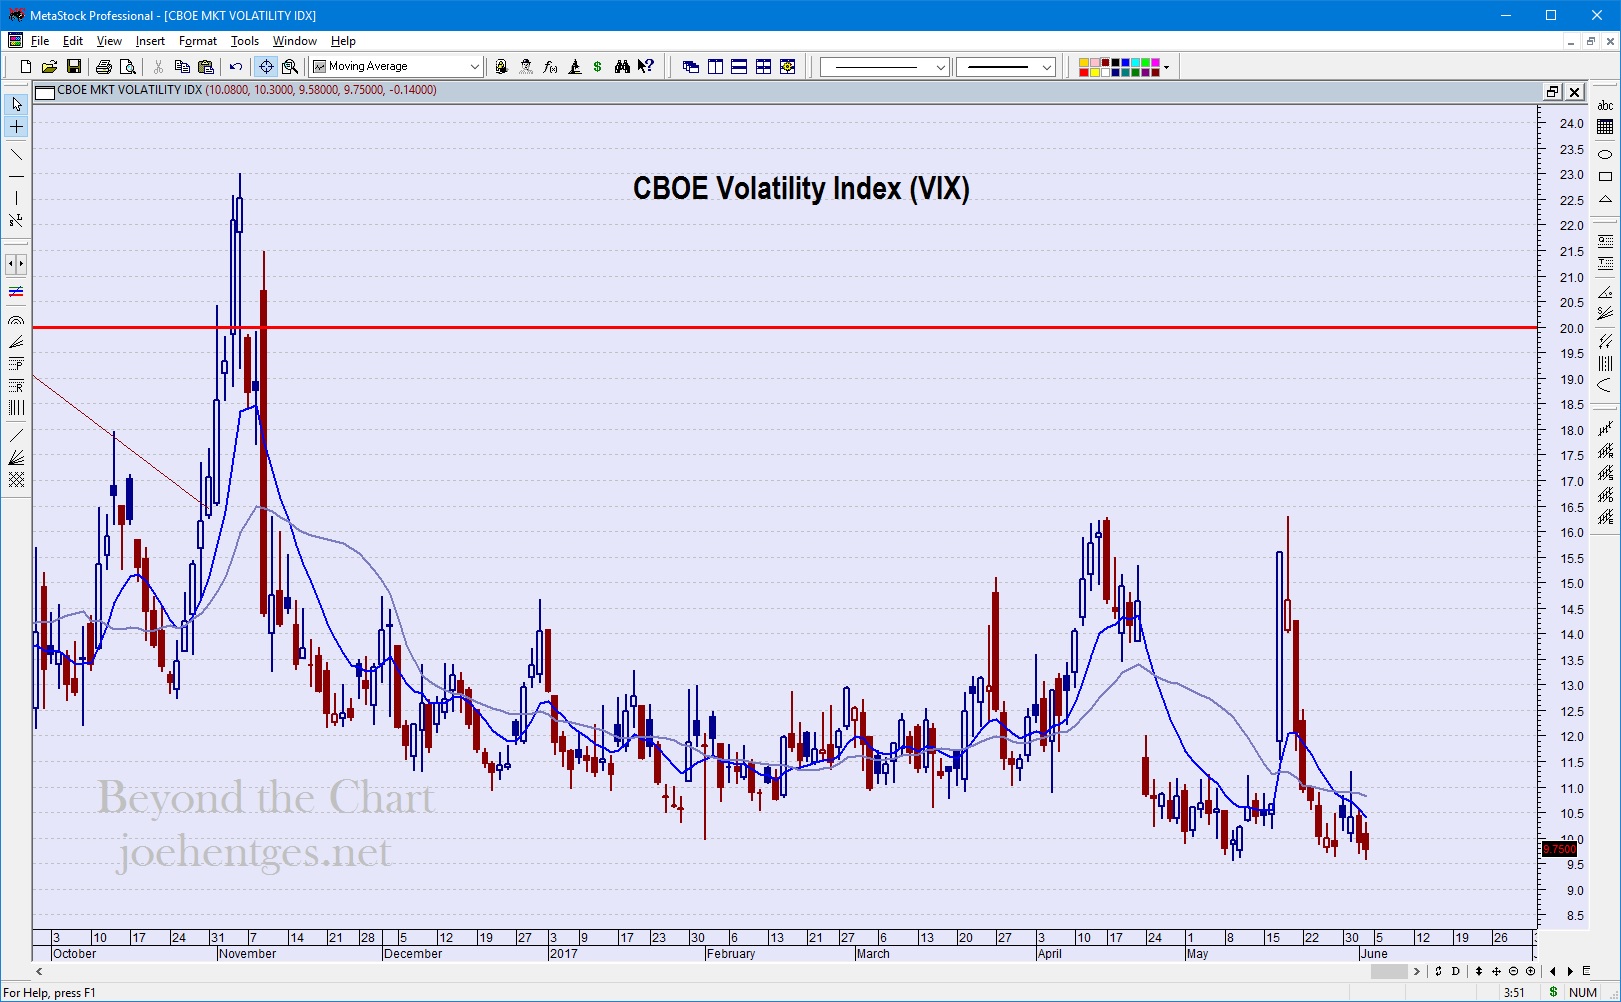
VIX May – June 2017
We are getting a very similar bottom. Does this mean the same exact thing that happened 23 1/2 years ago will happen again? Who knows. The market usually doesn’t repeat in the exact same manner.
But I am constantly looking looking for patterns that might give us clues. I think this is worth watching. The VIX is at an extreme. Markets don’t stay at extremes.
Trading Psychology
The following is an excerpt from an interview by Jack Schwager of Marty Schwartz, a.k.a. “Bit Bull” in Schwager’s book Market Wizards.
Schwager: Why do most traders lose money?
Schwartz: Because they would rather lose money than admit they’re wrong. What is the ultimate rationalization of a trader in a losing position?
“I’ll get out when I’m even.”
Why is getting out even so important? Because it protects the ego.
I became a winning trader when I was able to say, “To hell with my ego, making money is more important.”
Today’s Video
In this brief market update video I look at the S&P 500 Index (SPX) and then discuss the VIX that I just wrote about above.