
Well, we now have a new president with Donald J. Trump sworn in as the 45th President of the United States yesterday. The stock market has been on a tear since the election.
As of the close on January 19, the last trading day prior to inauguration, the Dow Jones Industrial Average (DJIA) is up 7.6% from the close on November 8, Election Day.
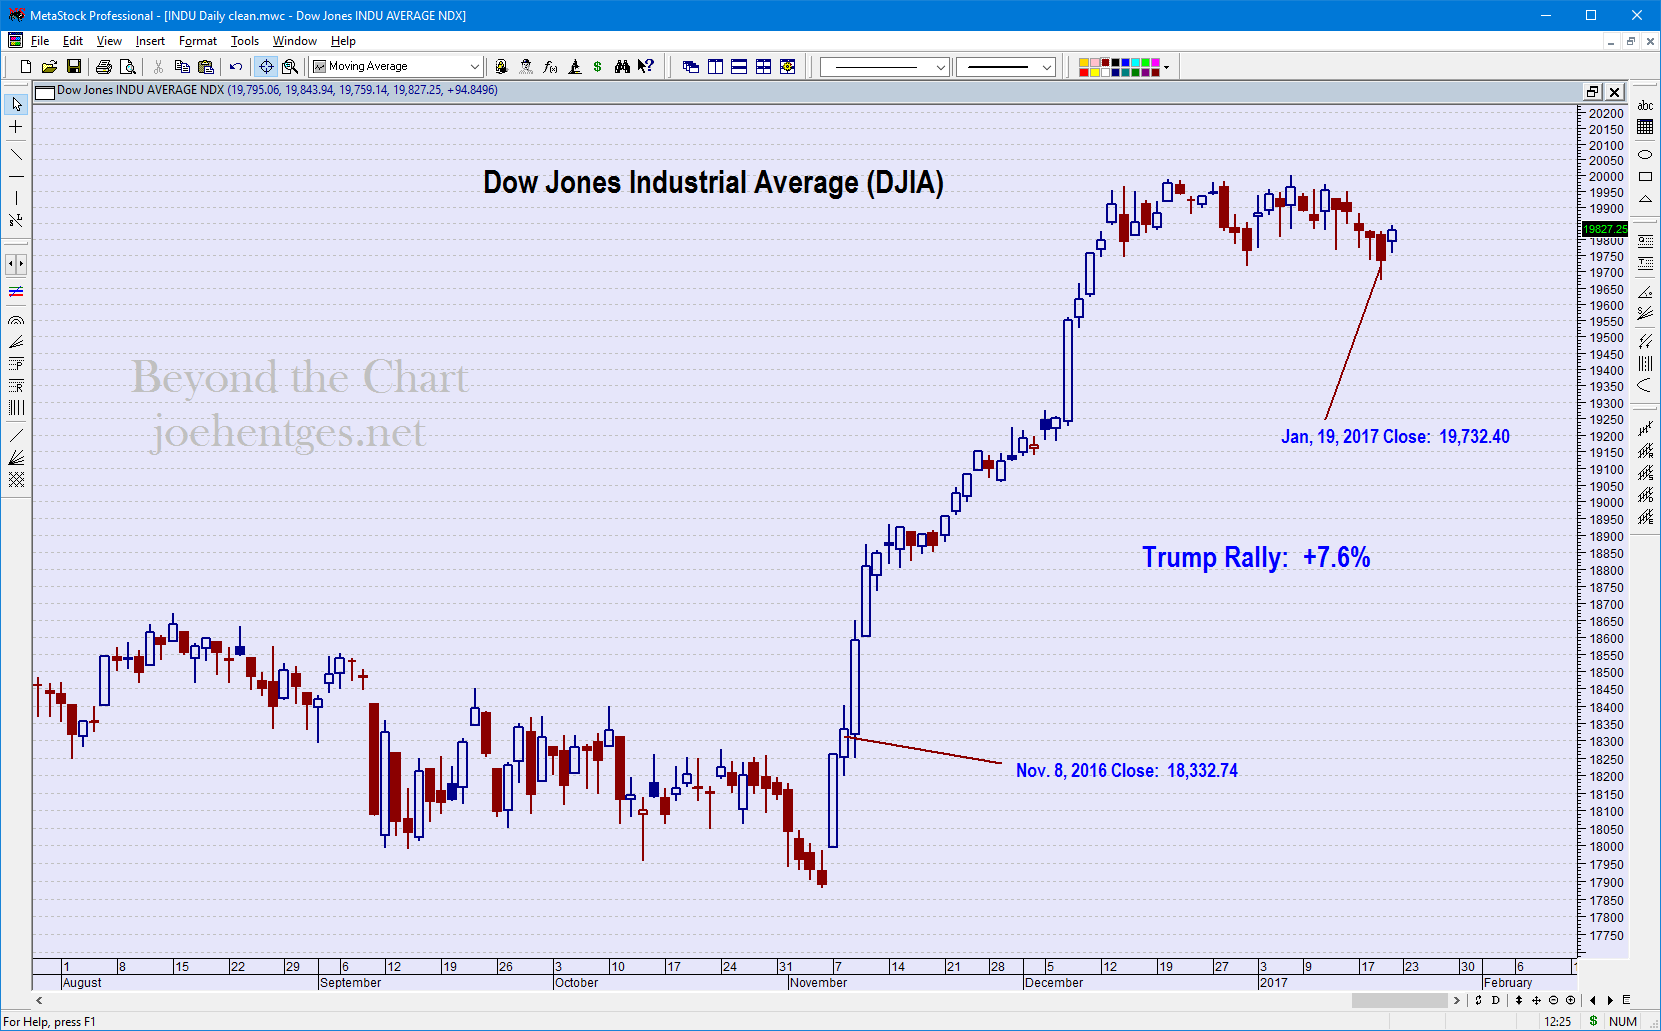
Trump Rally Comparison
So how does this now compare to other presidents since 1900. We all know President Trump ( wow that’s the first time I’ve used that title) likes to win but this is one ranking where he is not in first.
The following results are based on the DJIA. The comparison uses the last day prior to inauguration and the close on election day, or the last trading day prior to election day if no trading occurred. Also note, Herbert Hoover’s inauguration day was March 4, 1929 so I used the close on January 19, 1929 to have an apples to apples comparison.
- Herbert Hoover: +18.8%
- William Clinton: +12.4% (beginning of his 2nd term)
- Donald Trump: +7.6%
- Dwight Eisenhower: +6.2%
- John Kennedy: +5.8%
So the DJIA has performed very well since President Trump’s election but not nearly as hot as it was at the end of 1928 going into 1929.
Trump and CAPE
I’ve discussed the Cyclically Adjusted P/E Ratio (CAPE) several times before. This is the ratio that was developed and maintained by Yale Professor Robert Shiller. This ratio provides good insight as to how over or under valued the market may be. Here is his chart with the latest data provided.
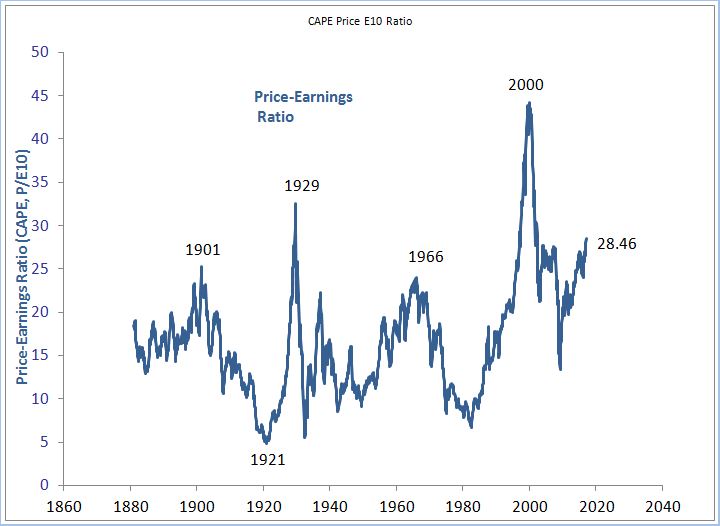
data provided by Yale Professor Robert Shiller
Now the current reading of 28.46 is a preliminary reading but it is the latest available. So who are the top 5 presidents based on the CAPE reading for the month they became president?
- George W. Bush: 36.98 January 2001
- Donald Trump: 28.46 January 2017
- Herbert Hoover: 27.68 March 1929
- Theodore Roosevelt: 22.59 September 1901
- Richard Nixon: 21.19 January 1969
- After Bush became president the DJIA lost 31.2% over the next 21 months. It bottomed in October 2002 and then rallied into the high in October 2007 followed by the financial crisis of 2007-2009.
- And we all know how the over valuation at Hoover’s inauguration ended…1929 crash and Great Depression. The stock market peaked 6 months after he became president.
- Teddy Roosevelt became president when President McKinley was assassinated in September 1901. The DJIA proceeded to drop 37% over the next 26 months.
- Richard Nixon took office in January 1969 and the market dropped 32.5% over the next 16 months.
Trump Presidency Future
So what does this mean for the Trump Presidency? No one knows for sure. What it does say is that the market valuation at the beginning of his term is at very lofty levels.
The market was not initially kind to the other 4 presidents and 3 of those 4 presidencies did not end well either…Bush – financial crisis, Hoover – Great Depression, Nixon – resignation
If the market were to peak right now, the current CAPE reading would be the third highest peak in the history of United States stock market since 1870.
I continue to monitor the Elliott Wave patterns of the market to help in evaluating the structure of this market and how much life it has left in it.
In today’s brief market video I look at the S&P 500 ETF (SPY), the Russell 2000 ETF (IWM), the VIX, semiconductors, homebuilders, financials and Nasdaq Biotech ETFs.