
Today I am starting a series of weekly posts about the most actively traded ETFs. My initial focus will be on ETFs that invest in stocks that trade in the United States.
I am starting with the VanEck Vectors Gold Miners ETF (GDX). GDX has a 3 month average daily volume of 73.6 million shares. Various sources have the Gold Miners listed as either the number 1 or number 2 most actively traded ETF.
Gold Miners
The chart below is a daily chart of GDX. I talked about GDX, GDXJ and NUGT back in a video on August 6th. At that time I felt that these ETFs were at the end of a 5 wave run or very close to it. I was a few days early.
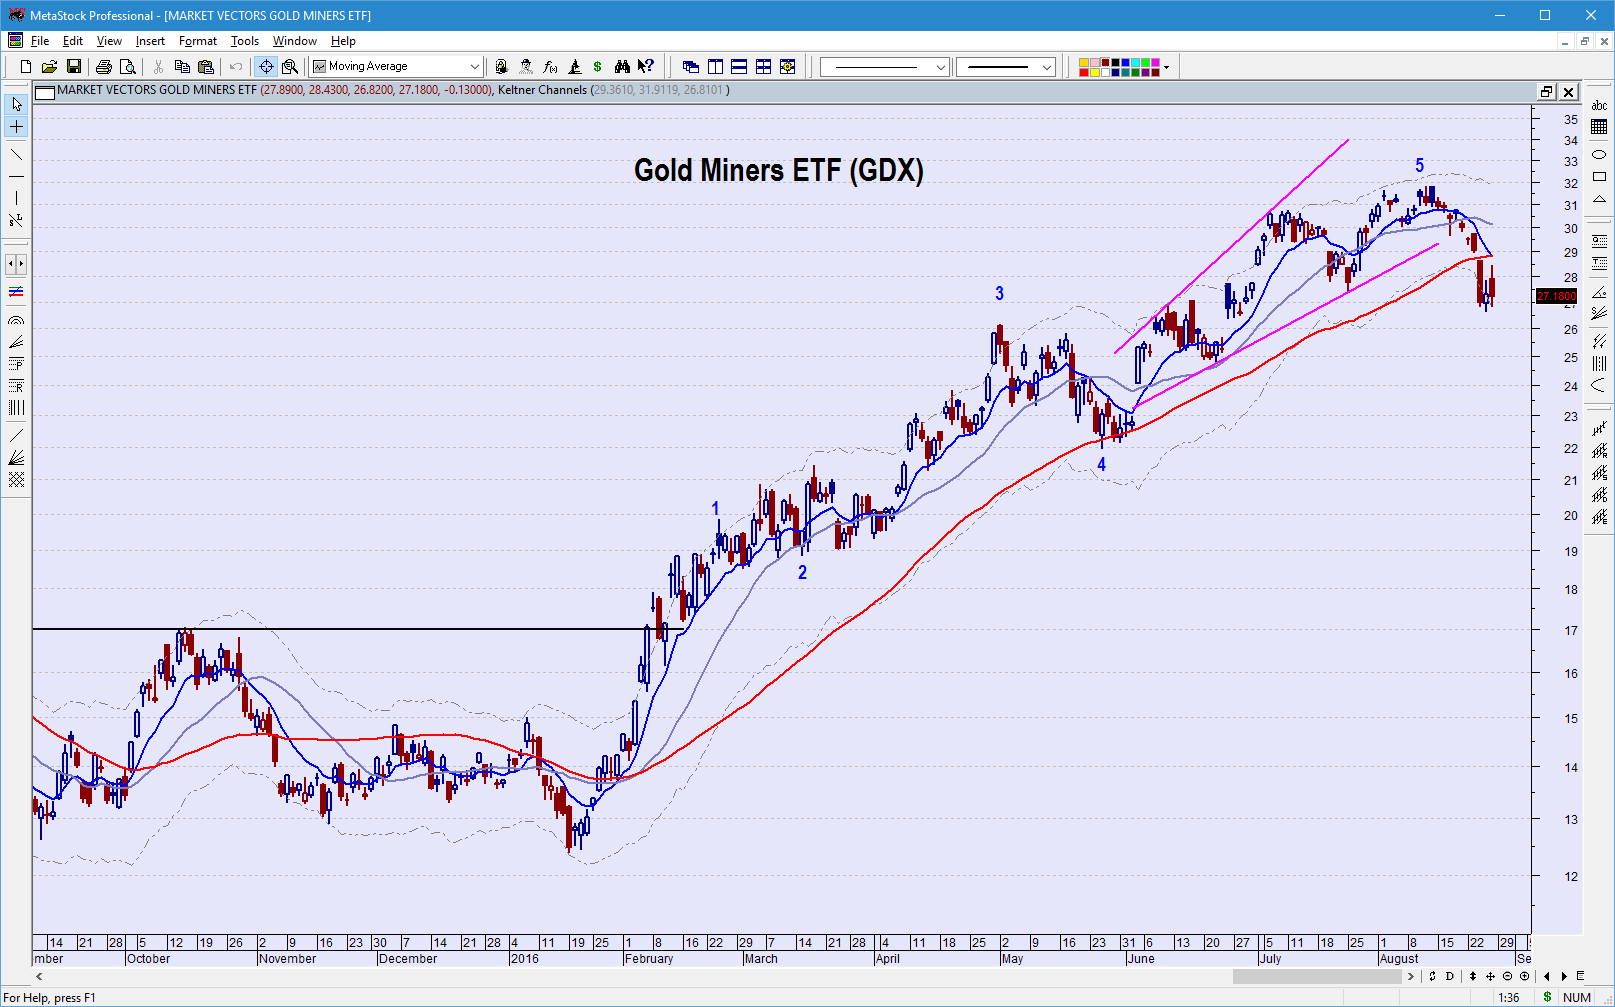
I am still looking for GDX to continue pulling back, although moves in a straight line. If it pulls back well into the previous 4th wave it will most likely close the June 3rd gap between 23.48-24.08. Possible support before that at 25 also.
The top 3 holdings in GDX are Barrick Gold Corp (10.37%), Newmont Mining (9.5%) and Goldcorp Inc (6.06%). Note I’m ignoring Newcrest Mining (6.08%) as it doesn’t trade in the U.S. So let’s look at how these three gold miners look.
Barrick Gold Corp (ABX)
All the charts for the following 3 companies are weekly charts to show a longer term perspective. ABX is first.
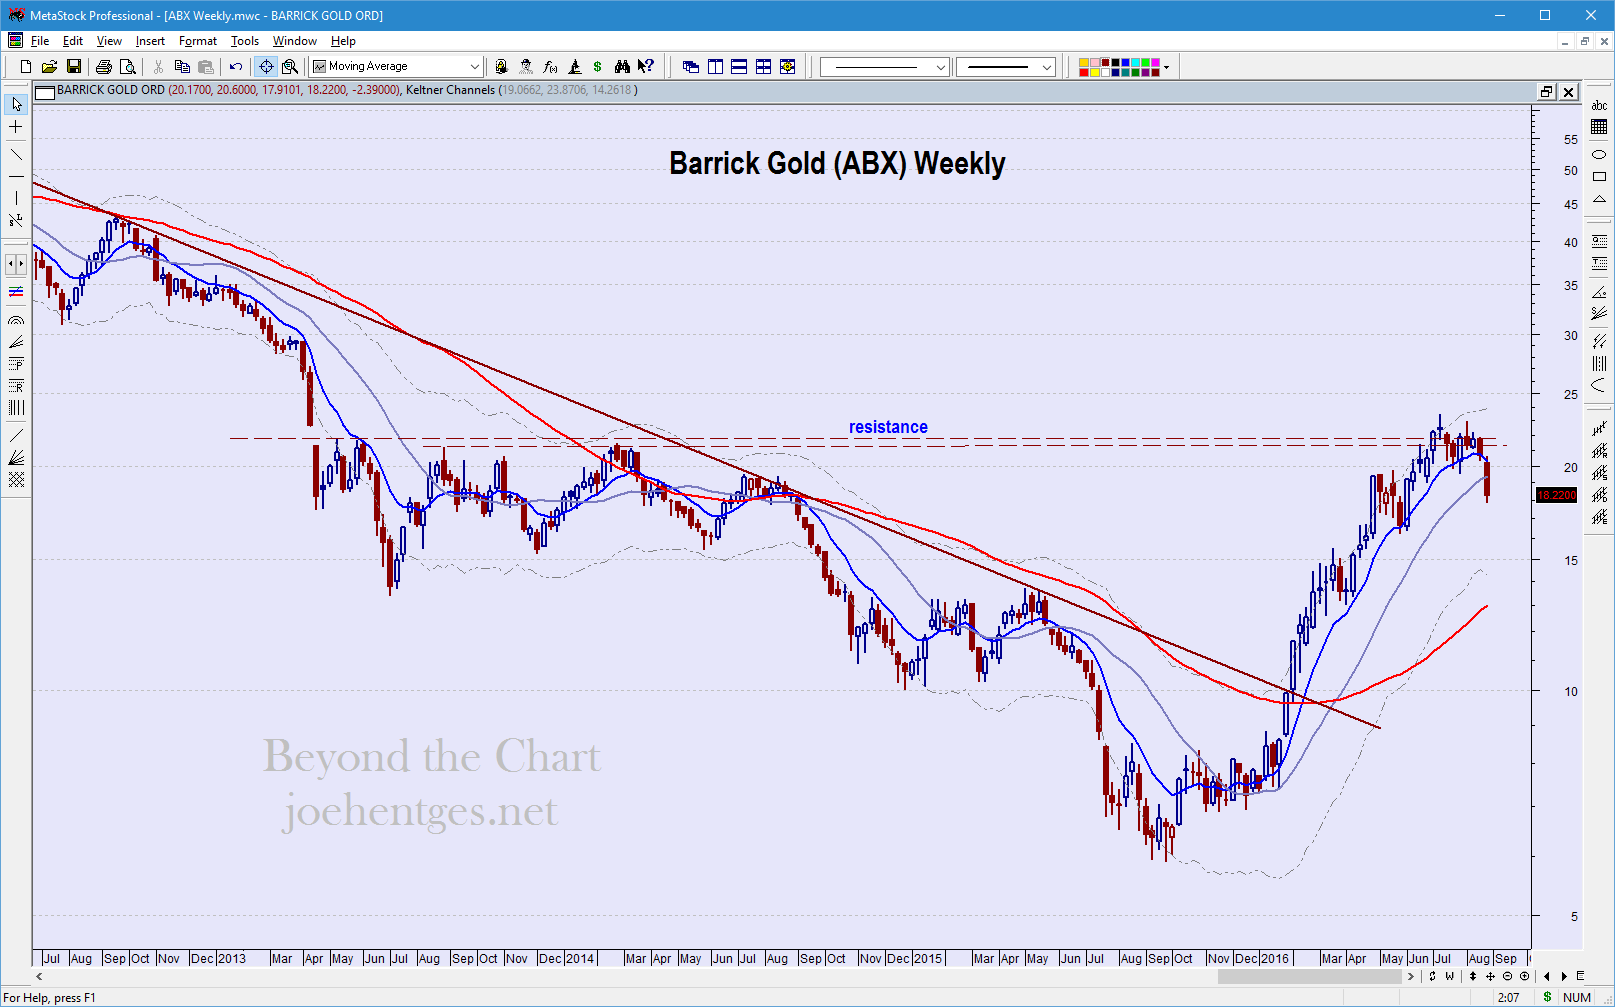
ABX broke a major downtrend line February after bottoming with an intra-week low in September 2015. There is a very good probability that this bottom was a major long-term bottom. It hit major resistance in the 21-22 area and is now pulling back.
Next support level should be 16.25-16.50. A 50% retracement of the September to July rally would be 14.70
Newmont Mining (NEM)
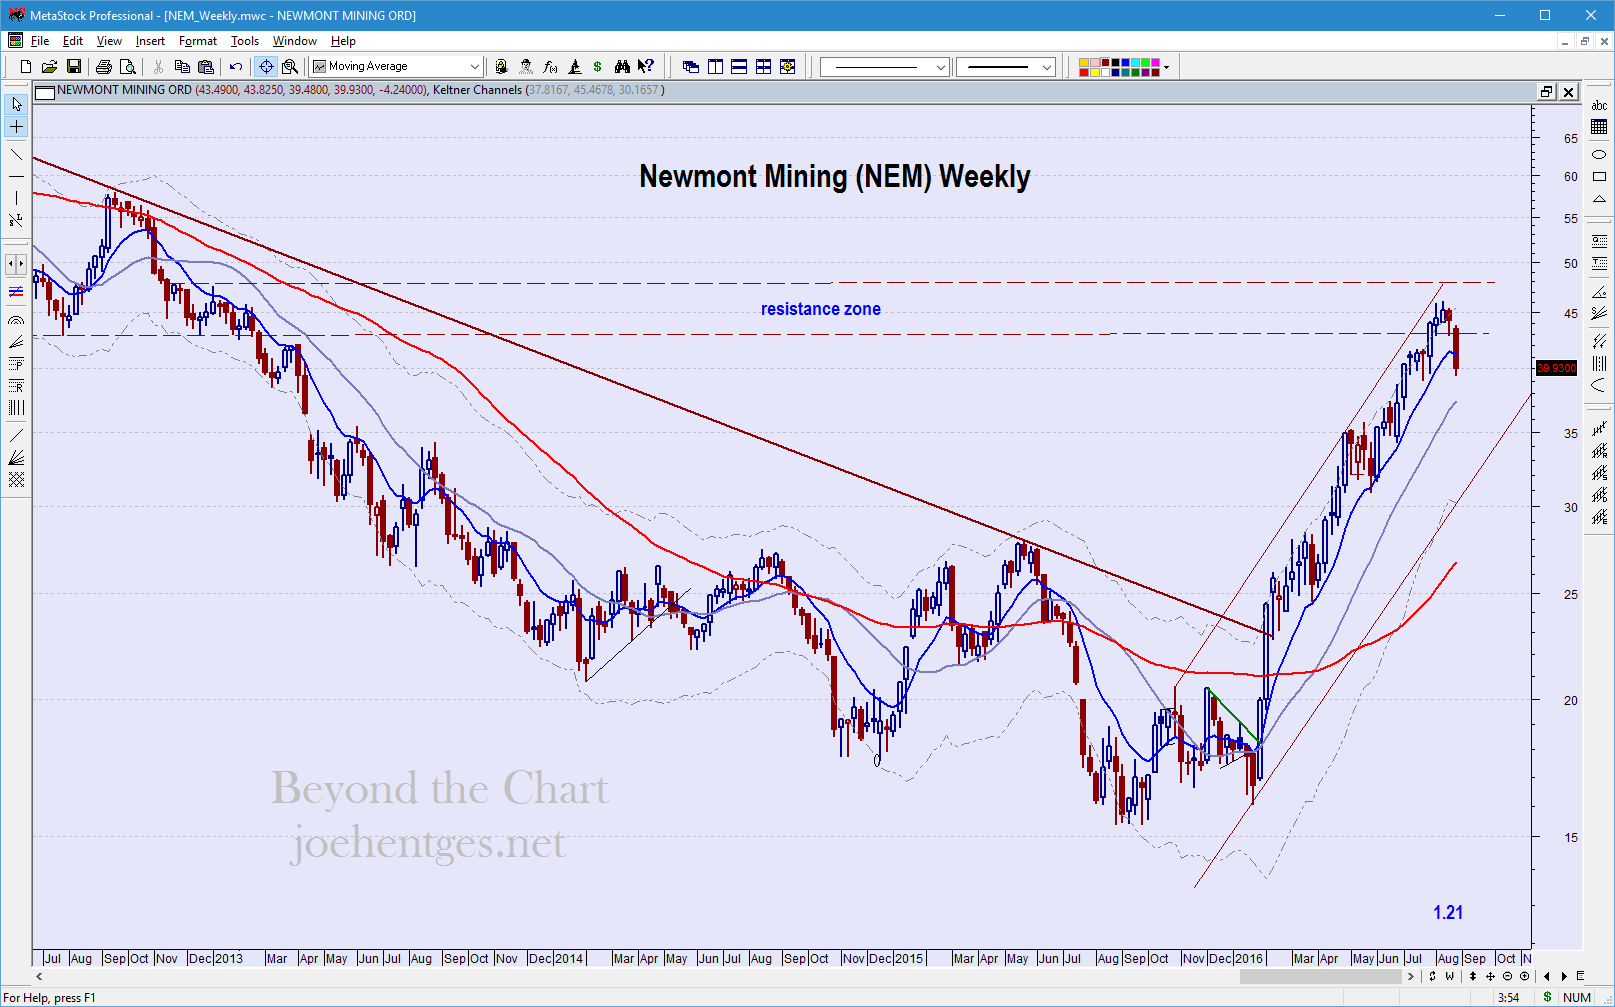
Newmont Mining (NEM) also broke its long-term downtrend in February and bottomed about the same time as ABX. Notice how these gold miners both bottomed before GDX did in December. Its strong 8 month rally hit a resistance zone in late July into August.
I am also looking for this to pull back with all the others, the qeustion is to where? I think it good pull back to 36 and close a gap on the daily chart. A 38.2% retracement of the rally from January would be 34.60 and a 50% at 31. We will be watching the price action closely.
Goldcorp Inc. (GG)
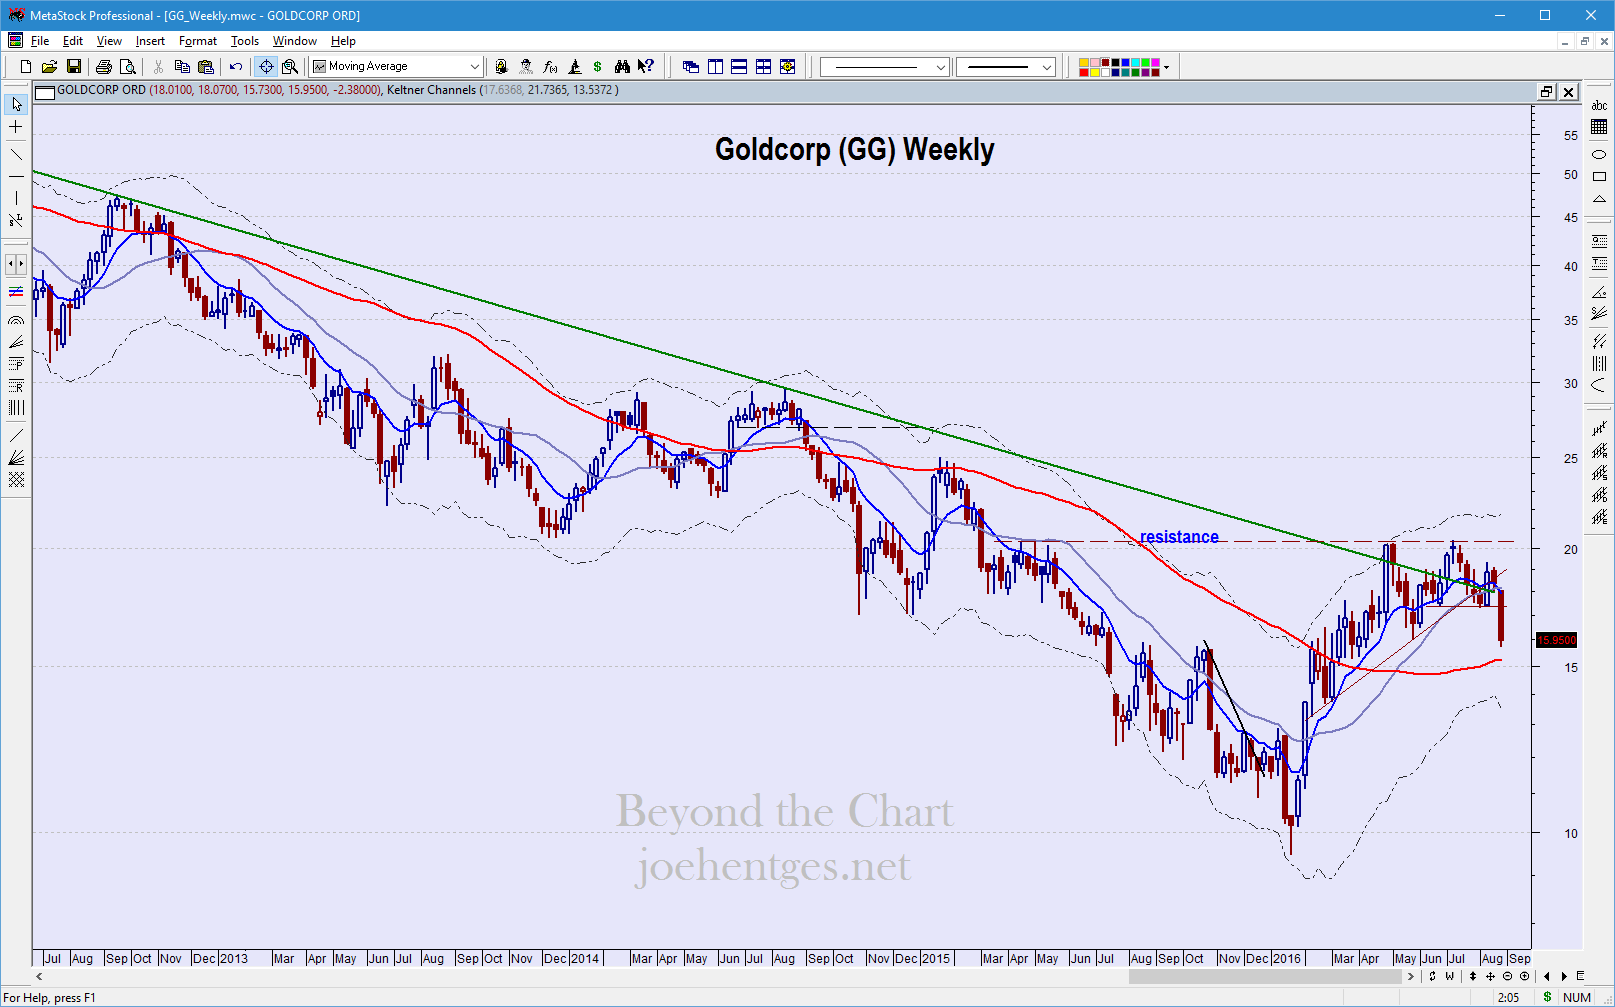
Goldcorp Inc. (GG) is the weakest acting of these three. It did not break it’s long-term downtrend until April 2016 and had no follow-thru. It has been trading back and forth around that trendline and now pulling back.
GG may actually be very close to a support zone right now. A 38.2% retrace of the rally from January is 16.15 and 50% is 14.86.
Next Week
Next week I’ll be focusing on the Financial Select Sector SPDR Fund (XLF).