
This week the Dow Jones Industrial Average (DJIA) and S&P 500 (SPX) experienced their biggest drops in years especially if you look at the lows for the week. But this was not just a sell-off in the United States, there was also a significant global sell-off underway.
In the world’s second largest economy, China, the Shanghai Composite was down big for the second week in a row. It dropped 332.23 points or 9.6% and shattered a 2 year uptrend line.
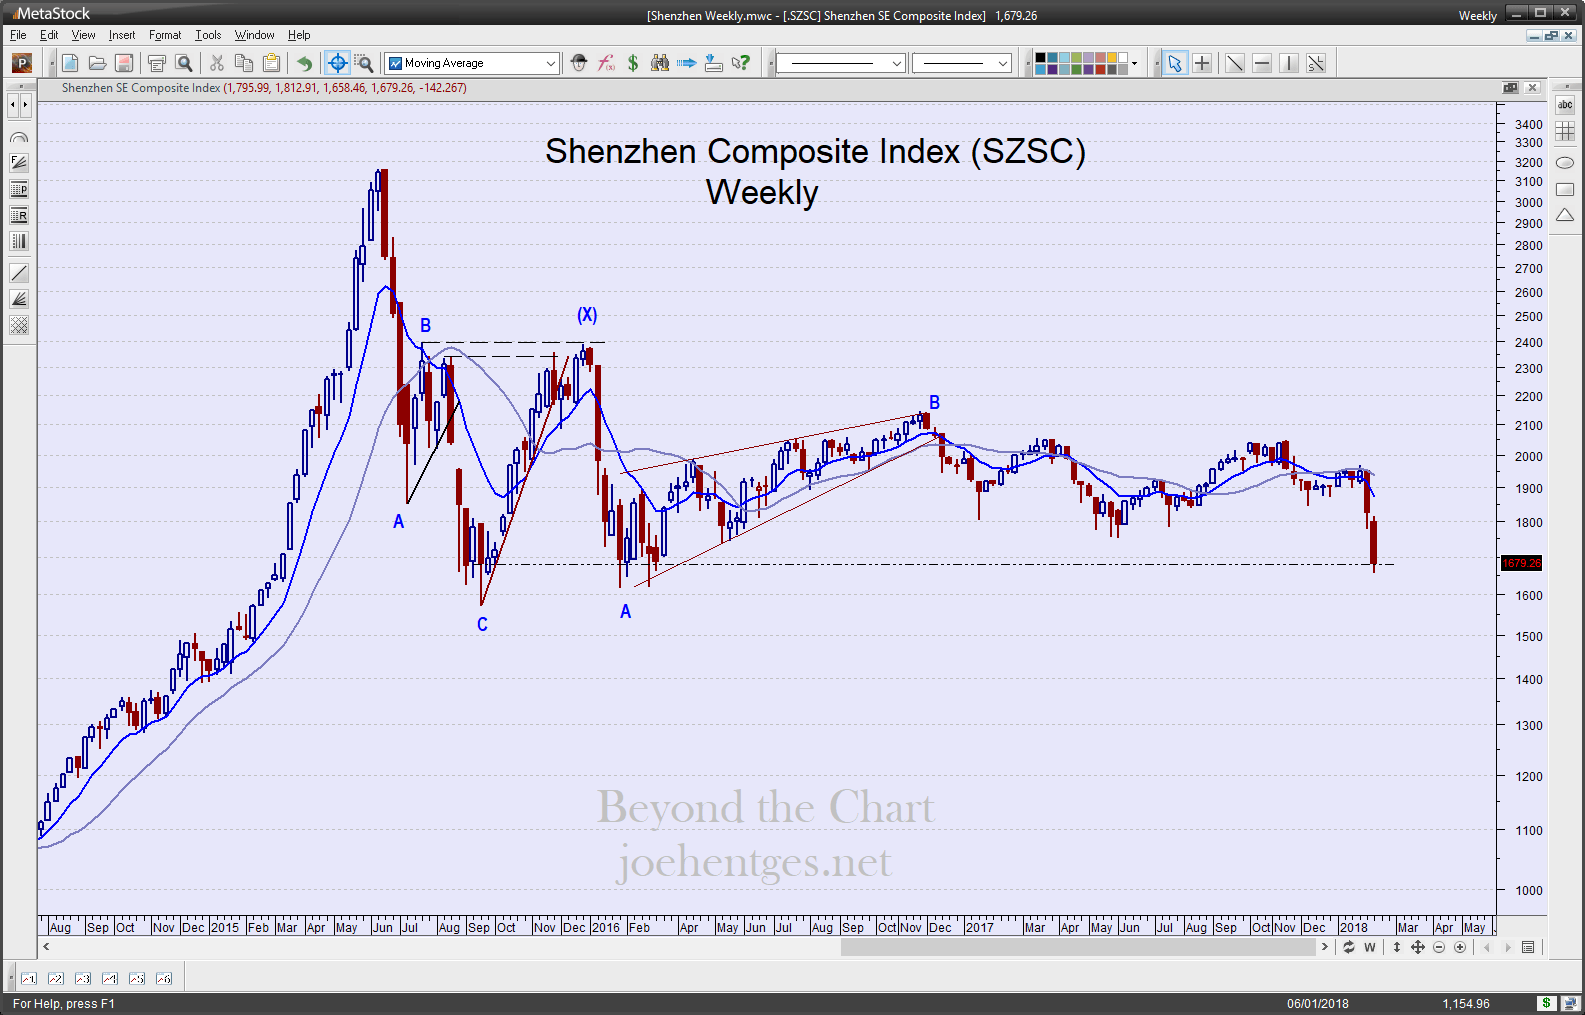
China’s Shenzhen Composite dropped 142.267 or 7.8%. It closed the week at the lowest level since September 18, 2015. Over the last 2 weeks it has dropped 13.9%.
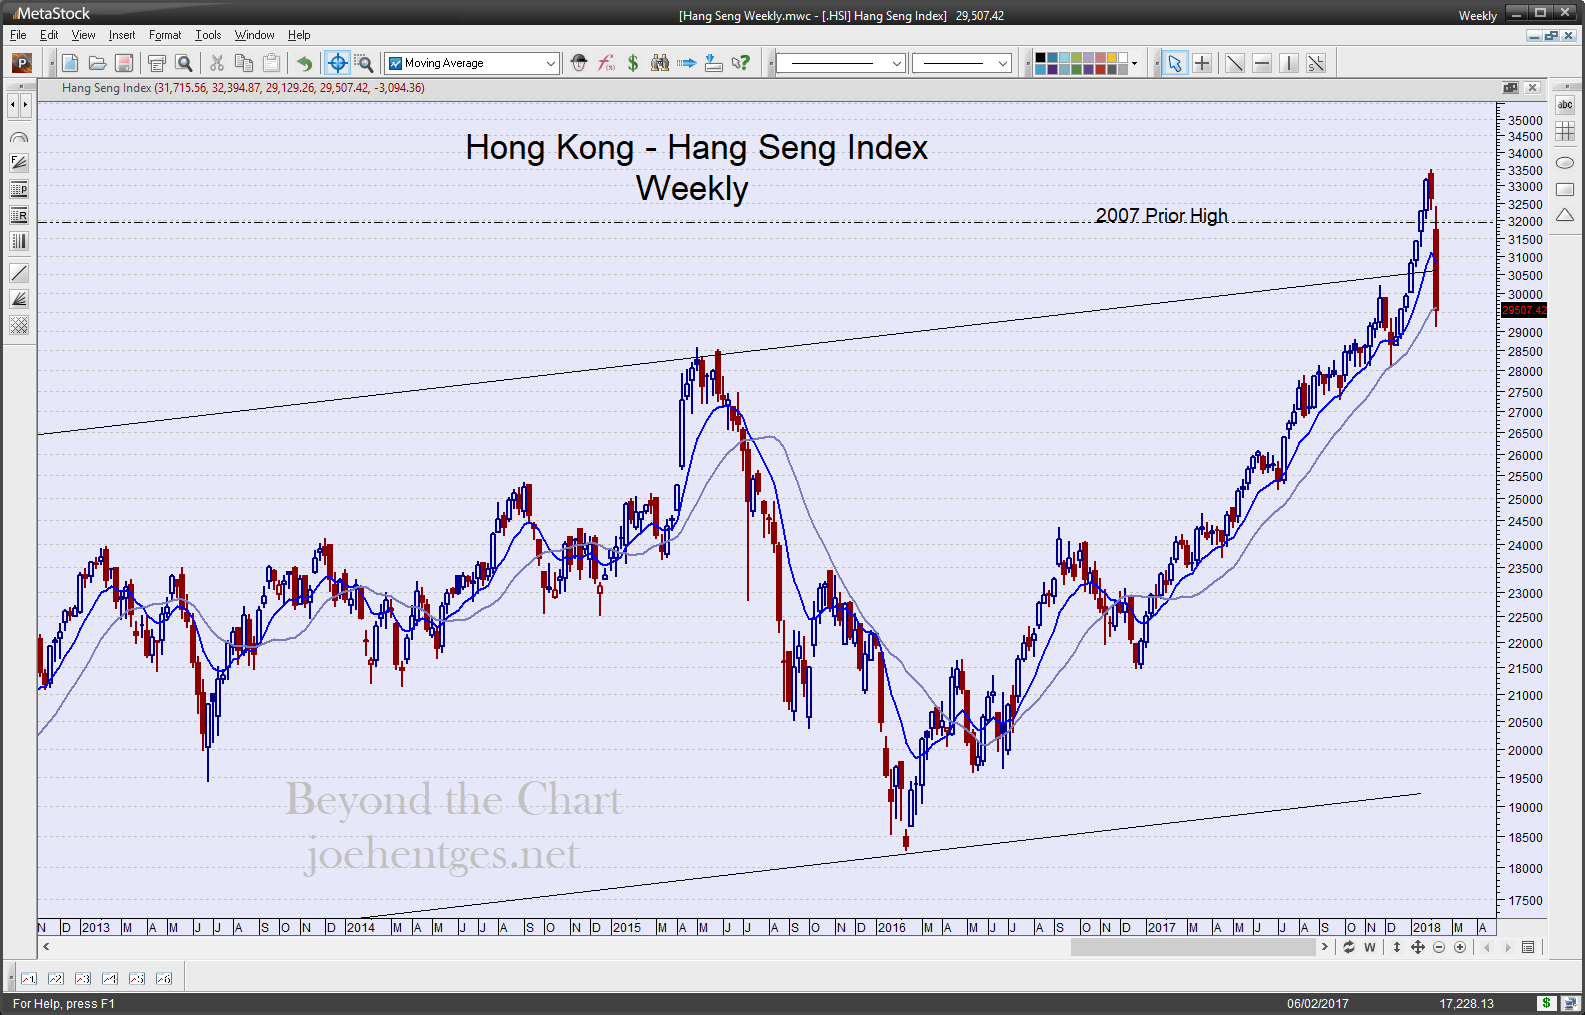
In Hong Kong, the Hang Seng index as been acting much stronger than the mainland indices but it too joined the global sell-off. Look at the chart below, you see it pushed to new all-time highs in the two weeks ending on January 26, in sync with U.S. markets, but then collapsed 11% over the last 2 weeks.
In Japan, the Nikkei 225 Index dropped 1891.91 or 8.1% for the week. The low for the week briefly touched the 2 year trendline.
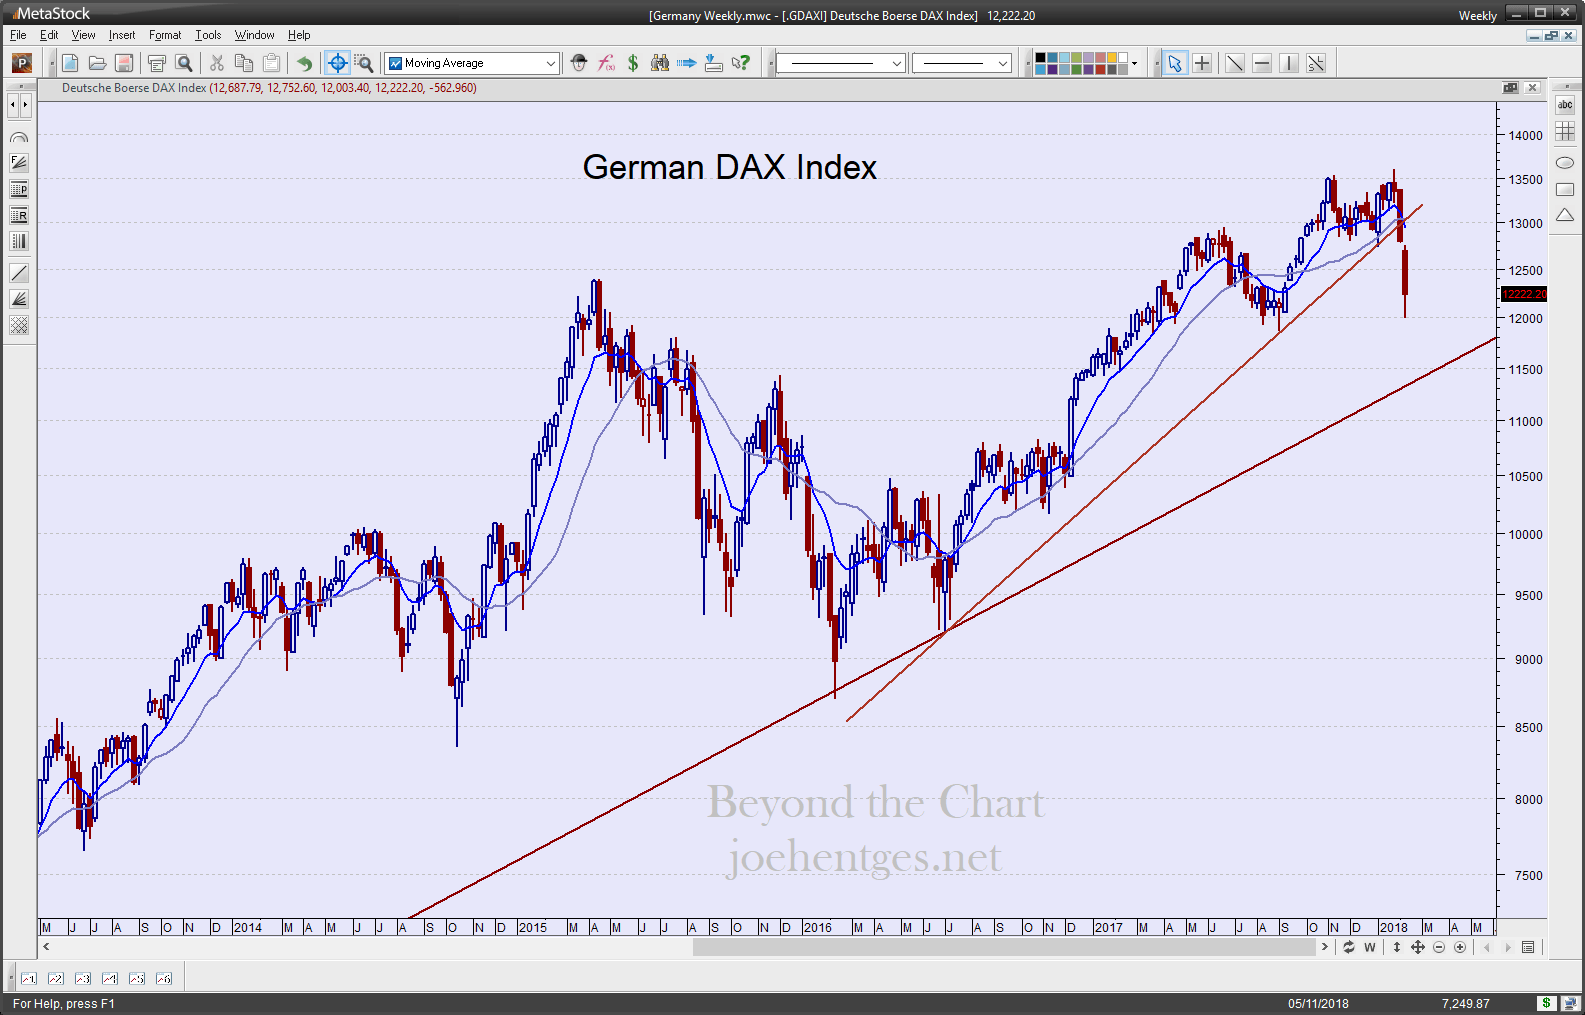
In Europe the German DAX broke its 2 year uptrend line last week and then this week joined the global sell-off in equities. The DAX was down 562.96 points or 4.4% for the week but has dropped 9.0% over the last 3 weeks.
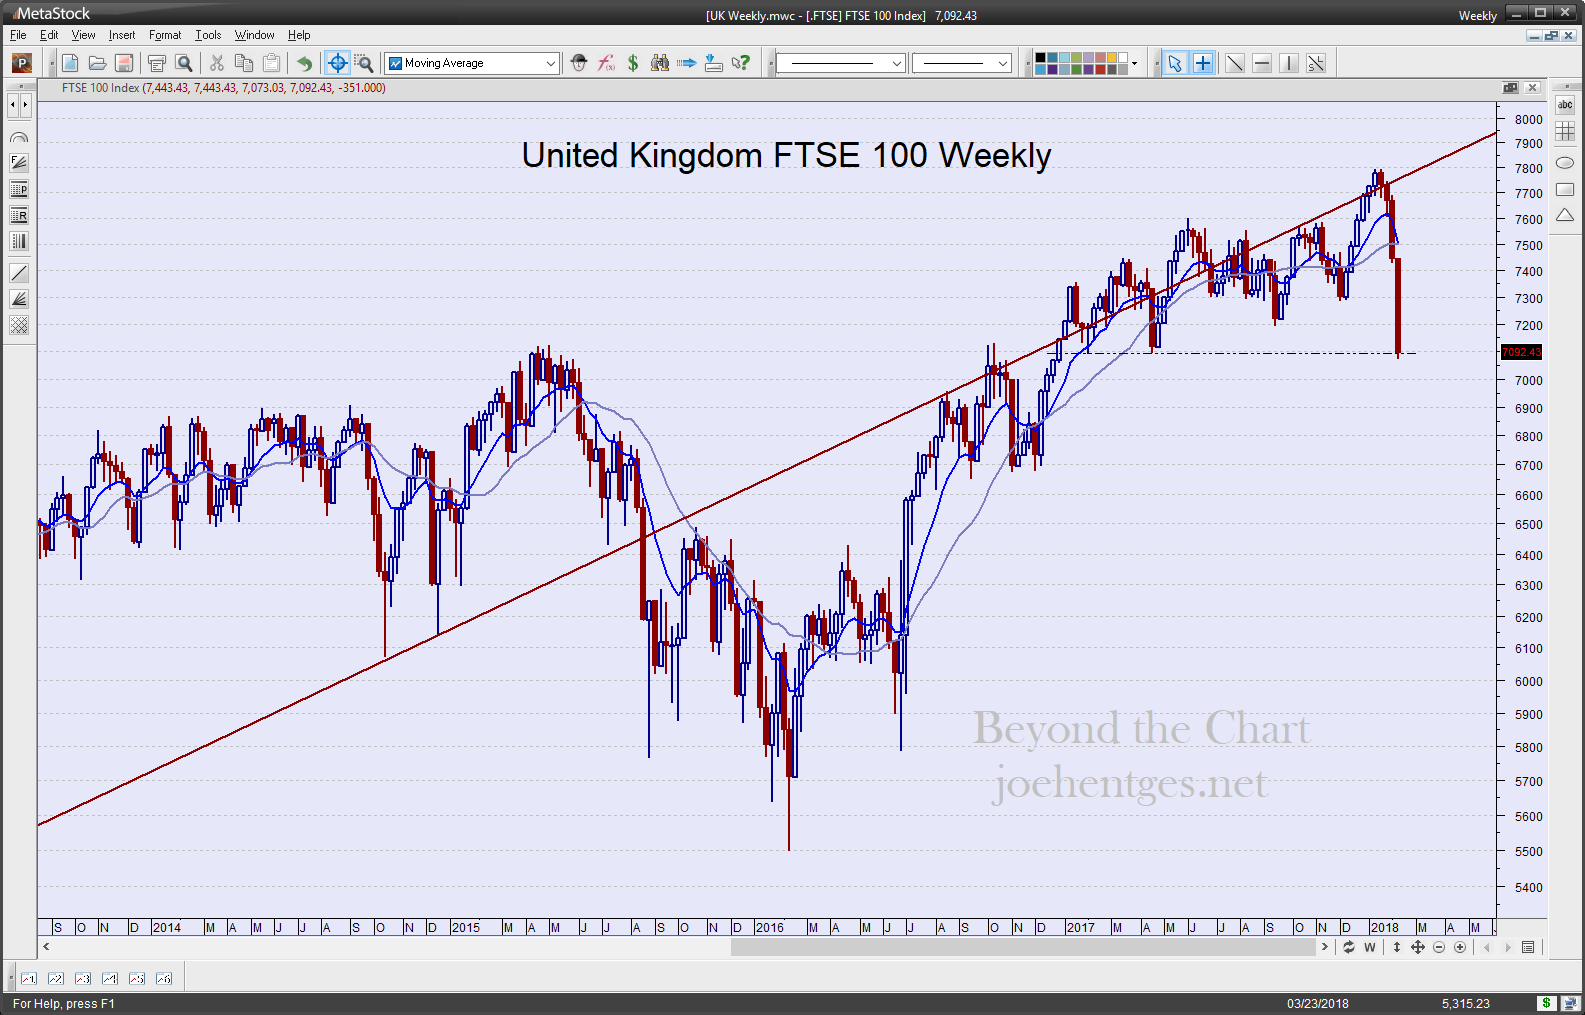
And the United Kingdom joined in also. The FTSE 100 dropped 351 points or 4.7% but has sold off 8.8% since January 12th, closing at its lowest level since December 23, 2016. All of these charts are reviewed in the video below.
Strong Move
I want to put into perspective this selloff from the all-time closing high on January 26. That day was a Friday and the market pushed right into the close, ending on the high for the day and for the week, month, year…maybe decades. We’ll soon see. It was a classic ending to a FOMO buying panic in January.
The selling began the following Monday. The selloff has been so dramatic that people are comparing it to 2015, 2011, 2008 and even charts of 1987 are popping up. But the charts they are showing have dramatic sell-off in the 2nd or 3rd move down, not the first move.
So looking at the closing price for the DJIA for trading after just 9 days down from an all-time high. How does this 2018 move compare? Here is what I found:
January 26, 2018: -10.4%
October 9, 2007: -4.3%
January 14, 2000: -8.4%
August 25, 1987: -6.5%
September 3, 1929: -3.4%
So this move down is one of the strongest in history. The magnitude and intensity of this move was breathtaking but we haven’t seen anything yet. We got a bounce on Friday…we’ll see how much of a retracement we get.
Volatility is back. Tighten your seat belts. Get all the details and daily information you need to trade and protect your investments. Become an Insider Member.
https://jfhentges.wistia.com/medias/b253uzumtz?embedType=async&videoFoam=true&videoWidth=640