
We are currently seeing extreme divergence in the stock market between the Dow Jones Industrial Average (DJIA) and the Nasdaq Composite Index (Nasdaq). The last two major peaks in the stock market also showed divergence between these two indexes. Both times, as in 2018, the DJIA peaked first, followed by the Nasdaq.
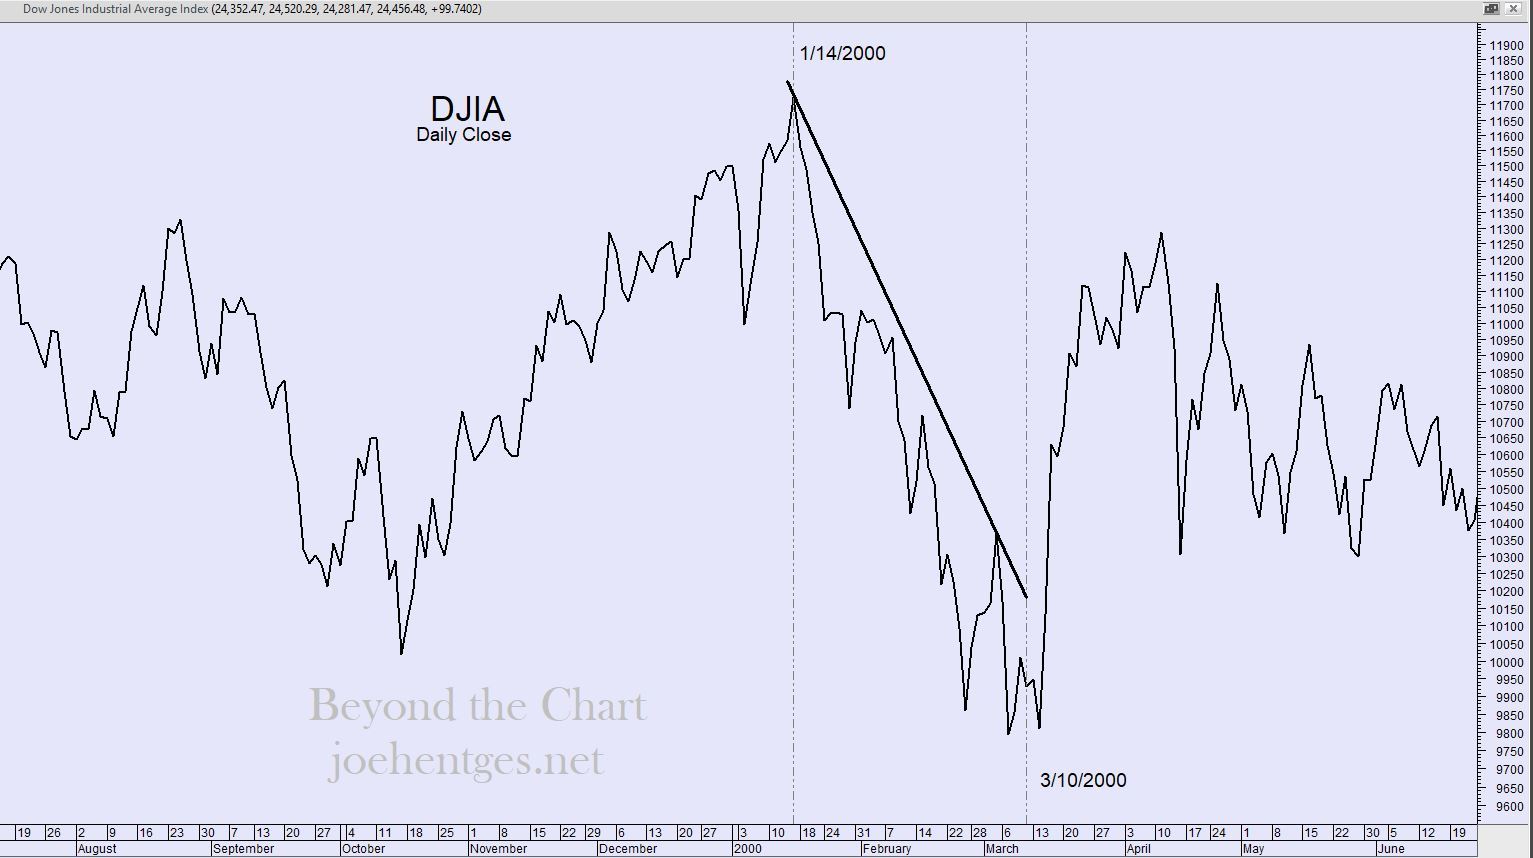
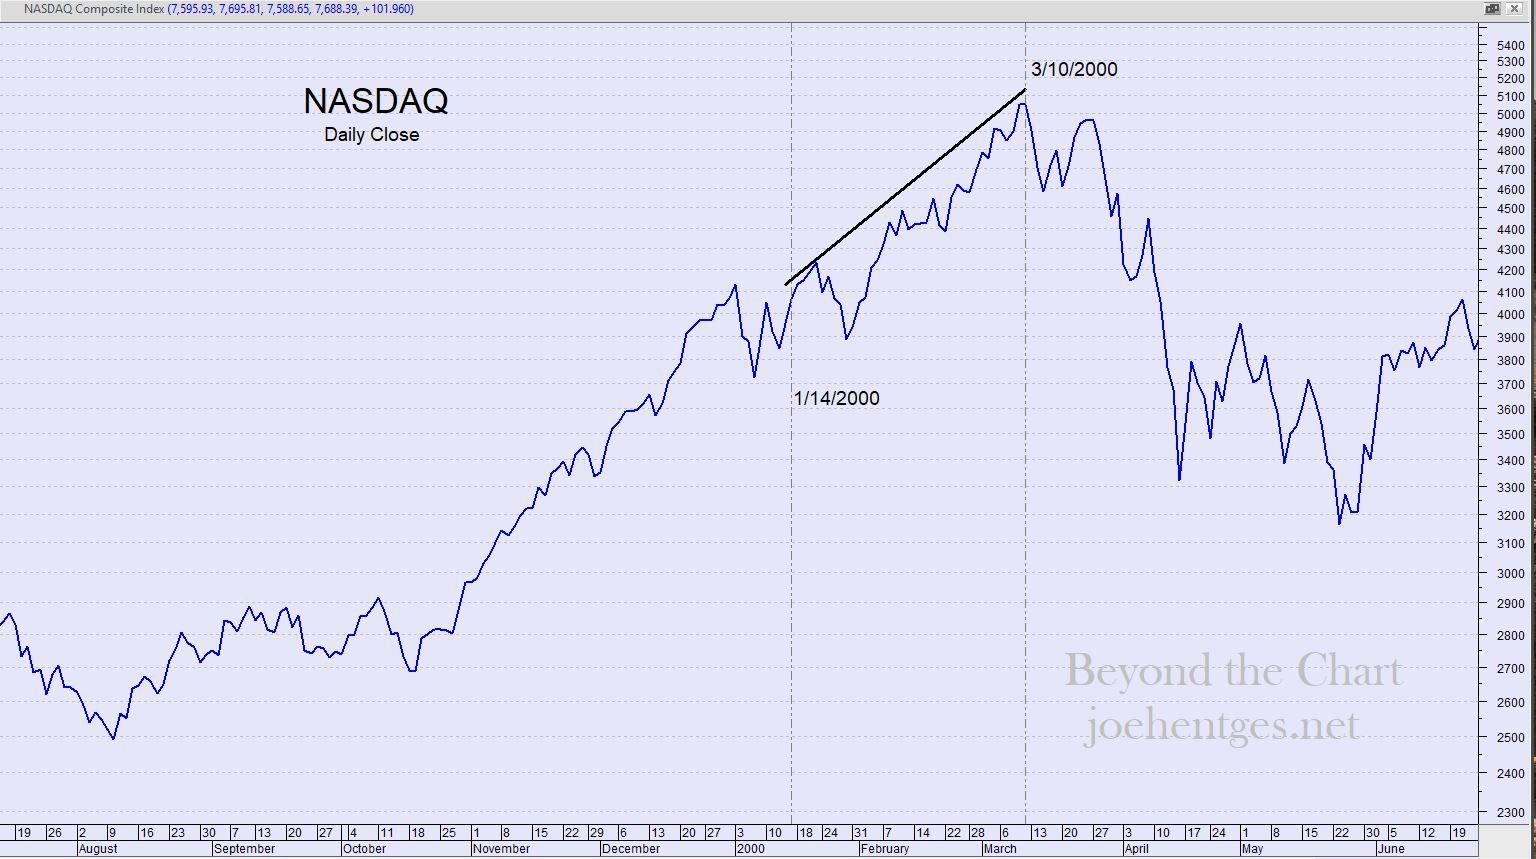
The other two peaks were the top of Primary Wave 3, of Cycle Wave V, in 2000 and the top of Wave B, of Primary Wave 4, of Cycle Wave V in 2007. First let’s look at year 2000. Look at the two charts below. The DJIA peaked on January 14, 2000. This was followed by the Nasdaq on March 10, 2000, 8 weeks later.
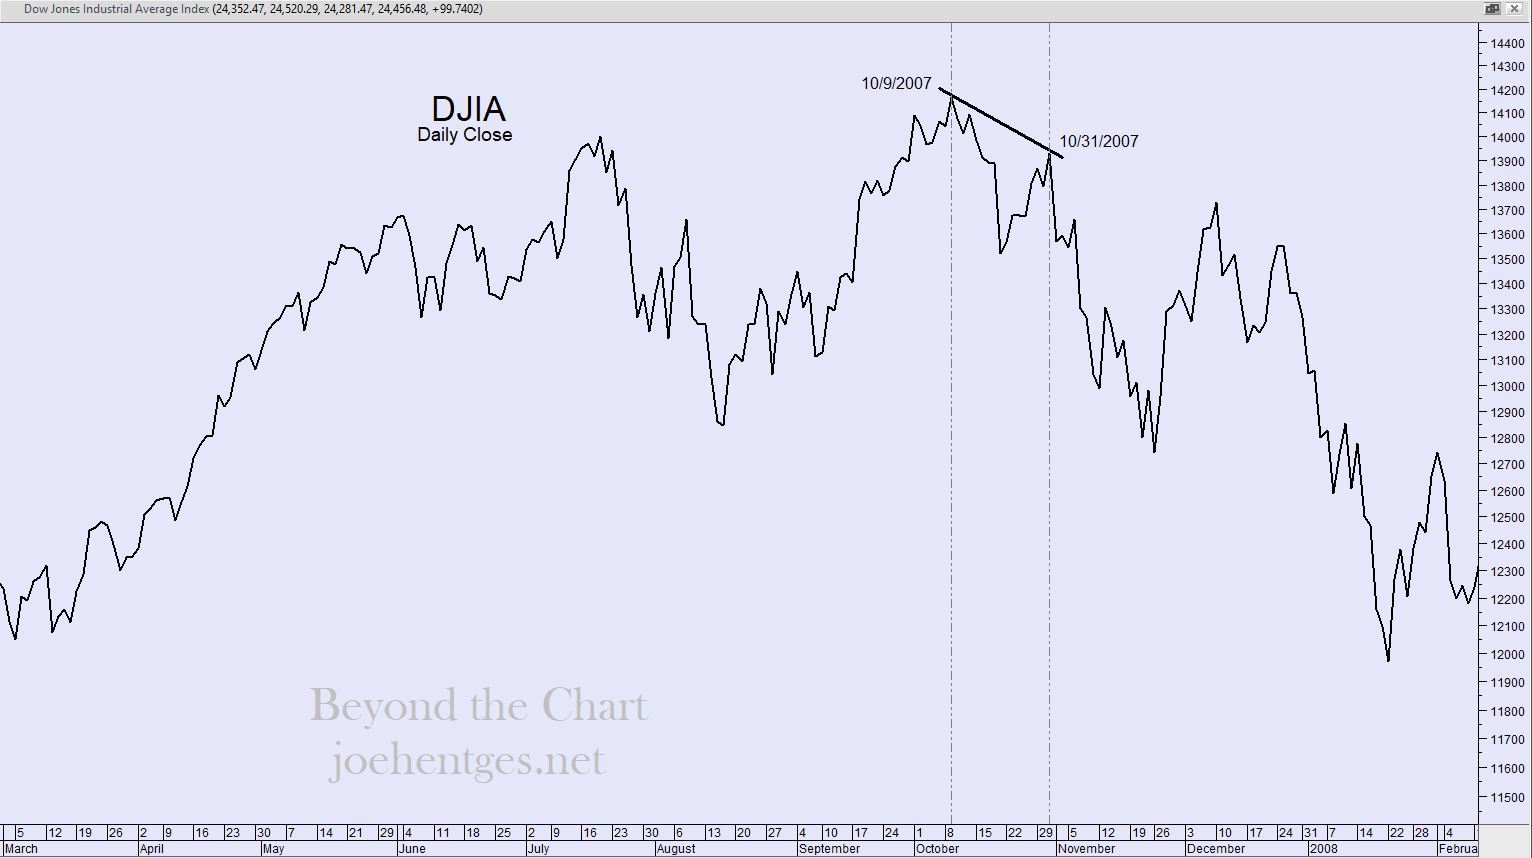
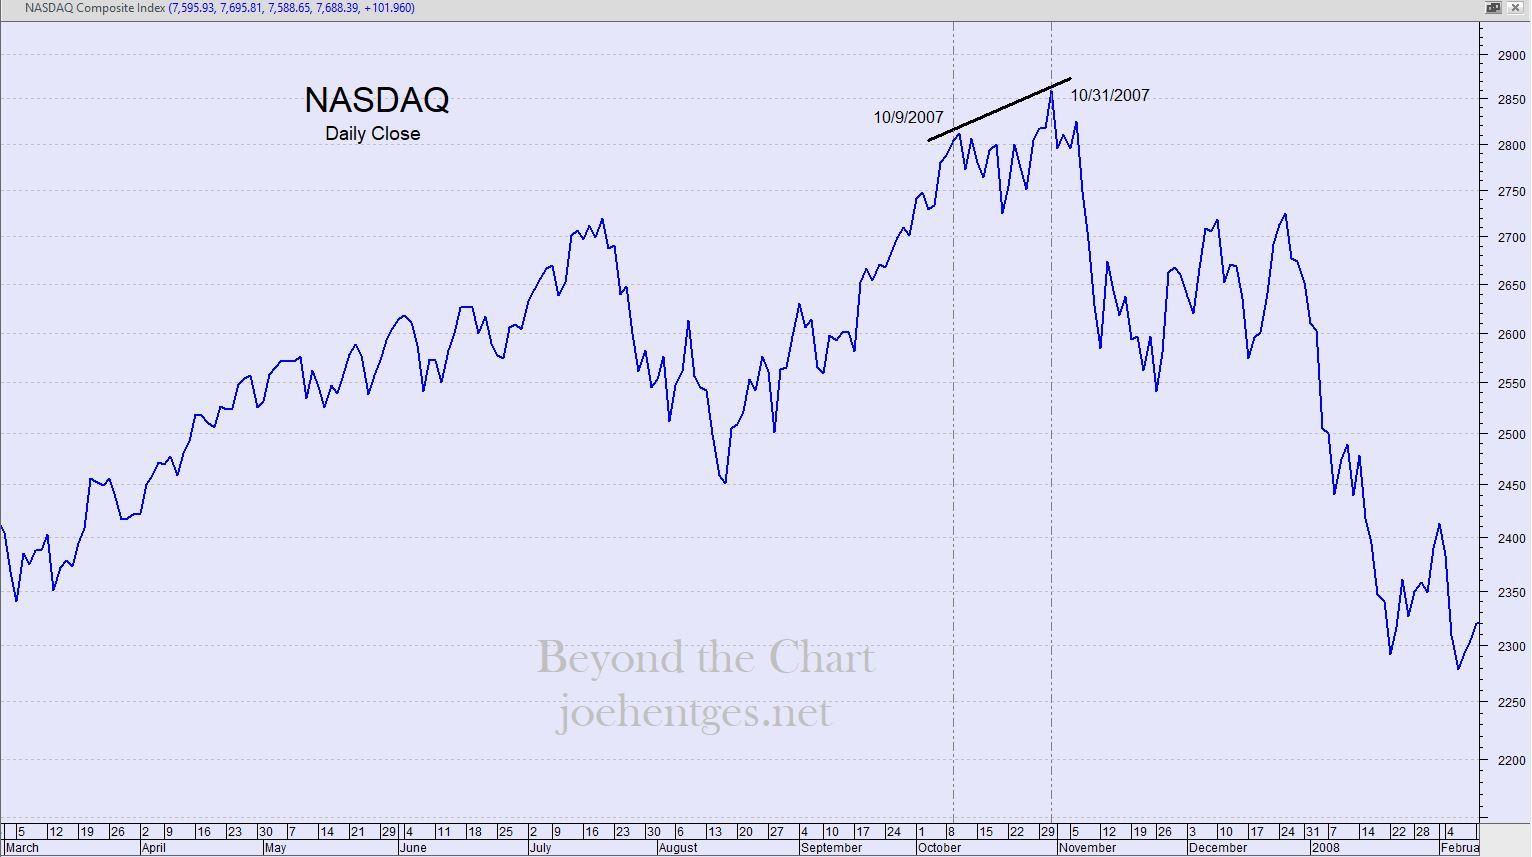
Now look at the two charts for the top in 2007. The DJIA peaked on October 9, 2007 followed by the Nasdaq peaking on October 31, about 3 weeks later. Now this top was not the top of a Primary Wave, as was the top in 2000. So that may be the reason for the lack of extreme divergence in the market at that time.
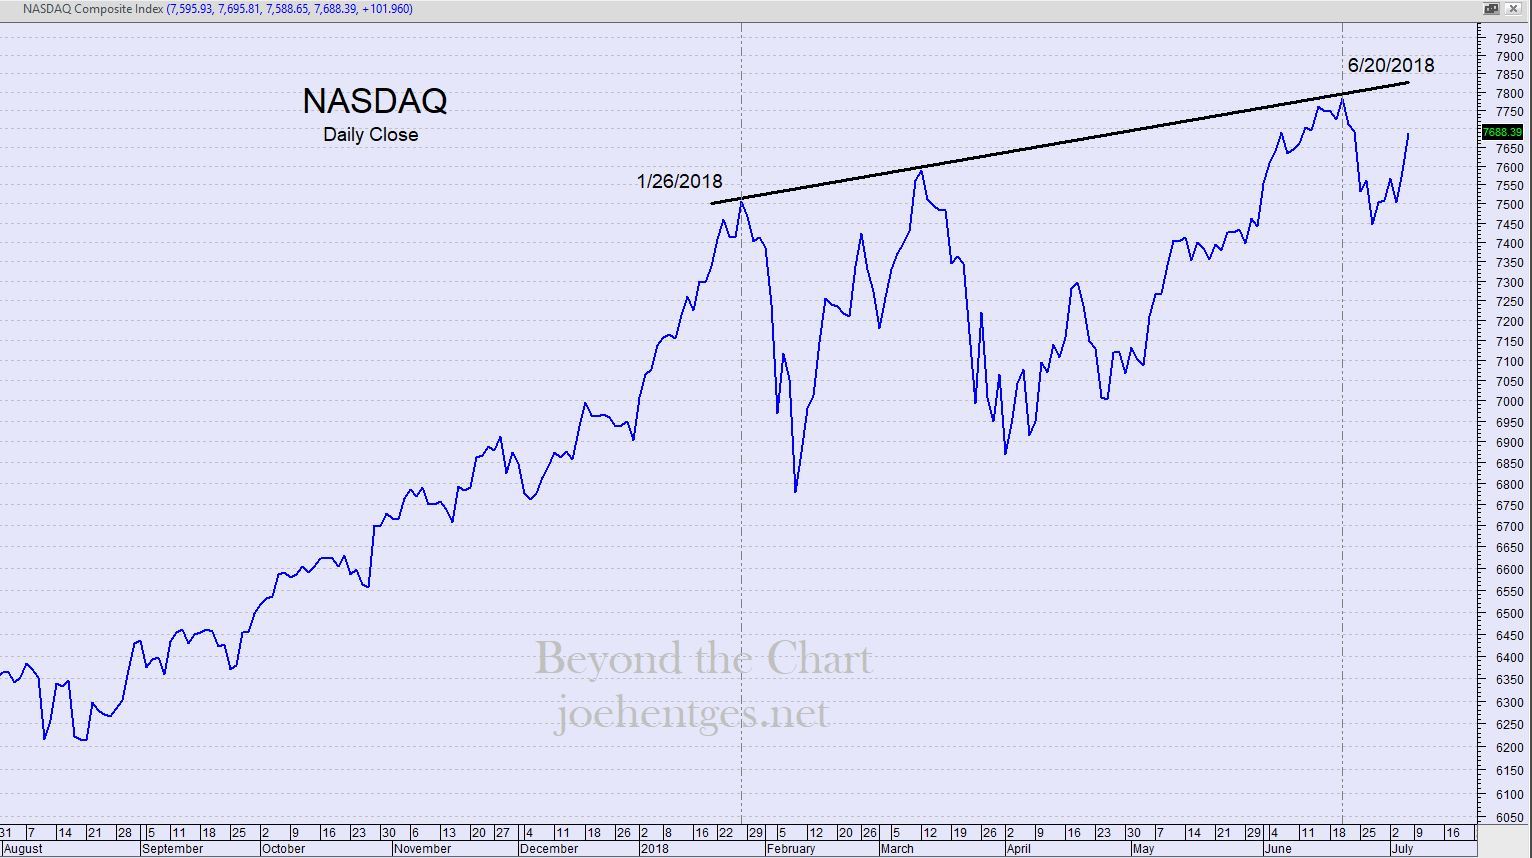
Now look at the two charts for our current market environment. Both the DJIA and the Nasdaq peaked on January 26, 2018. But then the DJIA sold off and stayed weak, while the Nasdaq went on to push to a higher high, showing a peak on June 20, 2018. The time between peaks stands at nearly 21 weeks. This is nearly 13 weeks longer than the divergence at the top in 2000.

This extreme divergence at the 2018 top is a result of the fact that bullish enthusiasm is so strong at the end of Primary Wave 5 (9 years) of Cycle Wave V (36 years) of Supercycle Wave (V) (86 years). The next few weeks will tell whether this picture will continue to hold.
No one knows the future but right now the stock market is signaling there is a major disconnect occurring.