
Every week I look at one of Tom McClellan’s charts that he publishes. Tom is the editor at McClellan Financial Publications. Every once in a while I find a chart that really resonates with me.
Below is a chart that shows the price of crude oil as compared to the Dow Jones Industrial Average (DJIA). What Tom has done is moved forward the chart of crude oil by ten years.
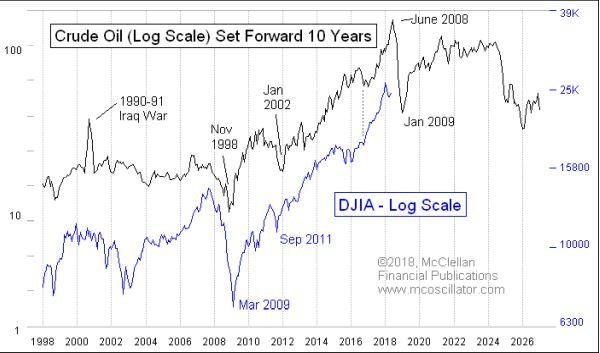
Over the history of the DJIA, crude oil has been shown to be a very good leading indicator of the DJIA by about 10 years.
Ten years ago crude oil went from over $140 a barrel to under $40 a barrel in about 7 months. This has huge implications for the DJIA in 2018 and is in sync with my view of the market via Elliott Waves.
Rather than go into all the detail that Tom provides in his article, I recommend that you read it.