 I’ve talked about the Baltic Dry Index many times before. This index is created by the London Baltic Exchange and tracks shipping rates around the globe. They call it a dry index because it measures the shipment of dry goods that are primarily considered raw material to either the production process or to products themselves.
Things like coal, iron ore, steel and cement. Material that drives the world’s economic engines.
Baltic Dry Index Plunges
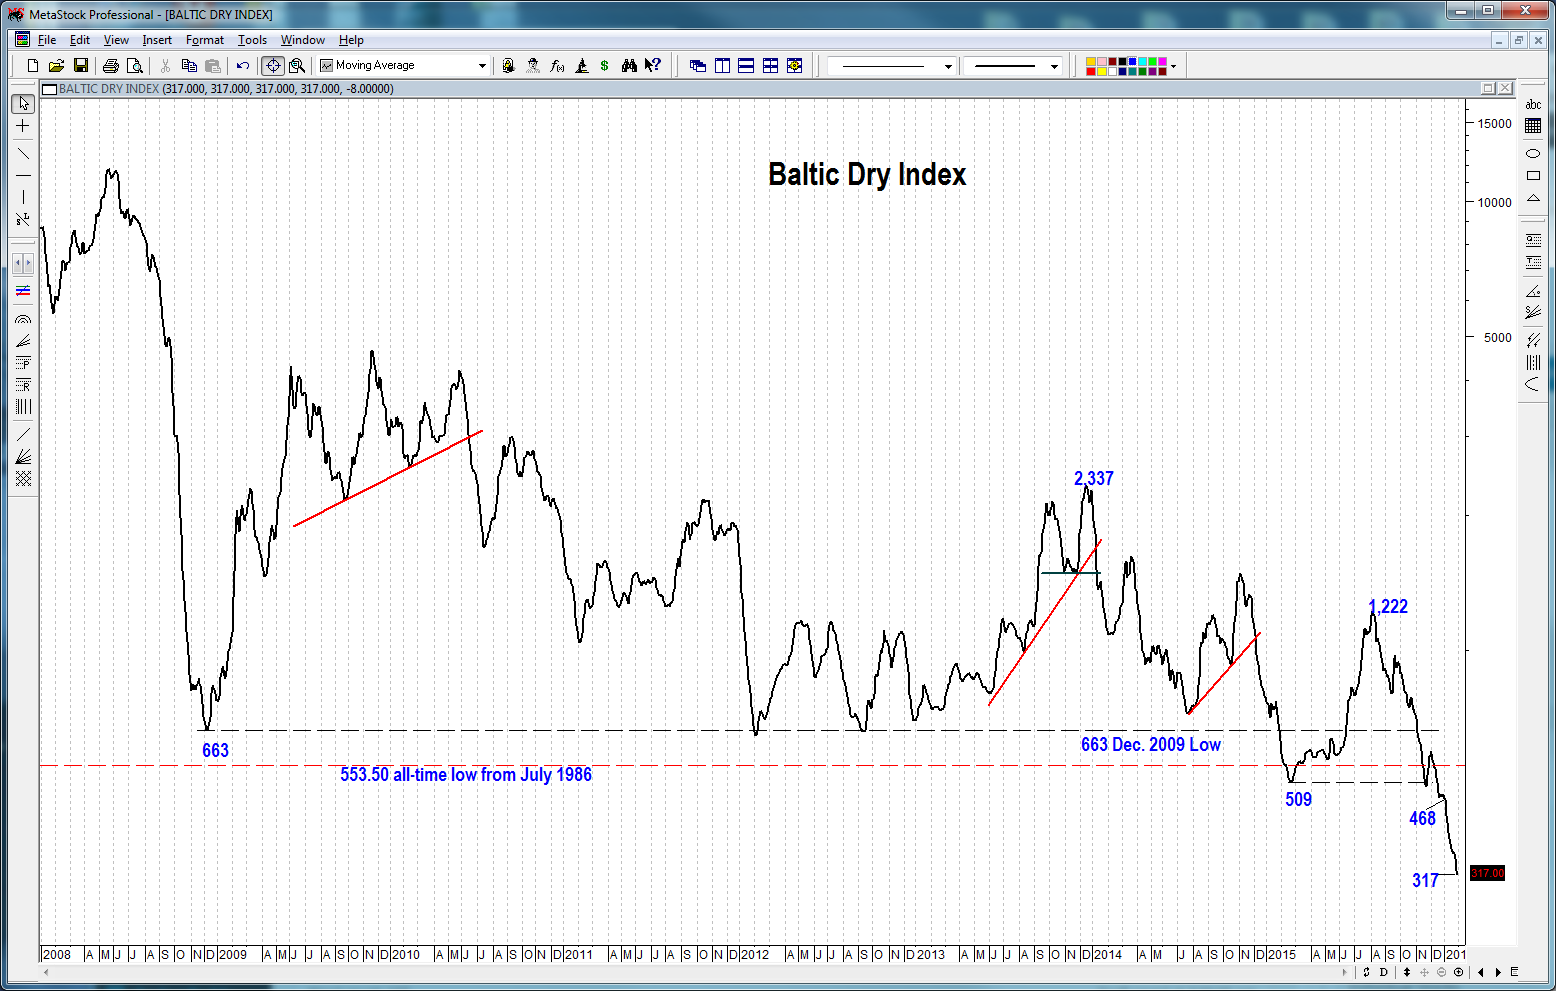
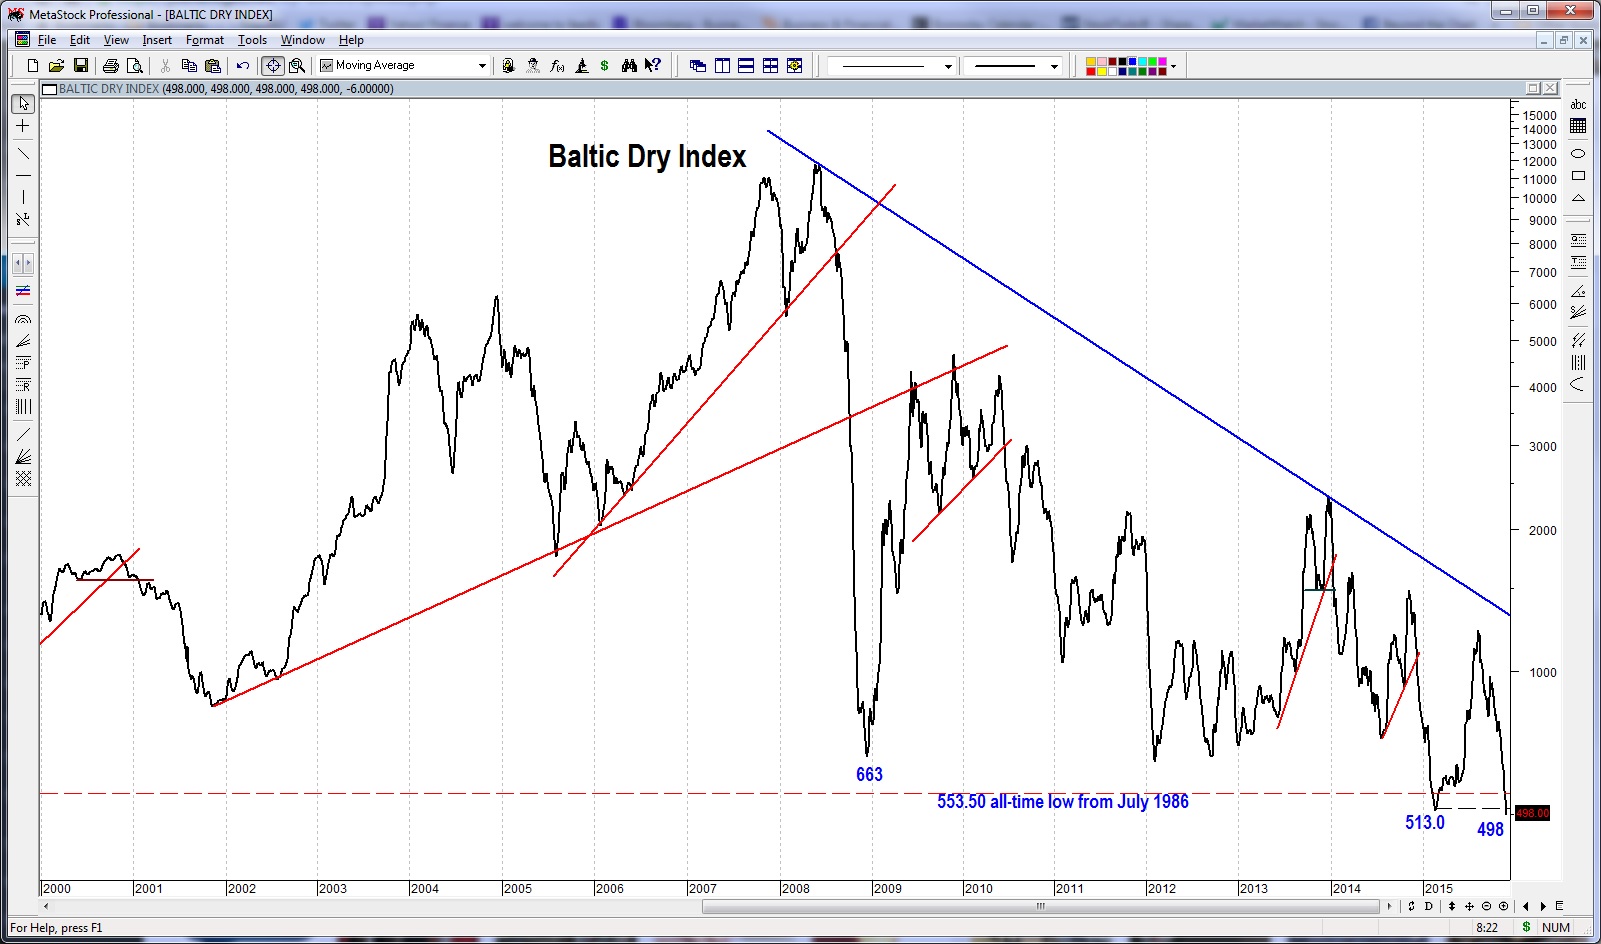
The chart below shows that the Baltic Dry Index has just plunged to a new all-time low. In February it first broke to a new all-time low below the July 1986 level. But Friday the Baltic Dry Index fell even further to 498.
Leading Indicator
The Baltic Dry Index is seen as a leading economic indicator as it is clearly a reflection of the movement of the raw materials that drive economic expansion. Now the skeptics will say hold on here, the supply of ships also affects the price. And yes indeed it does.
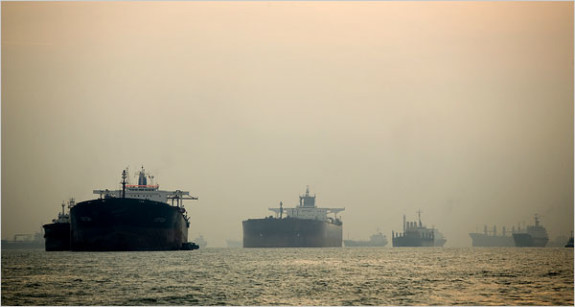
And as the Baltic Dry Index rose to a record high in 2008, I can imagine the number of ships being built was increasing as they assume demand would go to the heavens. The experts are also quick to say that it takes about 2 years to build a new ship.
New Ship Construction
According to data attributed to IHS Global Limited, the orders for new dry bulk ships peaked around the end of 2008 and the peak in new ship construction occurred around spring of 2012…almost 4 years ago.
Yet the Baltic Dry Index has continued bouncing back forth drifting lower. And in February 2015 it plunged to an all-time low. This was followed by a bounce and new hope.
China Actions Speak Louder
But now a plunge since the end of July has resulted in a new all-time low of 498 on Friday. I find it very interesting the recent plunge began about the time that China started devaluing its currency. The first devaluation occurred on August 11 and was the largest single drop in 20 years. Actions speak louder than words.
But no worries, the experts say it’s all because of a glut of ships.