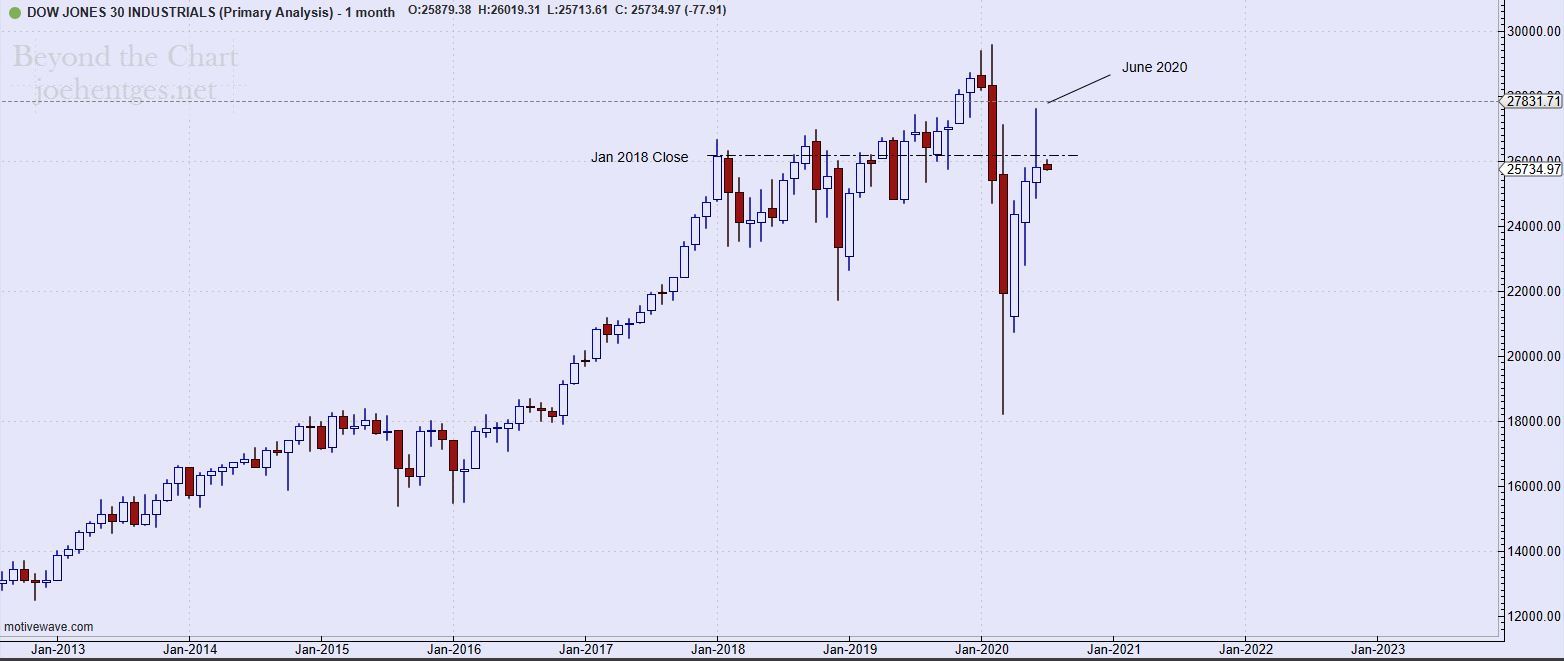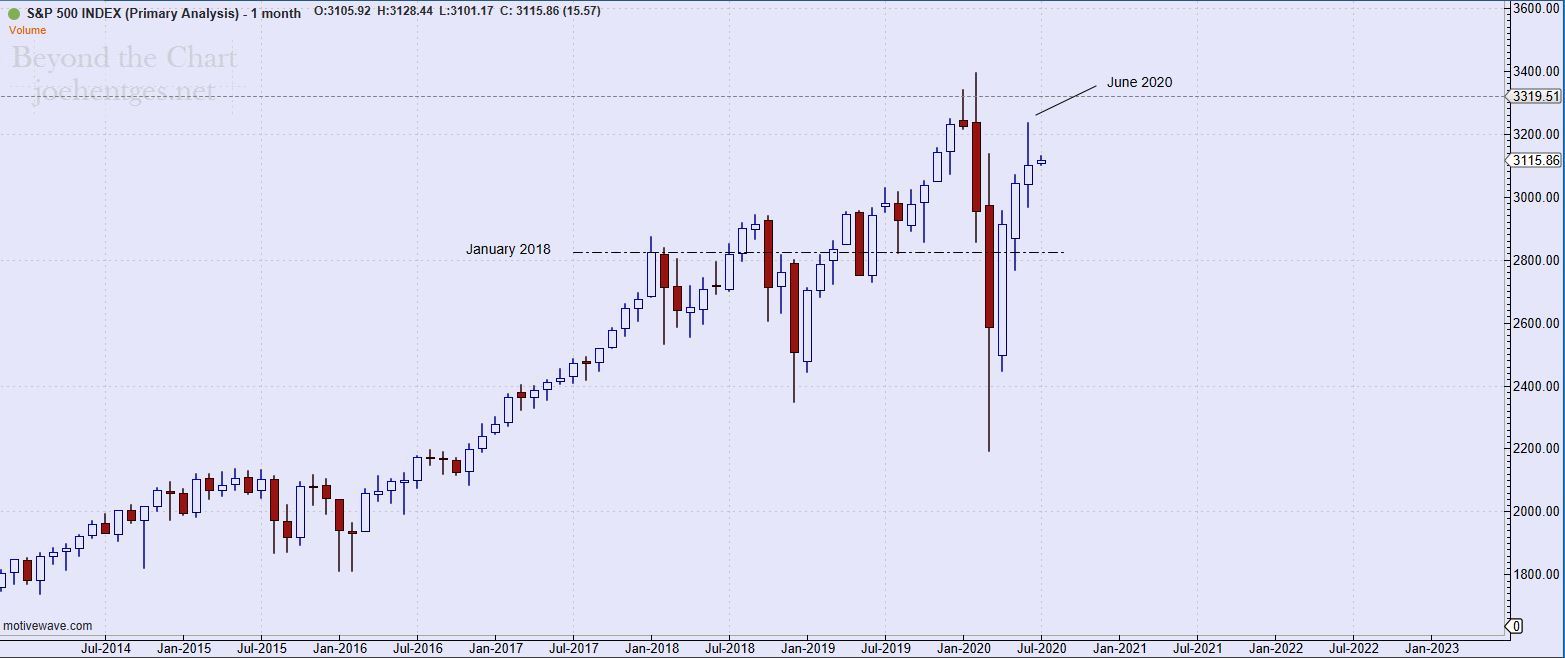
We just completed market action for the month of June and I want to provide some perspective on the three major indexes. These are monthly charts and the key level I'm highlighting is the January 2018 close.
That month was the peak of huge momentum for the markets. Since then the major indexes have been oscillating back and forth in huge gyrations. The first chart shows the Dow Jones Industrial Average (DJIA). The DJIA close June lower than the close for January 2018. Bears are winning.
The second chart is the S & P 500 Index (SPX). It is fascinating to see that the January 2018 close resides right in the middle of all the price action since then. Bulls vs Bears is a draw at this point, with an edge to the Bulls due to higher close.
The third chart is the Nasdaq Composite Index (COMPQ). This one has some huge oscillations also but with an upward slant to it. There is a bit of frenzy/bubble going on here, similar to the 2000 bubble. So far COMPQ is the only one of the three to push above the February 2020 highs. Bulls are clearly winning this battle...but for how long?


