Tag Archives for " Shenzhen Composite "

global sell-off

Global Sell-off in Stocks as Volatility Explodes

This week the Dow Jones Industrial Average (DJIA) and S&P 500 (SPX) experienced their biggest drops in years especially if you look at the lows for the week.  But this was not just a sell-off in the United States, there was also a significant global sell-off underway.

In the world’s second largest economy, China, the Shanghai Composite was down big for the second week in a row. It dropped 332.23 points or 9.6% and shattered a 2 year uptrend line.

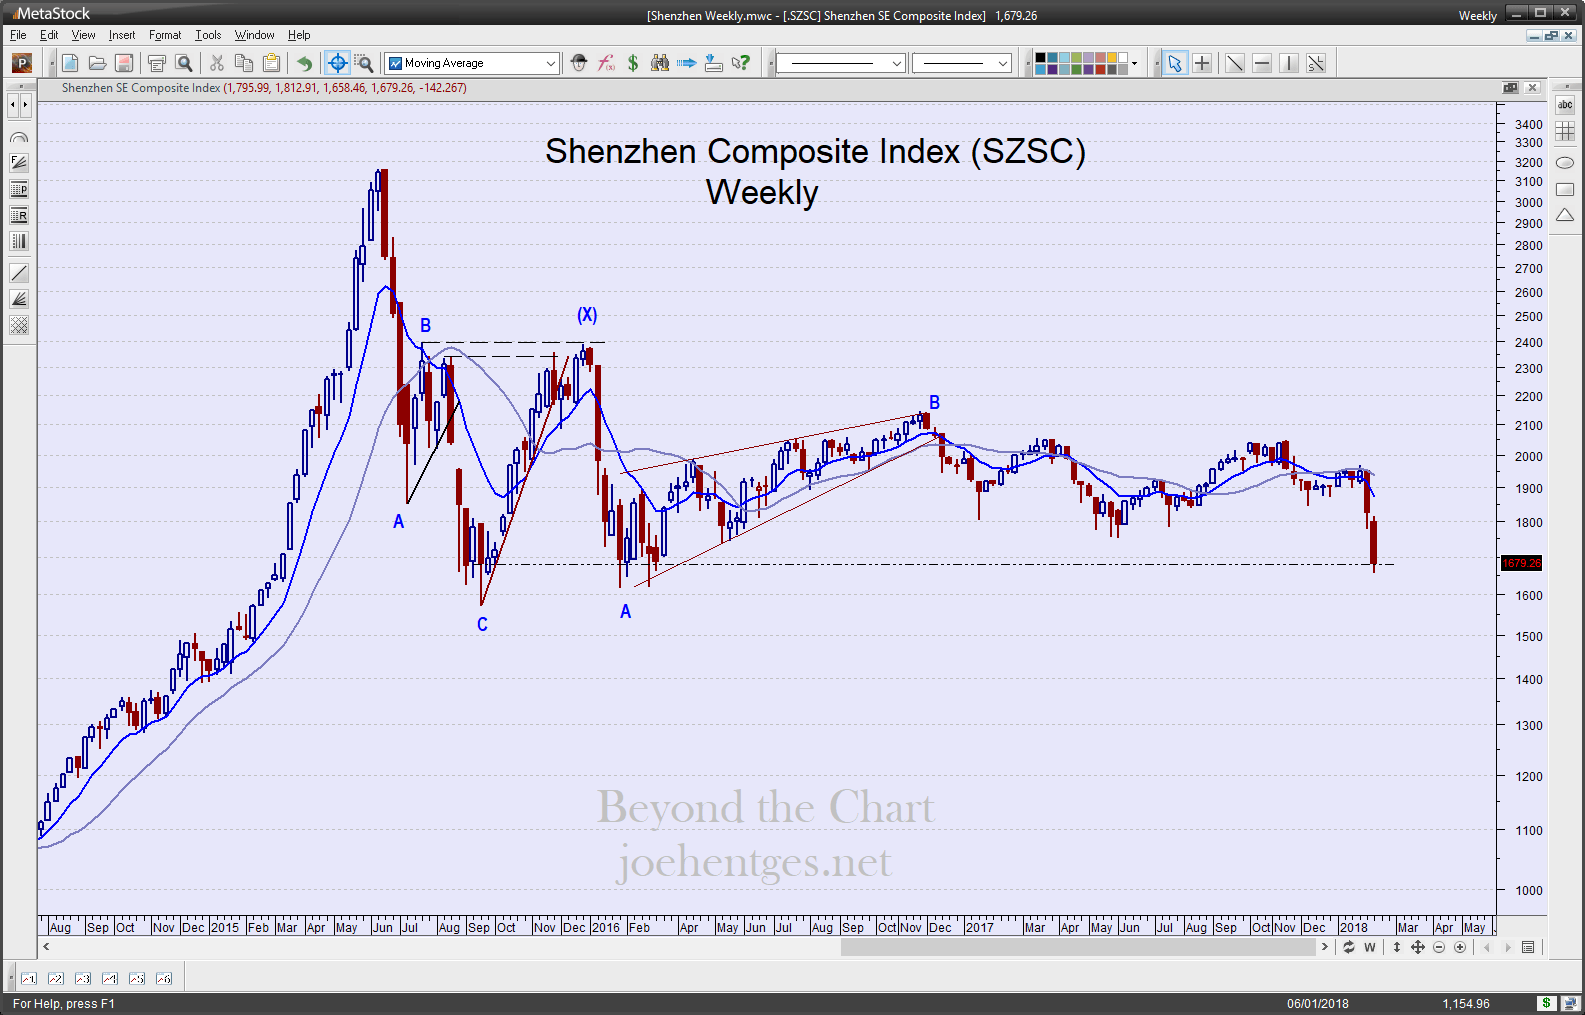
China’s Shenzhen Composite dropped 142.267 or 7.8%.  It closed the week at the lowest level since September 18, 2015.  Over the last 2 weeks it has dropped 13.9%.

global sell-off

Continue reading

still trending higher

Still Trending Higher | China Update

China’s stock market’s are still trending higher. And yes they have been in that mode since January 2016. This is very similar to the U.S. market. But I do not believe that the Shanghai Composite or the Shenzhen Composite are in a new bull market. 

Hong Kong’s Hang Seng index has been much stronger than either the Shanghai or Shenzhen.  It’s most recent intermediate low was February 2016.  If it takes out its May 2015 high I will need to revisit my scenario for the Hang Seng. But until then I am looking for it turn back down at any moment.

In the video below I walk thru all three indexes’ weekly and daily charts. Continue reading

China Still Matters

China Still Matters, so What are the Charts Telling Us?

The Chinese economy hasn’t been in the news very much lately. And maybe that’s because their economy seems to be chugging right along. As the world’s 2nd largest economy it is a major influence on global markets. China still matters, and matters a lot. 

Three economic reports were released last night. Retail Sales was expected to be up 10.6% year over year and was actually reported as 10.7%. This performance is right in the range of the last 2 years but below 2013 and 2014.

Industrial Production was expected at 6.3% year over year and reported as 6.5%.  This level was higher than most of 2016, so showing stability but well below the 2013 and 2014 levels. 

The last report released was Fixed Asset Investment which was expected at 8.9% year over year but reported as 8.6%. This was the weakest growth in year over year since last December.  So two of three key reports were on track.

The Chinese economy appears to be holding steady but China stock markets seem to be giving a little different picture.  In today’s video I look at what the charts of the Shanghai Composite and Shenzhen Composite are telling us.  Continue reading

will China crow

Will China Crow This Year or Get Plucked?

Happy Chinese New Year! Today is the first day of the Chinese New Year and it’s the year of the Rooster. This celebration actually started on Friday, New Year’s Eve and goes on for a couple of weeks. It is also called the Spring Festival.  I talk about this more in a previous post.

The stock markets in China were closed on Friday and won’t open again until next Friday. The Hong Kong Stock Exchange is closed on Monday and Tuesday.

China Tensions

Continue reading

China's stock market

China Stock Market at a Crossroads

The China stock market as reflected by the Shanghai Composite and Shenzhen Composite indices are at a point where they have stretched their price action out in an ever compressing pattern over the last 10 months.

This won’t go on forever and I believe we are very close to a resolution.

In today’s Asia Update video I look at the Shanghai and Shenzhen indices, Hong Kong’s Hang Seng Index, India’s Nifty 50 and Japan’s Nikkei 225.

I also review two China ADRs, Weibo (WB) and Ctrip.com (CTRP).

Powered by WishList Member - Membership Software