Tag Archives for " Apple "

collateral damage

Collateral Damage in the China Trade War

The trade war with China is on. It started with aluminum and steel.  Now it seems to be escalating back and forth. The stock market is concerned because of course everyone knows…or they should, that this is how the Great Depression got fueled.  So what starts out as very targeted and seemingly under control, can rapidly spin out of control.  And this is where collateral damage occurs.

Bite Out of Apple

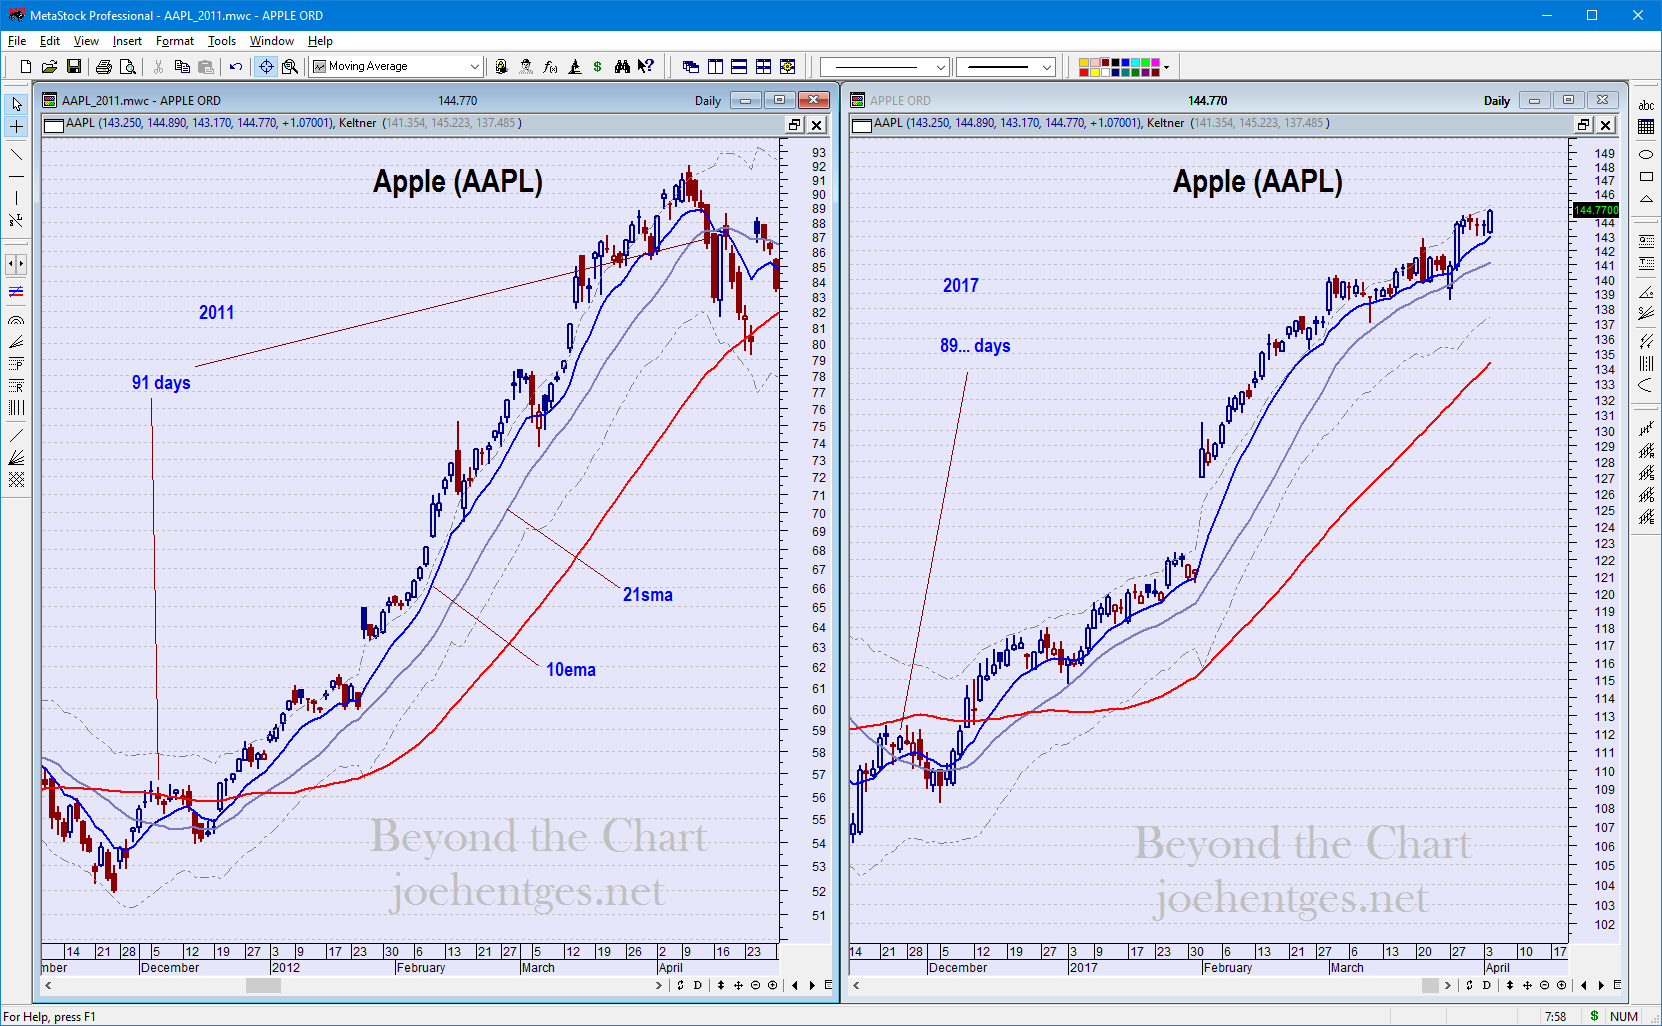
The concern with Apple is that it could get caught up in a trade war with China.  If China decided to impose tariffs of some kind on iPhones or various components, it would significantly hurt Apple.  Or China might organize a boycott of U.S. related products. China is just one concern related to Apple stock. There are other rumors floating about iPhone production and demand.

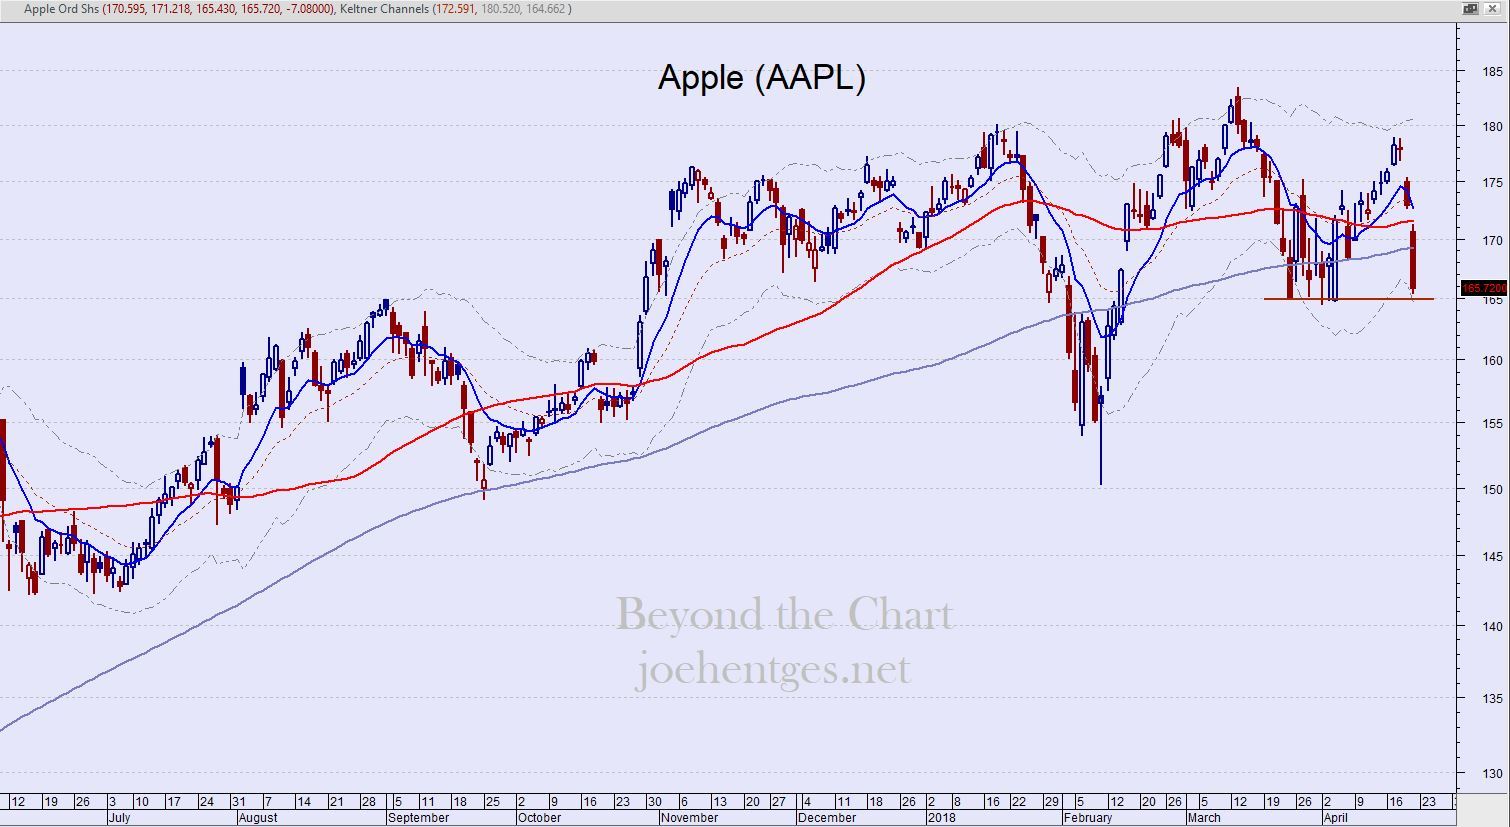
This week Apple (AAPL) stock got hit hard on Thursday – Friday dropping 6.8% and ended down $9 for the week. Apple’s chart below shows the key support at $165 that the bulls need to hold. If that breaks I believe it will rapidly test the February low.

Collateral Damage

If Apple gets hurt in this trade war with China then it has a rippling effect on several other stocks that supply Apple. Below are 4 stocks that are already showing signs of damage.

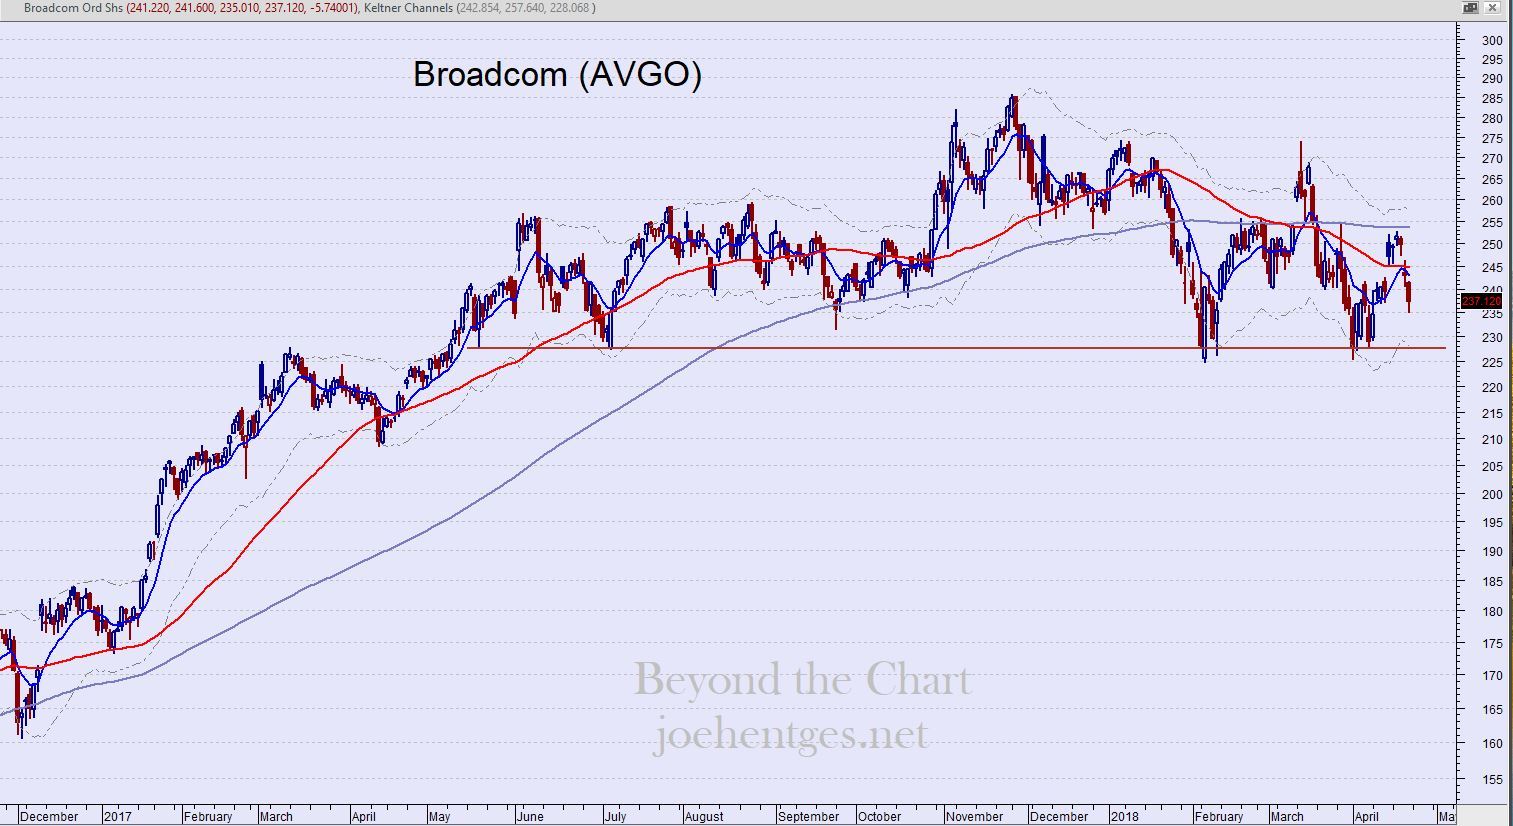
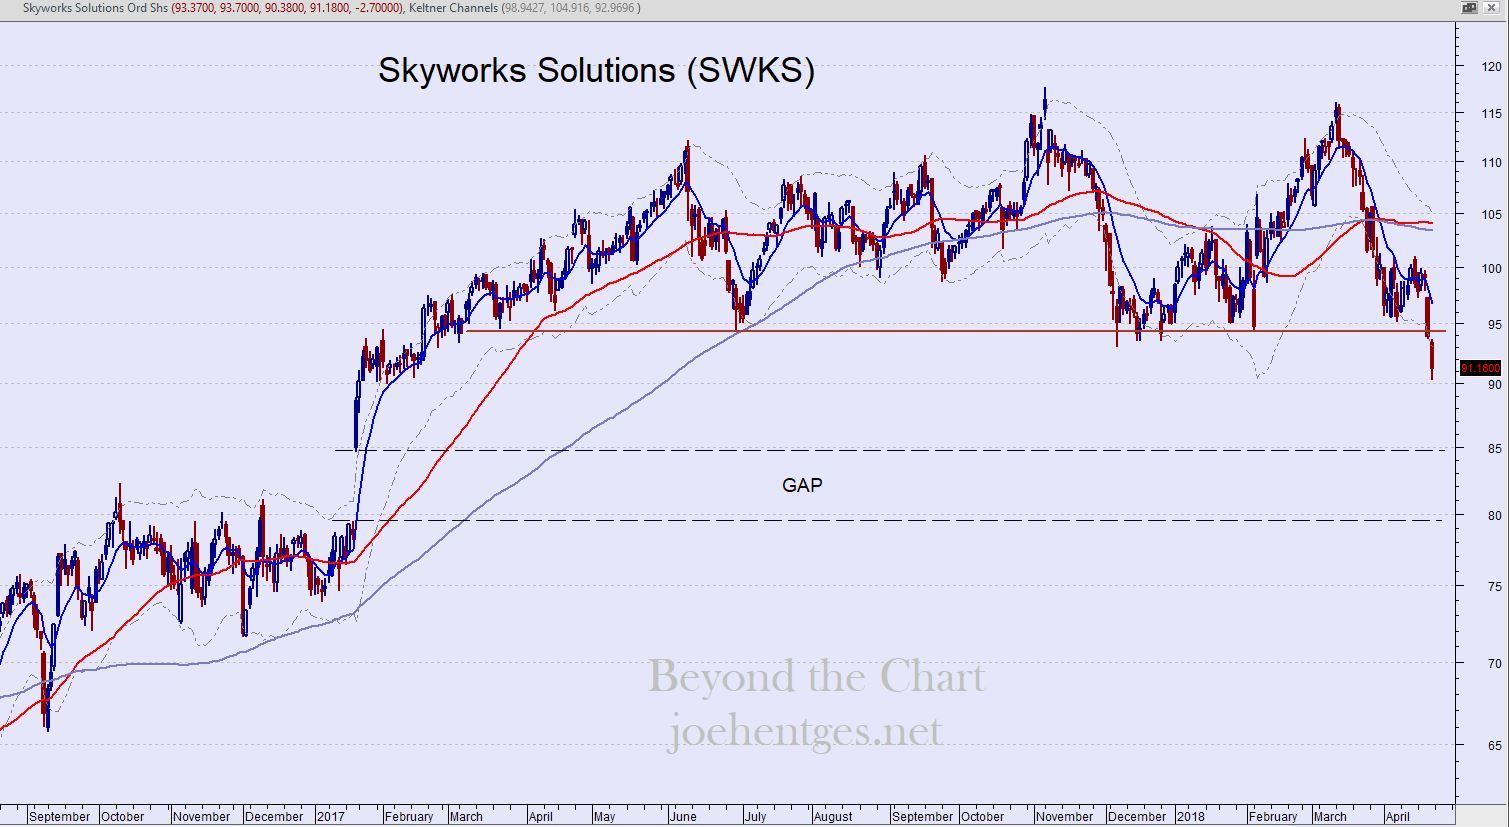
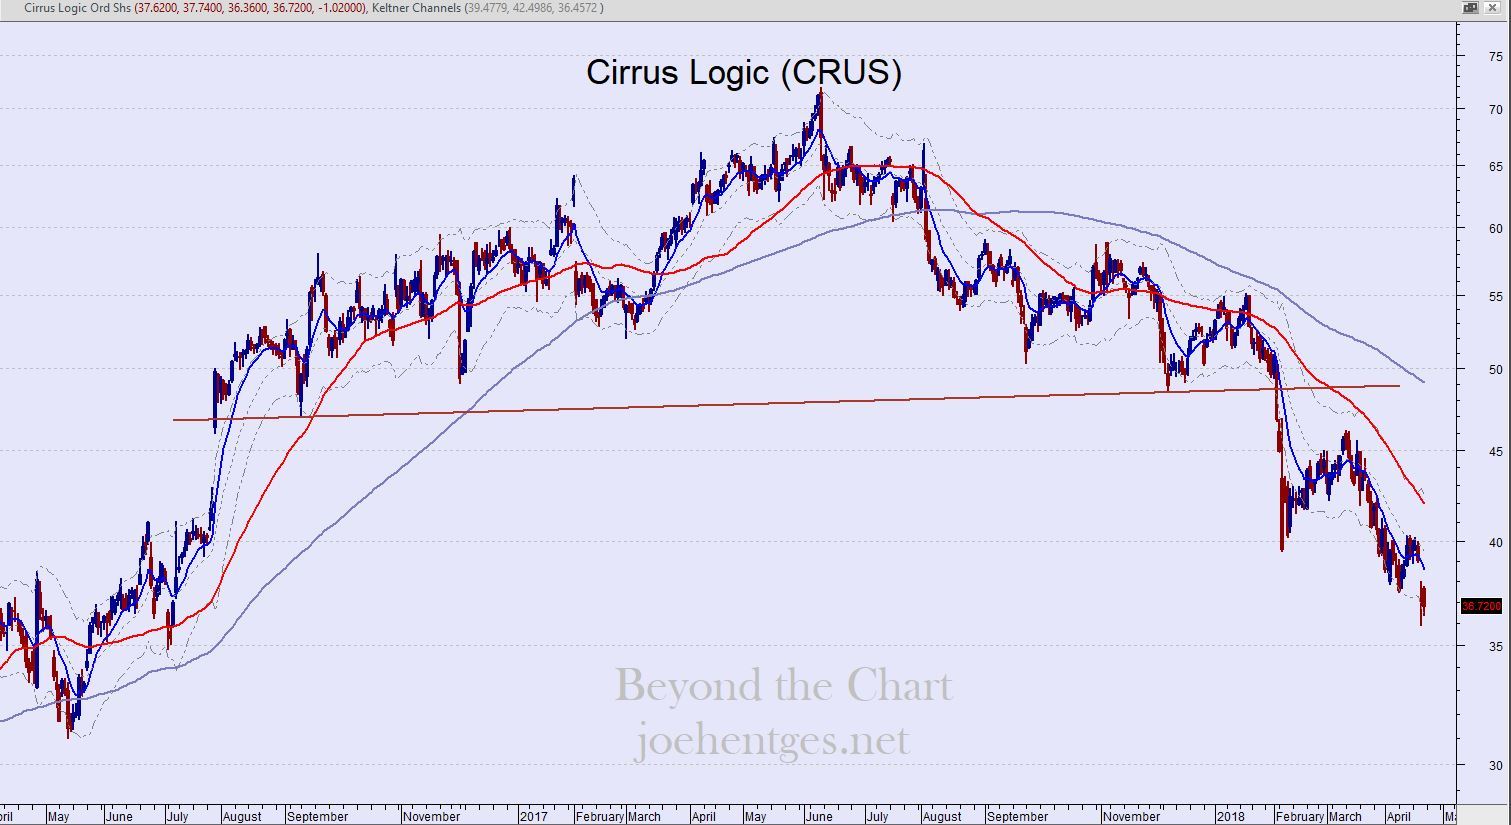
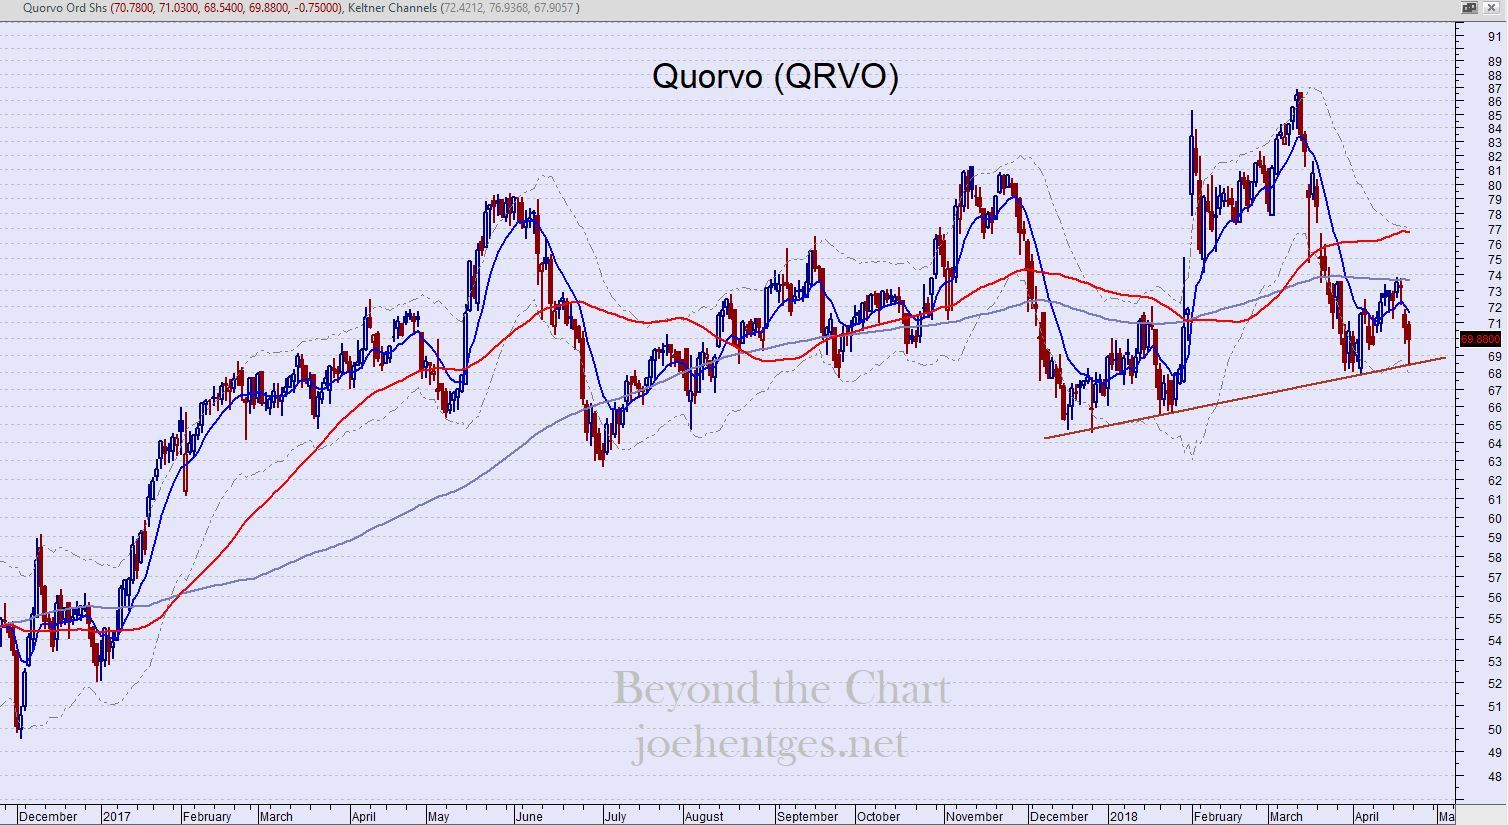
The first three stocks are showing signs of a major top. Quorvo is less clear but still at critical short term support.


compression week

Compression Week in the Stock Market

The big event for the stock market this week was the Federal Reserve Meeting on Tuesday-Wednesday. On Wednesday the Federal Reserve announced no change to interest rates but did say they plan to wind down their $4.5 trillion balance sheet starting in October. 

This is the balance sheet that they created thru the series of quantitative easings since the Financial Crisis.  This $4.5 trillion balance sheet is made up of treasuries and mortgage backed securities. 

So it is not unusual for the stock market to become a little cautious and tight during a Fed meeting but this tightness continued thru the remainder of the week. When you see the Dow Jones Industrial Average (DJIA) weekly chart in the video below, you will see why I am calling this a compression week.  It is one of the smallest weekly trading ranges in several months. 

Compression and expansion seem to cycle back and forth in the stock market.  So now that we have had a compression week, I am watching for some fireworks to happen in the market…it may take a couple of weeks.

This is like a flag being waved saying ‘hello, the market is telling you something’. Like a big cat watching you. You never know when if is going to explode into action.

In the video I review the DJIA daily and weekly charts, look at one of my key indicators and review 3 key ETFs.  This is just a brief snippet of what I provide my Insider Members in the Weekend Market Analysis video.  Also in today’s video I review Apple (AAPL), Facebook (FB) and Netflix (NFLX). 


Apple Rally

Apple Rally Now 89 Days and Counting

In the picture below you see a comparison of the 2011-2012 rally in Apple (AAPL) to the 2016-2017 rally currently underway.

In 2011 the 10 ema crossed above the 21 sma on December 6, 2011. The rally peaked on April 10, 2012 and the moving averages crossed to the downside on April 17, 2012. The length of the rally from initial upside cross to the downside cross was 91 trading days.

In 2016 the 10 ema crossed above the 21 sma on November 25, 2016. So far the rally is still on after 89 trading days. Today is April 5, 2017.  Observing the past, to live in the present, with eyes wide open.


Apple Rally

semiconductor stocks

Semiconductor Stocks getting hit, but so are lots of Tech Stocks

This week the semiconductor stocks got hit very hard on Thursday. The supposed catalyst was indications that Apple was cutting back on iPhone 7 production.  But many tech stocks are also getting hit.

Some say it is a rotation into sectors like finance, infrastructure and energy. But some of this is also related to global commerce and sourcing. Fears of a trade war with China are not helping stocks like Apple. Continue reading

crude oil

Has the Energy Sector Hit the Wall?

Today we look at the Energy Select Sector SPDR ETF (XLE) and ask whether the energy sector has hit the wall.

The XLE is one of the most active industry sector ETFs with a 50 day moving average of 95 million shares.  It tracks a market-cap weighted index of US energy companies in the S&P 500.  

Energy Sector

In the big decline from the peak in June 2014 to the low in January 2016, XLE smashed thru a major uptrend line from the 2002 low, in July 2015. It pulled back to it last November but then quickly fell away.

It has had a big move up off the January low, but running into significant resistance at 72.0. It has not broken down yet.  Watch for consecutive closes below the 10 week ema and then for the 10 ema to cross below the 21 sma.  Look at September 2014 and June 2015 for good examples.

Energy Sector

Weekly April 2011 – Sept 2016

The top three holdings in the Energy Sector ETF are Exxon Mobil (XOM) at 18.65%, Chevron (CVX) at 14.81% and Schlumberger (SLB) at 8.83%. I’ll start with Exxon Mobil. Continue reading

1 2 3

Powered by WishList Member - Membership Software